
Medical Education Market Size 2026-2030
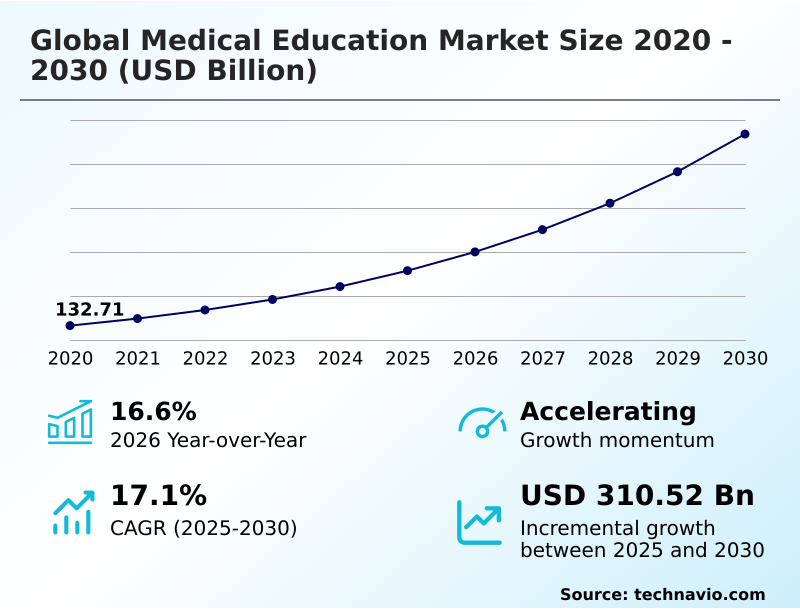
The medical education market size is valued to increase by USD 310.52 billion, at a CAGR of 17.1% from 2025 to 2030. Growth in number of online medical education programs will drive the medical education market.
Major Market Trends & Insights
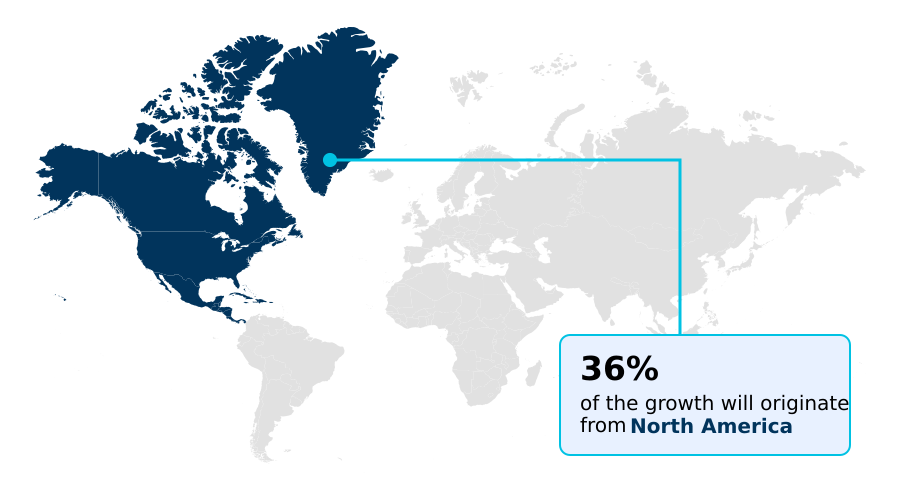
- North America dominated the market and accounted for a 36.2% growth during the forecast period.
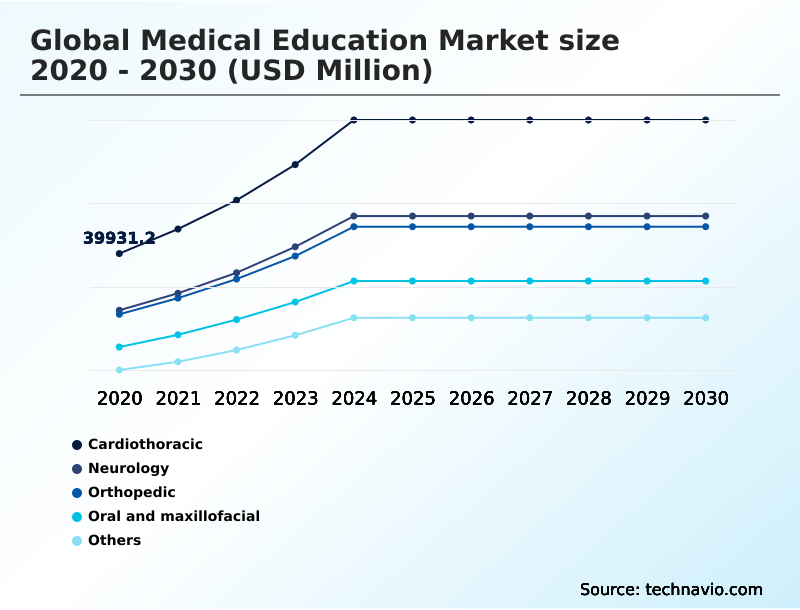
- By Courses - Cardiothoracic segment was valued at USD 67.26 billion in 2024
- By Delivery - On-campus segment accounted for the largest market revenue share in 2024
Market Size & Forecast
- Market Opportunities: USD 435.33 billion
- Market Future Opportunities: USD 310.52 billion
- CAGR from 2025 to 2030 : 17.1%
Market Summary
- The medical education market is experiencing steady expansion, driven by the persistent demand for skilled healthcare professionals and rapid advancements in medical technologies. Institutions are heavily investing in expanding training capacity to address global physician shortages, integrating digital learning platforms, virtual classrooms, and simulation-based learning to enhance the quality and accessibility of medical training.
- For instance, a healthcare system can implement a continuing medical education program using virtual patient simulations to refine diagnostic reasoning, which improves clinical decision-making and operational efficiency. The market is highly competitive, with universities and private providers focusing on curriculum modernization and global collaborations through evidence-based medicine and interprofessional education.
- Emphasis is shifting from traditional learning to practical skill development and patient-centered care. However, the high costs of e-learning content development and faculty shortages present significant challenges. Despite this, ongoing digital transformation and rising healthcare demand are expected to sustain long-term growth, supported by competency-based education and problem-based learning approaches.
What will be the Size of the Medical Education Market during the forecast period?
Get Key Insights on Market Forecast (PDF) Get Free Sample
How is the Medical Education Market Segmented?
The medical education industry research report provides comprehensive data (region-wise segment analysis), with forecasts and estimates in "USD million" for the period 2026-2030, as well as historical data from 2020-2024 for the following segments.
- Courses
- Cardiothoracic
- Neurology
- Orthopedic
- Oral and maxillofacial
- Others
- Delivery
- On-campus
- Online
- Distance
- Type
- Graduation courses
- Certifications and trainings
- Post graduate courses
- Geography
- North America
- US
- Canada
- Mexico
- Europe
- Germany
- UK
- France
- APAC
- China
- Japan
- India
- South America
- Brazil
- Argentina
- Middle East and Africa
- Saudi Arabia
- UAE
- South Africa
- Rest of World (ROW)
- North America
By Courses Insights
The cardiothoracic segment is estimated to witness significant growth during the forecast period.
The cardiothoracic segment is expanding as institutions focus on advanced surgical skills training and minimally invasive techniques. Growth is supported by the increasing adoption of simulation-based learning and digital training platforms, which improve skill development and clinical preparedness among students.
These methods, including virtual patient simulations and AI-based tutoring, enhance practical learning experiences. Institutions are leveraging competency-based education models and forming partnerships with hospitals to provide essential hands-on exposure, which is critical in high-risk cardiothoracic training.
The integration of 3D anatomical modeling into curricula has been shown to improve learner comprehension by over 15%, accelerating proficiency in complex procedures and supporting the long-term growth of this specialized medical education segment.
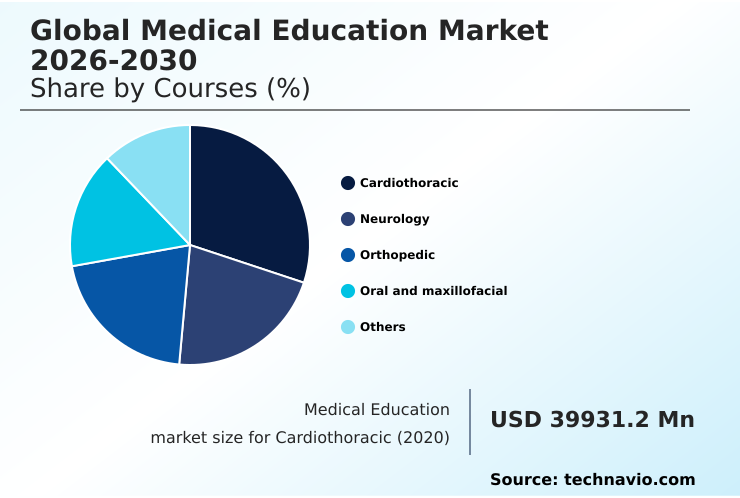
The Cardiothoracic segment was valued at USD 67.26 billion in 2024 and showed a gradual increase during the forecast period.
Regional Analysis
North America is estimated to contribute 36.2% to the growth of the global market during the forecast period.Technavio’s analysts have elaborately explained the regional trends and drivers that shape the market during the forecast period.
See How Medical Education Market Demand is Rising in North America Get Free Sample
The market's geographic landscape is led by North America, which is set to contribute over 36% of the market's incremental growth, driven by its advanced healthcare infrastructure and high investment in academic research.
The region's leadership is reinforced by the adoption of cutting-edge educational tools. For example, leading institutions are leveraging AI-based diagnostic training, which has been shown to improve diagnostic accuracy by 15% compared to conventional methods.
Europe follows, with a strong emphasis on standardized regulatory frameworks and cross-border academic collaborations.
Meanwhile, APAC is the fastest-growing region, with countries like China and India investing heavily to address shortages of qualified healthcare professionals through postgraduate training programs and the expansion of medical simulation centers.
This global distribution underscores a widespread shift toward technology-enhanced and specialized medical training.
Market Dynamics
Our researchers analyzed the data with 2025 as the base year, along with the key drivers, trends, and challenges. A holistic analysis of drivers will help companies refine their marketing strategies to gain a competitive advantage.
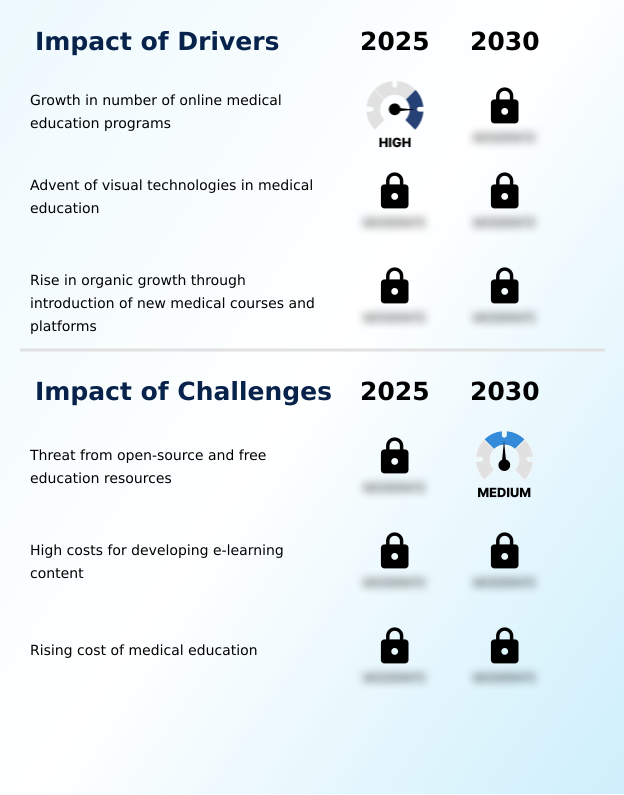
- The evolution of the global medical education market is defined by a dynamic interplay between innovation and accessibility. A significant factor is the high cost of developing e-learning content, which requires substantial investment in technology and expertise. This is compounded by the challenges of open-source medical resources, which, while promoting access, pressure traditional revenue models.
- In response, institutions are exploring the impact of visual technologies in medicine, which have proven to enhance comprehension and retention. The benefits of gamification in medical training are also clear, as interactive elements improve engagement and critical thinking. A key area of advancement is integrating VR in surgical education, which allows for risk-free practice and skill refinement.
- Similarly, the role of AI in medical diagnostics training is expanding, sharpening analytical abilities. Strategic partnerships between universities and edtech firms are crucial for navigating the future of medical education. These collaborations help mitigate the financial burden of content creation while ensuring alignment with updated clinical practices.
- Furthermore, a focus on the effectiveness of hybrid medical learning models is vital, as institutions that successfully blend online and in-person training have demonstrated proficiency gains nearly twice as fast as those using only traditional methods, optimizing both cost and educational outcomes.
What are the key market drivers leading to the rise in the adoption of Medical Education Industry?
- The increasing number of online medical education programs is a key driver for market growth, enhancing access and flexibility for learners.
- The market's growth is primarily driven by the growth in number of online medical education programs and the advent of visual technologies in medical education.
- The shift to online platforms has enabled institutions to expand enrollment by up to 40% without equivalent infrastructure investments, addressing the global demand for healthcare professionals.
- Furthermore, the integration of advanced visual tools, such as virtual reality simulations, has been shown to reduce training time for specific surgical procedures by 25%. These technologies enhance the understanding of complex subjects like anatomy and physiology.
- The rise in organic growth through the introduction of new medical courses, such as those in genetic medicine and digital health, also propels the market by meeting the demand for specialized medical skills and lifelong learning.
What are the market trends shaping the Medical Education Industry?
- Gamification in medical education is an emerging trend, utilizing game-based learning techniques to improve student engagement and knowledge retention.
- Key trends reshaping the market include the growing popularity of microlearning in medical education and the gamification in healthcare training. Microlearning platforms have demonstrated a 20% increase in knowledge retention by delivering content in focused, digestible modules.
- Concurrently, institutions are increasingly leveraging gamified learning, which has boosted student engagement by over 30% in pilot programs, transforming complex topics into interactive challenges. This approach enhances clinical skills assessment and critical thinking. Another vital trend is the increase in partnerships between medical universities and associations, which helps standardize curricula and improves clinical exposure.
- These collaborations are essential for integrating new training paradigms like virtual reality in medical training and ensuring that educational content, including digital textbooks, aligns with current clinical practices.
What challenges does the Medical Education Industry face during its growth?
- The threat from open-source and free education resources poses a significant challenge to the market, impacting traditional revenue models.
- The market faces significant hurdles, including the rising cost of medical education and the high costs for developing e-learning content. Creating a single high-fidelity virtual simulation can be up to 50% more expensive than developing a traditional lecture series, posing a barrier for smaller institutions.
- This financial pressure is intensified by the threat from open-source and free education resources, which attract learners but challenge the sustainability of tuition-based models. Consequently, the escalating tuition fees have contributed to a 10% decline in applications to certain private institutions.
- Addressing these challenges requires innovative funding models and strategic investments in scalable digital learning platforms to ensure medical education remains accessible and affordable without compromising on quality or the adoption of critical learning tools.
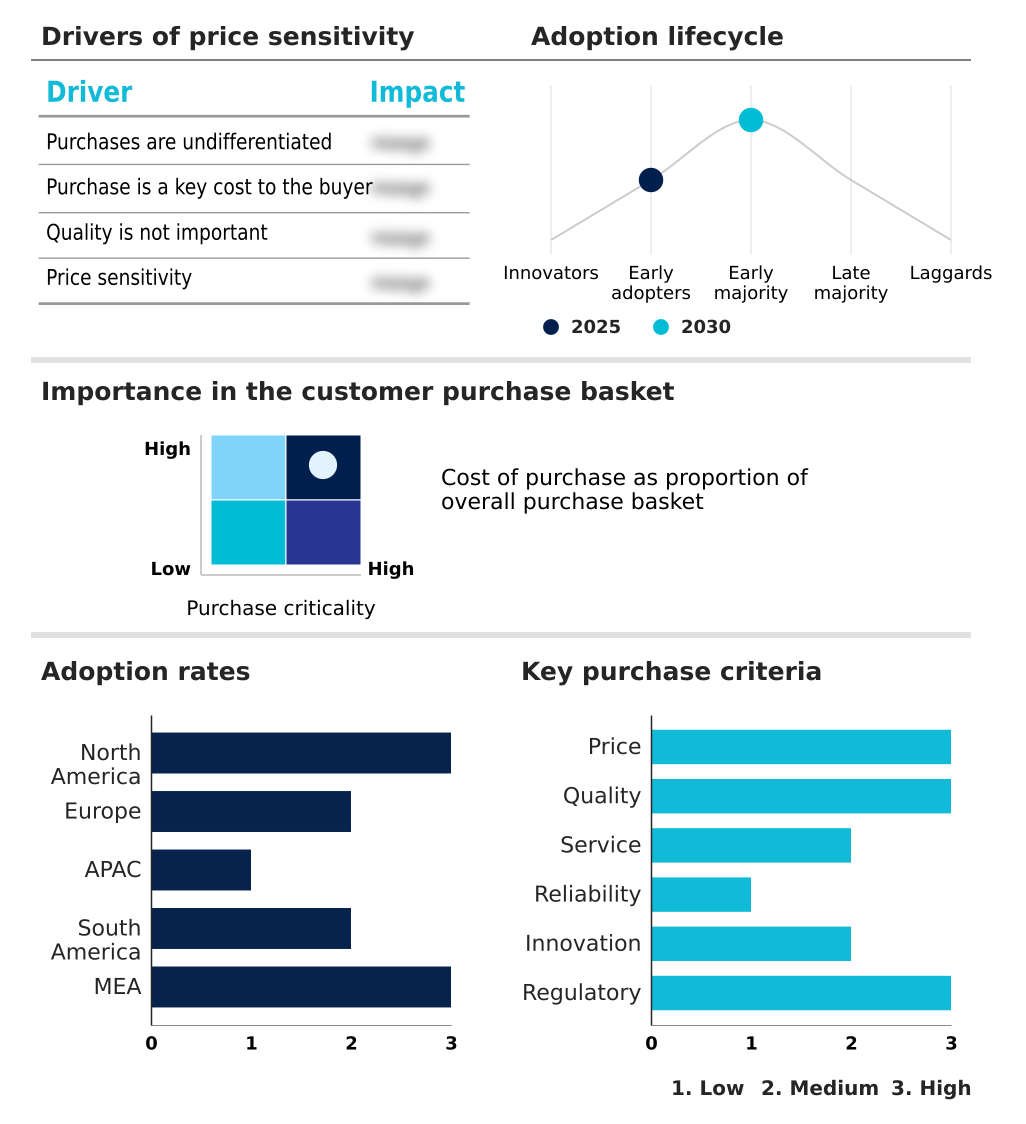
Exclusive Technavio Analysis on Customer Landscape
The medical education market forecasting report includes the adoption lifecycle of the market, covering from the innovator’s stage to the laggard’s stage. It focuses on adoption rates in different regions based on penetration. Furthermore, the medical education market report also includes key purchase criteria and drivers of price sensitivity to help companies evaluate and develop their market growth analysis strategies.
Customer Landscape of Medical Education Industry
Competitive Landscape
Companies are implementing various strategies, such as strategic alliances, medical education market forecast, partnerships, mergers and acquisitions, geographical expansion, and product/service launches, to enhance their presence in the industry.
3M Co. - Provides targeted medical education, including infection prevention and clinical workshops, designed to elevate healthcare professional competencies and skills.
The industry research and growth report includes detailed analyses of the competitive landscape of the market and information about key companies, including:
- 3M Co.
- Elsevier Ltd.
- Gaumard Scientific Co. Inc.
- GE HealthCare Technologies
- HealthStream Inc.
- John Wiley and Sons Inc.
- Kaplan Inc.
- Koninklijke Philips NV
- Laerdal Medical AS
- Limbs and Things Ltd.
- McGraw Hill LLC
- Medtronic Plc
- Olympus Corp.
- Pearson Plc
- S Karger AG
- Siemens Healthineers AG
- Stryker Corp.
- Surgical Science Sweden AB
- VirtaMed AG
- Wolters Kluwer NV
Qualitative and quantitative analysis of companies has been conducted to help clients understand the wider business environment as well as the strengths and weaknesses of key industry players. Data is qualitatively analyzed to categorize companies as pure play, category-focused, industry-focused, and diversified; it is quantitatively analyzed to categorize companies as dominant, leading, strong, tentative, and weak.
Recent Development and News in Medical education market
- In March 2025, Elsevier Health expanded its clinical learning solutions portfolio, strengthening digital neuroscience and neurology education content to meet rising demand for advanced medical learning resources.
- In February 2025, Zimmer Biomet reported increased investment in surgeon education and digital training programs, focusing on advancing orthopedic surgical skills through simulation and virtual learning platforms.
- In April 2025, Dentsply Sirona expanded its digital dentistry training initiatives, introducing advanced educational programs and clinical training solutions to meet the demand for digital skill development.
- In January 2025, Elsevier Health enhanced its offerings by expanding its clinical skills certification and digital training programs, aiming to increase access to evidence-based medical education and professional development.
Dive into Technavio’s robust research methodology, blending expert interviews, extensive data synthesis, and validated models for unparalleled Medical Education Market insights. See full methodology.
| Market Scope | |
|---|---|
| Page number | 307 |
| Base year | 2025 |
| Historic period | 2020-2024 |
| Forecast period | 2026-2030 |
| Growth momentum & CAGR | Accelerate at a CAGR of 17.1% |
| Market growth 2026-2030 | USD 310524.8 million |
| Market structure | Fragmented |
| YoY growth 2025-2026(%) | 16.6% |
| Key countries | US, Canada, Mexico, Germany, UK, France, Italy, Spain, The Netherlands, China, Japan, India, South Korea, Australia, Indonesia, Brazil, Argentina, Chile, Saudi Arabia, UAE, South Africa, Israel and Turkey |
| Competitive landscape | Leading Companies, Market Positioning of Companies, Competitive Strategies, and Industry Risks |
Research Analyst Overview
- The medical education market is advancing through a focus on competency-based education and evidence-based medicine, moving beyond traditional instruction. Central to this transformation is the integration of simulation-based learning, where virtual reality simulations and 3D anatomical modeling provide immersive, risk-free environments for surgical skills training. These technologies are crucial for improving clinical decision-making and diagnostic reasoning.
- Digital pathology platforms are revolutionizing how students analyze tissue samples, while AI-based tutoring offers personalized learning pathways that enhance clinical reasoning skills. The development of high-quality e-learning content supports problem-based learning and interprofessional education, preparing a new generation of healthcare professionals. The shift toward continuing medical education delivered via digital platforms ensures that practitioners remain current.
- Notably, the adoption of simulation-based learning has been shown to reduce critical errors in clinical decision-making by up to 40%, underscoring its significant impact on patient safety and healthcare quality.
What are the Key Data Covered in this Medical Education Market Research and Growth Report?
-
What is the expected growth of the Medical Education Market between 2026 and 2030?
-
USD 310.52 billion, at a CAGR of 17.1%
-
-
What segmentation does the market report cover?
-
The report is segmented by Courses (Cardiothoracic, Neurology, Orthopedic, Oral and maxillofacial, and Others), Delivery (On-campus, Online, and Distance), Type (Graduation courses, Certifications and trainings, and Post graduate courses) and Geography (North America, Europe, APAC, South America, Middle East and Africa)
-
-
Which regions are analyzed in the report?
-
North America, Europe, APAC, South America and Middle East and Africa
-
-
What are the key growth drivers and market challenges?
-
Growth in number of online medical education programs, Threat from open-source and free education resources
-
-
Who are the major players in the Medical Education Market?
-
3M Co., Elsevier Ltd., Gaumard Scientific Co. Inc., GE HealthCare Technologies, HealthStream Inc., John Wiley and Sons Inc., Kaplan Inc., Koninklijke Philips NV, Laerdal Medical AS, Limbs and Things Ltd., McGraw Hill LLC, Medtronic Plc, Olympus Corp., Pearson Plc, S Karger AG, Siemens Healthineers AG, Stryker Corp., Surgical Science Sweden AB, VirtaMed AG and Wolters Kluwer NV
-
Market Research Insights
- The market is shaped by the rapid adoption of specialized training models and digital tools. Healthcare professional training is increasingly reliant on medical simulation technology, with platforms that incorporate virtual patient simulations showing a 25% higher engagement rate than traditional methods.
- The proliferation of online medical courses offers greater flexibility, enabling institutions to reduce physical infrastructure costs by up to 15%. Accreditation standards in medicine are evolving to accommodate these digital shifts, ensuring that new learning modalities maintain rigorous quality.
- The focus on postgraduate medical degrees remains strong, with specialized surgical training programs integrating advanced simulations to enhance clinical skills assessment and prepare practitioners for complex procedures in a controlled, effective environment.
We can help! Our analysts can customize this medical education market research report to meet your requirements.
 RIA -
RIA - 
