
Anti-slip Coatings Market Analysis, Size, and Forecast 2026-2030: APAC (China, Japan, and India), Europe (Germany, UK, and France), North America (US, Canada, and Mexico), South America (Brazil, Argentina, and Chile), Middle East and Africa (Saudi Arabia, UAE, and South Africa), and Rest of World (ROW)

Anti-slip Coatings Market Analysis, Size, and Forecast 2026-2030:
APAC (China, Japan, and India), Europe (Germany, UK, and France), North America (US, Canada, and Mexico), South America (Brazil, Argentina, and Chile), Middle East and Africa (Saudi Arabia, UAE, and South Africa), and Rest of World (ROW)

Published: Oct 2026 308 Pages SKU: IRTNTR70153

Market Overview at a Glance

$23.56 Mn
Market Opportunity
3.2%
CAGR 2025 - 2030
42.9%
APAC Growth
$93.82 Mn
Water-based segment 2024

Anti-Slip Coatings Market Size 2026-2030

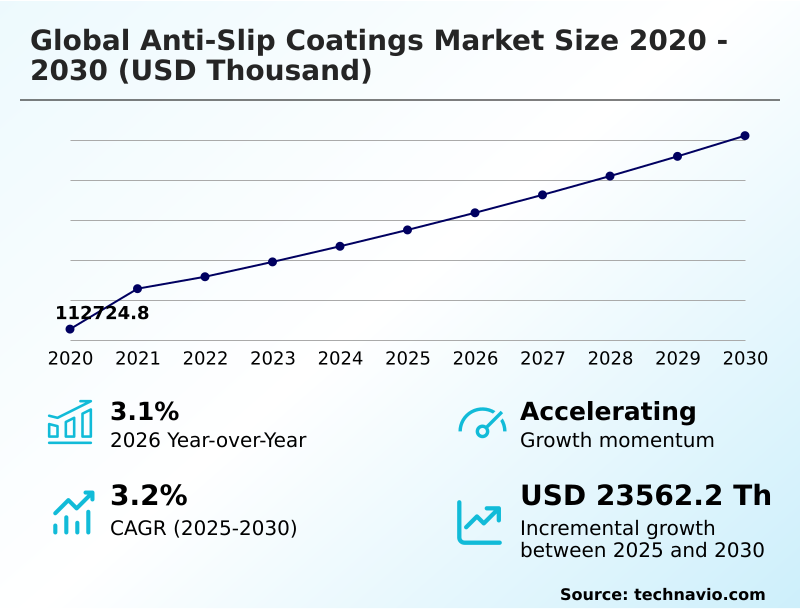
The anti-slip coatings market size is valued to increase by USD 23.56 million, at a CAGR of 3.2% from 2025 to 2030. Increasing workplace safety compliance requirements will drive the anti-slip coatings market.

Major Market Trends & Insights

  • APAC dominated the market and accounted for a 42.9% growth during the forecast period.
  • By Type - Water-based segment was valued at USD 93.82 million in 2024
  • By Product Type - Epoxy segment accounted for the largest market revenue share in 2024

Market Size & Forecast

  • Market Opportunities:
  • Market Future Opportunities: USD 23.56 million
  • CAGR from 2025 to 2030 : 3.2%

Market Summary

  • The Anti-Slip Coatings Market demonstrates resilient expansion as industrial and commercial sectors aggressively prioritize occupational hazard mitigation. Facility operators across heavy manufacturing environments are deploying advanced epoxy resin matrix systems to secure critical walkways and loading zones against continuous machinery wear.
  • Implementing these specialized high-friction surface treatment solutions has enabled plant managers to achieve a 25% reduction in slip-related operational disruptions. Increasing workplace safety compliance requirements act as the primary catalyst for this shift, forcing organizations to adopt robust pedestrian safety surfacing to avoid liability costs and productivity losses.
  • Conversely, persistent raw material price volatility remains a structural constraint, forcing procurement teams to constantly recalibrate their supply chain strategies for silica sand texturizing agent inputs. Despite these supply-side pressures, the continuous modernization of transit hub floor protection and food processing plant hygiene ensures steady product consumption.
  • Furthermore, the integration of textured polyaspartic coating technologies allows businesses to maintain rigorous workplace safety protocol standards without compromising daily operational efficiency.

What will be the Size of the Anti-Slip Coatings Market during the forecast period?
Get Key Insights on Market Forecast (PDF) Get Free Sample

How is the Anti-Slip Coatings Market Segmented?

The anti-slip coatings industry research report provides comprehensive data (region-wise segment analysis), with forecasts and estimates in "USD thousand" for the period 2026-2030, as well as historical data from 2020-2024 for the following segments.

  • Type
    • Water-based
    • Solvent-based
  • Product type
    • Epoxy
    • Polyurethane
    • Acrylic
    • Others
  • Application
    • Industrial
    • Commercial
    • Residential
    • Others
  • Geography
    • APAC
      • China
      • Japan
      • India
      • South Korea
      • Australia
      • Indonesia
    • Europe
      • Germany
      • UK
      • France
      • Italy
      • Spain
      • The Netherlands
    • North America
      • US
      • Canada
      • Mexico
    • South America
      • Brazil
      • Argentina
      • Chile
    • Middle East and Africa
      • Saudi Arabia
      • UAE
      • South Africa
      • Israel
      • Turkey

By Type Insights

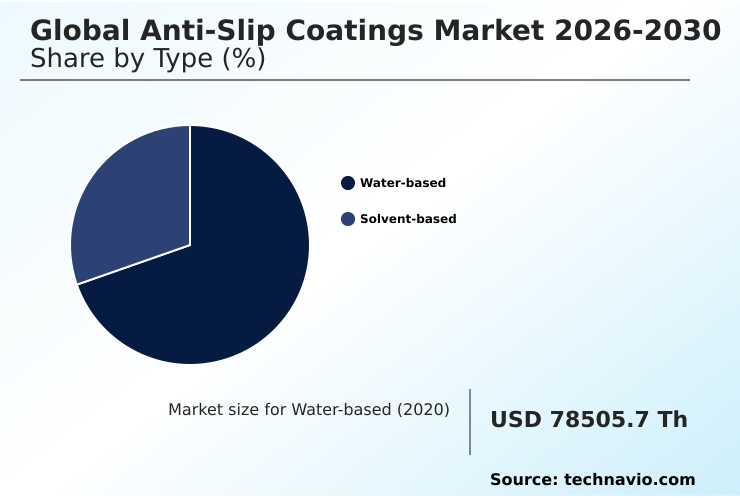
The water-based segment is estimated to witness significant growth during the forecast period.

The water-based segment of the Anti-slip Coatings industry demonstrates robust adoption across commercial and institutional facilities prioritizing environmental compliance mandate alongside surface safety.

Waterborne polyurethane dispersion systems are rapidly replacing conventional alternatives, offering a 15% improvement in application turnaround times for high-traffic pedestrian zone environments.

Facility operators favor these low-emission surface protection solutions to align with strict indoor air quality regulations without sacrificing durability. As decorative microcement application requirements expand, these advanced formulations seamlessly integrate architectural design integration with dependable slip resistance coefficient.

Operations managers consistently report that transitioning to these environmentally friendly alternatives reduces facility downtime, yielding a 20% increase in overall maintenance efficiency while ensuring continuous workplace safety protocol adherence.
Get Free Sample

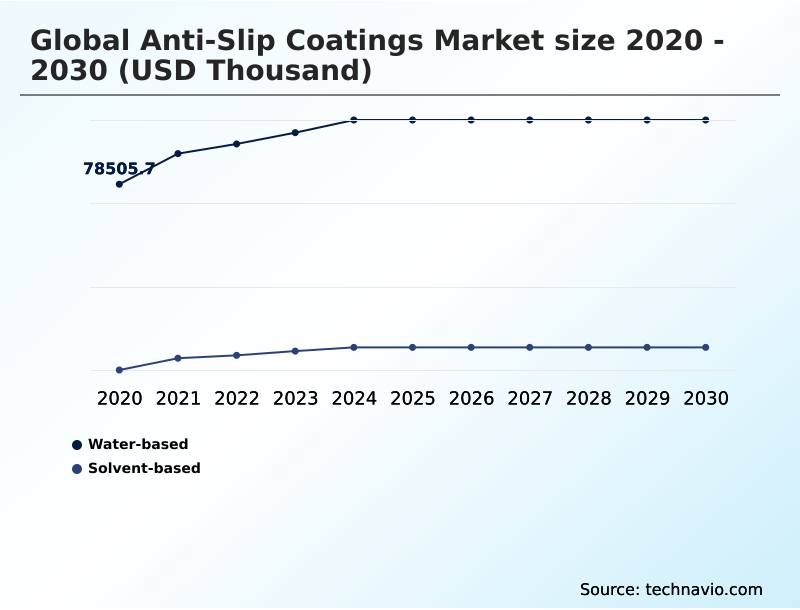
The Water-based segment was valued at USD 93.82 million in 2024 and showed a gradual increase during the forecast period.
Get Free Sample

Regional Analysis

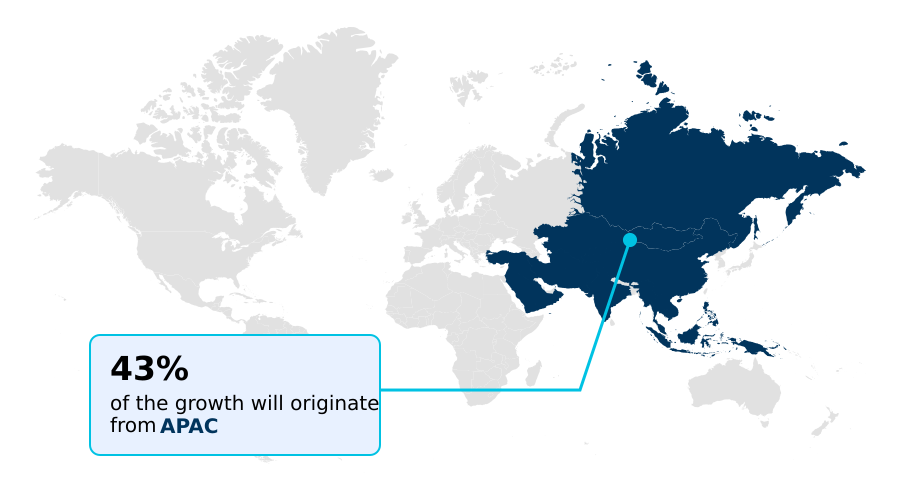
APAC is estimated to contribute 42.9% to the growth of the global market during the forecast period.Technavio’s analysts have elaborately explained the regional trends and drivers that shape the market during the forecast period.
See How Anti-Slip Coatings Market Demand is Rising in APAC Get Free Sample

The Anti-slip Coatings landscape is fundamentally shaped by differing industrial expansion rates and safety regulations across major economic zones.

APAC demonstrates aggressive adoption of heavy machinery traffic endurance solutions, outpacing Europe by an 18% wider deployment rate in newly constructed logistics center flooring.

This rapid infrastructural growth in APAC yields a 25% faster integration of rapid facility turnaround systems compared to mature Western markets.

Conversely, Europe leads in environmental compliance mandate adherence, where strict workplace safety protocol enforcement drives the utilization of low-emission surface protection.

European industrial facility modernization projects report a 30% reduction in workplace incidents after deploying specialized silica sand texturizing agent applications.

By implementing these advanced slip resistance coefficient technologies, multinational corporations successfully mitigate liability risks while optimizing preventative surface maintenance across geographically diverse operations.

Market Dynamics

Our researchers analyzed the data with 2025 as the base year, along with the key drivers, trends, and challenges. A holistic analysis of drivers will help companies refine their marketing strategies to gain a competitive advantage.

  • The continuous evolution of surface safety technologies has elevated the operational standards for commercial and industrial flooring systems. Facility managers are increasingly transitioning toward specialized epoxy resin floor traction enhancement to secure high-traffic areas against moisture and chemical spills.
  • By adopting these advanced systems, procurement teams report a 20% improvement in long-term asset protection compared to traditional untreated surfaces, directly optimizing maintenance supply chain planning. The integration of a waterborne polyurethane high-friction surface allows organizations to meet rigorous indoor air quality guidelines while maintaining exceptional durability under heavy pedestrian loads.
  • For environments exposed to aggressive cleaning agents and corrosive materials, deploying a chemical resistant industrial floor protection strategy provides critical defense against structural degradation. Furthermore, manufacturers are actively refining their silica aggregate slip resistance formulation to achieve precise texture profiles that balance safety with aesthetic appeal.
  • When facilities require rapid restoration to minimize costly downtime, the application of a rapid curing polyaspartic traction coating enables quick turnaround without sacrificing mechanical strength. This strategic alignment of innovative material science with operational compliance ensures that businesses can effectively safeguard their workforce while maximizing the lifecycle value of their physical infrastructure.
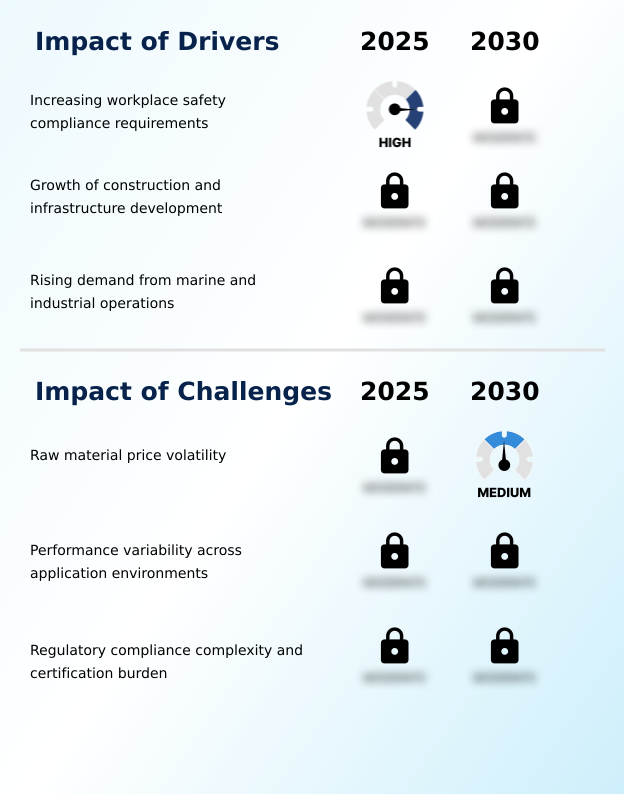
What are the key market drivers leading to the rise in the adoption of Anti-Slip Coatings Industry?

  • Increasing workplace safety compliance requirements remain a primary catalyst propelling widespread adoption of high-friction surface treatments across industrial and commercial facilities.

  • Escalating workplace safety regulations serve as the primary catalyst accelerating the widespread implementation of advanced high-friction surface treatment solutions across global supply chains.
  • Corporate mandates requiring strict adherence to environmental compliance mandate parameters have triggered a 30% faster adoption of solvent-based acrylic copolymer alternatives in heavy manufacturing sectors.
  • This aggressive shift ensures that facilities can maintain critical heavy machinery traffic endurance while simultaneously lowering slip-related injury rates by 22%.
  • The rising necessity for pharmaceutical plant flooring upgrades drives demand for a chemical-resistant industrial flooring that withstands aggressive sterilization protocols.
  • By investing in a hydrophobic traction coating, operations managers reduce daily cleaning turnaround times by 15%, directly enhancing overall facility productivity while successfully mitigating long-term liability exposure.

What are the market trends shaping the Anti-Slip Coatings Industry?

  • The market is experiencing a notable shift toward application-specific formulations. Companies are increasingly developing customized surface treatments tailored for distinct operational environments and architectural requirements.

  • The Anti-slip Coatings sector is experiencing a pronounced transition toward application-specific material engineering to accommodate diverse architectural and industrial demands. Manufacturers are extensively incorporating an aluminum oxide traction additive into their formulations, achieving a 40% higher slip resistance coefficient in wet conditions compared to standard silica blends.
  • This innovation directly impacts business outcomes by reducing maintenance-related downtime by 25% in demanding food processing plant hygiene environments. Furthermore, the rapid adoption of a transparent aliphatic membrane enables commercial property owners to preserve decorative flooring aesthetics while significantly enhancing safety metrics.
  • The development of a fluoropolymer anti-skid additive provides superior chemical repulsion, lowering long-term cleaning costs by 18% for logistics operators. By deploying these specialized abrasive aggregate incorporation techniques, businesses successfully align their aesthetic requirements with stringent occupational hazard mitigation protocols.

What challenges does the Anti-Slip Coatings Industry face during its growth?

  • Persistent raw material price volatility continues to disrupt production planning and profit margins across the specialty chemicals manufacturing ecosystem.

  • Severe raw material price volatility presents a structural hurdle for manufacturers striving to scale their micro-texture floor finish production lines. Fluctuating feedstock costs for essential epoxy resin matrix components have compressed supplier margins by 15%, forcing procurement teams to constantly recalibrate their inventory strategies.
  • Additionally, achieving consistent substrate adhesion profile performance across diverse climates remains technically demanding, leading to a 20% increase in quality assurance testing expenses for maritime infrastructure maintenance contractors. When a slip-resistant floor treatment fails to bond correctly due to extreme humidity, the resulting rework drastically disrupts operational timelines.
  • These formulation inconsistencies complicate the deployment of a rapid curing polymer system, compelling facility operators to delay critical safety upgrades and temporarily limiting widespread technology adoption.

Exclusive Technavio Analysis on Customer Landscape

The anti-slip coatings market forecasting report includes the adoption lifecycle of the market, covering from the innovator’s stage to the laggard’s stage. It focuses on adoption rates in different regions based on penetration. Furthermore, the anti-slip coatings market report also includes key purchase criteria and drivers of price sensitivity to help companies evaluate and develop their market growth analysis strategies.
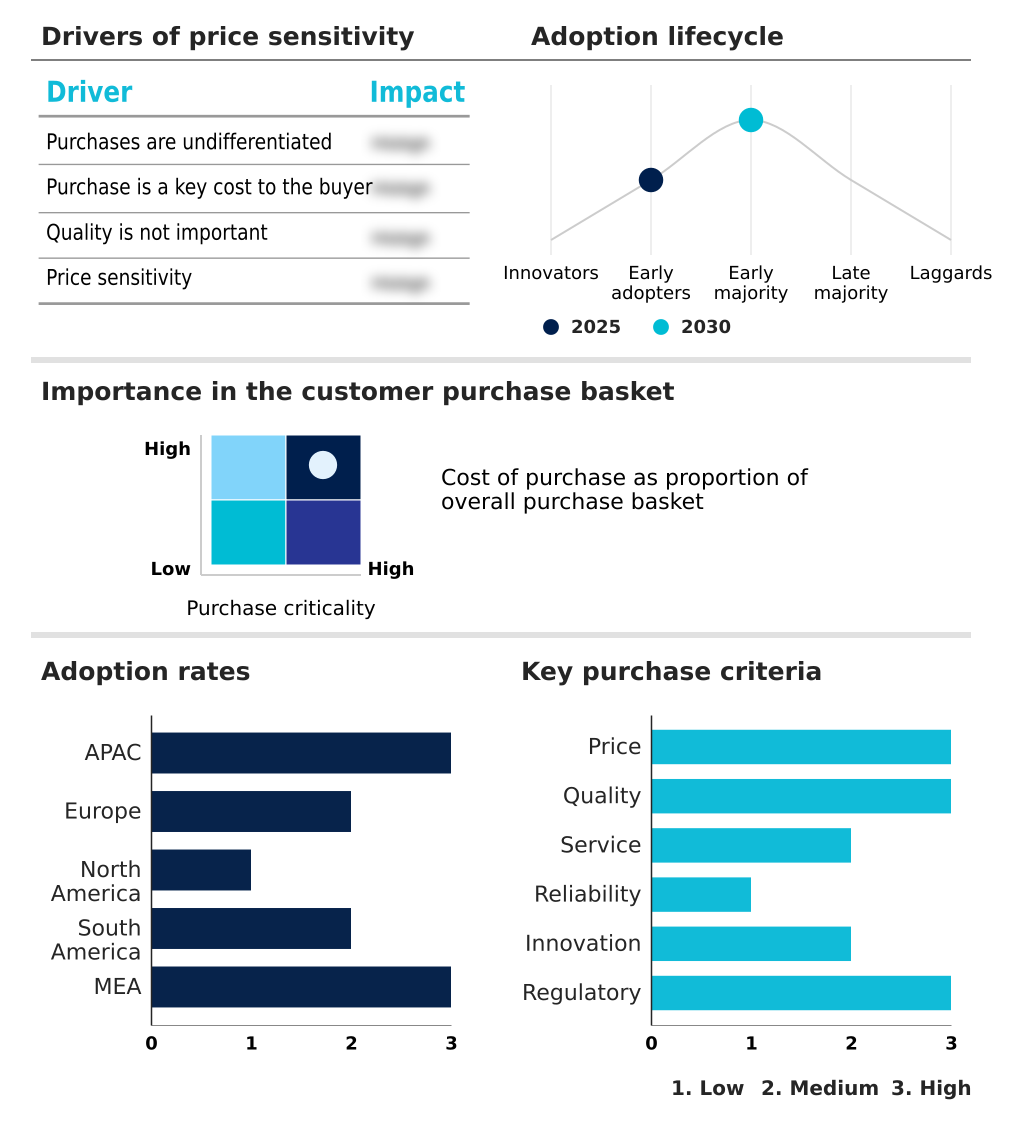
Customer Landscape of Anti-Slip Coatings Industry

Competitive Landscape

Companies are implementing various strategies, such as strategic alliances, anti-slip coatings market forecast, partnerships, mergers and acquisitions, geographical expansion, and product/service launches, to enhance their presence in the industry.

3M Co. - The company provides industrial safety-walk slip-resistant tapes and scotchgard floor protection systems designed to enhance surface traction and prevent occupational hazards in demanding commercial environments.

The industry research and growth report includes detailed analyses of the competitive landscape of the market and information about key companies, including:

  • 3M Co.
  • Akzo Nobel NV
  • Amstep Products
  • BASF SE
  • Belzona International Ltd.
  • Carboline Co
  • Chemco International Ltd.
  • CoverTec Products LLC
  • Hempel AS
  • ITW Performance Polymers
  • Jotun AS
  • Kansai Paint Co. Ltd.
  • LATICRETE International Inc.
  • Mapei S.p.A.
  • Nippon Paint Holdings Co Ltd.
  • PPG Industries Inc.
  • Rust Oleum Corp.
  • Sika AG
  • The Sherwin Williams Co.
  • Tnemec Co Inc

Qualitative and quantitative analysis of companies has been conducted to help clients understand the wider business environment as well as the strengths and weaknesses of key industry players. Data is qualitatively analyzed to categorize companies as pure play, category-focused, industry-focused, and diversified; it is quantitatively analyzed to categorize companies as dominant, leading, strong, tentative, and weak.

Recent Development and News in Anti-slip coatings market

  • In the Specialty Chemicals industry, the widespread transition toward volatile organic compound compliant formulations has accelerated the development of waterborne polyurethane dispersion technologies, directly impacting Anti-slip Coatings demand by improving indoor air quality adherence.
  • The enforcement of strict environmental compliance mandate parameters across heavy industrial facility operations has shifted procurement toward zero volatile organic compound materials, increasing the adoption of bio-based resin technology for pedestrian safety surfacing.
  • Advancements in rapid curing polymer system engineering have reduced curing cycles by 30%, which allows Anti-slip Coatings applications to minimize facility downtime during critical commercial real estate refurbishment projects.
  • The integration of advanced aluminum oxide traction additive materials in maritime infrastructure maintenance has enhanced substrate adhesion profile performance, driving Anti-slip Coatings demand for protecting marine deck protective layer surfaces against extreme weather durability.

Dive into Technavio’s robust research methodology, blending expert interviews, extensive data synthesis, and validated models for unparalleled Anti-Slip Coatings Market insights. See full methodology.

Market Scope
Page number 308
Base year 2025
Historic period 2020-2024
Forecast period 2026-2030
Growth momentum & CAGR Accelerate at a CAGR of 3.2%
Market growth 2026-2030 USD 23562.2 thousand
Market structure Fragmented
YoY growth 2025-2026(%) 3.1%
Key countries China, Japan, India, South Korea, Australia, Indonesia, Germany, UK, France, Italy, Spain, The Netherlands, US, Canada, Mexico, Brazil, Argentina, Chile, Saudi Arabia, UAE, South Africa, Israel and Turkey
Competitive landscape Leading Companies, Market Positioning of Companies, Competitive Strategies, and Industry Risks

Request Free Sample

Research Analyst Overview

  • The Anti-slip Coatings landscape is undergoing a structural transformation as corporate leadership increasingly aligns facility management with stringent occupational safety strategies. Boardrooms are aggressively integrating nanoparticle traction solution technologies to permanently resolve liability risks associated with floor surface abrasion and moisture accumulation.
  • Implementing an advanced aliphatic polyurethane clearcoat enables enterprises to achieve a 35% improvement in long-term wear resistance compared to conventional acrylic seals. This strategic shift directly optimizes compliance budgeting by extending the lifecycle of marine deck protective layer applications and heavy-duty floor overlay installations.
  • Organizations prioritizing sustainable operations are accelerating their adoption of bio-based resin technology, ensuring strict alignment with evolving environmental standards without sacrificing mechanical performance. The utilization of a wet-and-rust-tolerant epoxy allows infrastructure managers to execute seamless repairs in damp environments, safeguarding operational continuity.
  • Furthermore, deploying a uv-resistant clear sealer guarantees that outdoor pedestrian safety surfacing maintains both aesthetic clarity and vital traction properties under prolonged solar exposure.

What are the Key Data Covered in this Anti-Slip Coatings Market Research and Growth Report?

  • What is the expected growth of the Anti-Slip Coatings Market between 2026 and 2030?

    • USD 23.56 million, at a CAGR of 3.2%

  • What segmentation does the market report cover?

    • The report is segmented by Type (Water-based, and Solvent-based), Product Type (Epoxy, Polyurethane, Acrylic, and Others), Application (Industrial, Commercial, Residential, and Others) and Geography (APAC, Europe, North America, South America, Middle East and Africa)

  • Which regions are analyzed in the report?

    • APAC, Europe, North America, South America and Middle East and Africa

  • What are the key growth drivers and market challenges?

    • Increasing workplace safety compliance requirements, Raw material price volatility

  • Who are the major players in the Anti-Slip Coatings Market?

    • 3M Co., Akzo Nobel NV, Amstep Products, BASF SE, Belzona International Ltd., Carboline Co, Chemco International Ltd., CoverTec Products LLC, Hempel AS, ITW Performance Polymers, Jotun AS, Kansai Paint Co. Ltd., LATICRETE International Inc., Mapei S.p.A., Nippon Paint Holdings Co Ltd., PPG Industries Inc., Rust Oleum Corp., Sika AG, The Sherwin Williams Co. and Tnemec Co Inc

Market Research Insights

  • The Anti-slip Coatings sector is evolving rapidly as infrastructure managers prioritize occupational hazard mitigation and transit hub floor protection. Organizations upgrading heavy industrial facility flooring report a 30% decrease in maintenance interventions when utilizing advanced high-friction surface treatment technologies.
  • Furthermore, transitioning to zero volatile organic compound formulations has improved indoor air quality compliance rates by 22% during commercial real estate refurbishment. This strategic adoption of durable floor surface abrasion solutions allows businesses to streamline preventative surface maintenance while safeguarding high-traffic pedestrian zone areas.
  • The continuous deployment of these specialized materials directly enhances operational continuity and reduces long-term liability exposure across demanding industrial environments.

We can help! Our analysts can customize this anti-slip coatings market research report to meet your requirements.

Get in touch

1. Executive Summary

1.1 Market overview

Executive Summary - Chart on Market Overview
Executive Summary - Data Table on Market Overview
Executive Summary - Chart on Global Market Characteristics
Executive Summary - Chart on Market by Geography
Executive Summary - Chart on Market Segmentation by Type
Executive Summary - Chart on Market Segmentation by Product Type
Executive Summary - Chart on Market Segmentation by Application
Executive Summary - Chart on Incremental Growth
Executive Summary - Data Table on Incremental Growth
Executive Summary - Chart on Company Market Positioning

2. Technavio Analysis

2.1 Analysis of price sensitivity, lifecycle, customer purchase basket, adoption rates, and purchase criteria

2.2 Criticality of inputs and Factors of differentiation

Chart on Overview on criticality of inputs and factors of differentiation

2.3 Factors of disruption

Chart on Overview on factors of disruption

2.4 Impact of drivers and challenges

Chart on Impact of drivers and challenges in 2025 and 2030

3. Market Landscape

3.1 Market ecosystem

Chart on Parent Market
Data Table on - Parent Market

3.2 Market characteristics

Chart on Market characteristics analysis

3.3 Value chain analysis

Chart on Value chain analysis

4. Market Sizing

4.1 Market definition

Data Table on Offerings of companies included in the market definition

4.2 Market segment analysis

Market segments

4.3 Market size 2025

4.4 Market outlook: Forecast for 2025-2030

Chart on Global - Market size and forecast 2025-2030 ($ thousand)
Data Table on Global - Market size and forecast 2025-2030 ($ thousand)
Chart on Global Market: Year-over-year growth 2025-2030 (%)
Data Table on Global Market: Year-over-year growth 2025-2030 (%)

5. Historic Market Size

5.1 Global Anti-Slip Coatings Market 2020 - 2024

Historic Market Size - Data Table on Global Anti-Slip Coatings Market 2020 - 2024 ($ thousand)

5.2 Type segment analysis 2020 - 2024

Historic Market Size - Type Segment 2020 - 2024 ($ thousand)

5.3 Product Type segment analysis 2020 - 2024

Historic Market Size - Product Type Segment 2020 - 2024 ($ thousand)

5.4 Application segment analysis 2020 - 2024

Historic Market Size - Application Segment 2020 - 2024 ($ thousand)

5.5 Geography segment analysis 2020 - 2024

Historic Market Size - Geography Segment 2020 - 2024 ($ thousand)

5.6 Country segment analysis 2020 - 2024

Historic Market Size - Country Segment 2020 - 2024 ($ thousand)

6. Qualitative Analysis

6.1 Impact of AI on Global Anti-slip Coatings Market

6.2 Impact of Geopolitical Conflicts for Global Anti-slip Coatings Market

7. Five Forces Analysis

7.1 Five forces summary

Five forces analysis - Comparison between 2025 and 2030

7.2 Bargaining power of buyers

Bargaining power of buyers - Impact of key factors 2025 and 2030

7.3 Bargaining power of suppliers

Bargaining power of suppliers - Impact of key factors in 2025 and 2030

7.4 Threat of new entrants

Threat of new entrants - Impact of key factors in 2025 and 2030

7.5 Threat of substitutes

Threat of substitutes - Impact of key factors in 2025 and 2030

7.6 Threat of rivalry

Threat of rivalry - Impact of key factors in 2025 and 2030

7.7 Market condition

Chart on Market condition - Five forces 2025 and 2030

8. Market Segmentation by Type

8.1 Market segments

Chart on Type - Market share 2025-2030 (%)
Data Table on Type - Market share 2025-2030 (%)

8.2 Comparison by Type

Chart on Comparison by Type
Data Table on Comparison by Type

8.3 Water-based - Market size and forecast 2025-2030

Chart on Water-based - Market size and forecast 2025-2030 ($ thousand)
Data Table on Water-based - Market size and forecast 2025-2030 ($ thousand)
Chart on Water-based - Year-over-year growth 2025-2030 (%)
Data Table on Water-based - Year-over-year growth 2025-2030 (%)

8.4 Solvent-based - Market size and forecast 2025-2030

Chart on Solvent-based - Market size and forecast 2025-2030 ($ thousand)
Data Table on Solvent-based - Market size and forecast 2025-2030 ($ thousand)
Chart on Solvent-based - Year-over-year growth 2025-2030 (%)
Data Table on Solvent-based - Year-over-year growth 2025-2030 (%)

8.5 Market opportunity by Type

Market opportunity by Type ($ thousand)
Data Table on Market opportunity by Type ($ thousand)

9. Market Segmentation by Product Type

9.1 Market segments

Chart on Product Type - Market share 2025-2030 (%)
Data Table on Product Type - Market share 2025-2030 (%)

9.2 Comparison by Product Type

Chart on Comparison by Product Type
Data Table on Comparison by Product Type

9.3 Epoxy - Market size and forecast 2025-2030

Chart on Epoxy - Market size and forecast 2025-2030 ($ thousand)
Data Table on Epoxy - Market size and forecast 2025-2030 ($ thousand)
Chart on Epoxy - Year-over-year growth 2025-2030 (%)
Data Table on Epoxy - Year-over-year growth 2025-2030 (%)

9.4 Polyurethane - Market size and forecast 2025-2030

Chart on Polyurethane - Market size and forecast 2025-2030 ($ thousand)
Data Table on Polyurethane - Market size and forecast 2025-2030 ($ thousand)
Chart on Polyurethane - Year-over-year growth 2025-2030 (%)
Data Table on Polyurethane - Year-over-year growth 2025-2030 (%)

9.5 Acrylic - Market size and forecast 2025-2030

Chart on Acrylic - Market size and forecast 2025-2030 ($ thousand)
Data Table on Acrylic - Market size and forecast 2025-2030 ($ thousand)
Chart on Acrylic - Year-over-year growth 2025-2030 (%)
Data Table on Acrylic - Year-over-year growth 2025-2030 (%)

9.6 Others - Market size and forecast 2025-2030

Chart on Others - Market size and forecast 2025-2030 ($ thousand)
Data Table on Others - Market size and forecast 2025-2030 ($ thousand)
Chart on Others - Year-over-year growth 2025-2030 (%)
Data Table on Others - Year-over-year growth 2025-2030 (%)

9.7 Market opportunity by Product Type

Market opportunity by Product Type ($ thousand)
Data Table on Market opportunity by Product Type ($ thousand)

10. Market Segmentation by Application

10.1 Market segments

Chart on Application - Market share 2025-2030 (%)
Data Table on Application - Market share 2025-2030 (%)

10.2 Comparison by Application

Chart on Comparison by Application
Data Table on Comparison by Application

10.3 Industrial - Market size and forecast 2025-2030

Chart on Industrial - Market size and forecast 2025-2030 ($ thousand)
Data Table on Industrial - Market size and forecast 2025-2030 ($ thousand)
Chart on Industrial - Year-over-year growth 2025-2030 (%)
Data Table on Industrial - Year-over-year growth 2025-2030 (%)

10.4 Commercial - Market size and forecast 2025-2030

Chart on Commercial - Market size and forecast 2025-2030 ($ thousand)
Data Table on Commercial - Market size and forecast 2025-2030 ($ thousand)
Chart on Commercial - Year-over-year growth 2025-2030 (%)
Data Table on Commercial - Year-over-year growth 2025-2030 (%)

10.5 Residential - Market size and forecast 2025-2030

Chart on Residential - Market size and forecast 2025-2030 ($ thousand)
Data Table on Residential - Market size and forecast 2025-2030 ($ thousand)
Chart on Residential - Year-over-year growth 2025-2030 (%)
Data Table on Residential - Year-over-year growth 2025-2030 (%)

10.6 Others - Market size and forecast 2025-2030

Chart on Others - Market size and forecast 2025-2030 ($ thousand)
Data Table on Others - Market size and forecast 2025-2030 ($ thousand)
Chart on Others - Year-over-year growth 2025-2030 (%)
Data Table on Others - Year-over-year growth 2025-2030 (%)

10.7 Market opportunity by Application

Market opportunity by Application ($ thousand)
Data Table on Market opportunity by Application ($ thousand)

11. Customer Landscape

11.1 Customer landscape overview

Analysis of price sensitivity, lifecycle, customer purchase basket, adoption rates, and purchase criteria

12. Geographic Landscape

12.1 Geographic segmentation

Chart on Market share by geography 2025-2030 (%)
Data Table on Market share by geography 2025-2030 (%)

12.2 Geographic comparison

Chart on Geographic comparison
Data Table on Geographic comparison

12.3 APAC - Market size and forecast 2025-2030

Chart on APAC - Market size and forecast 2025-2030 ($ thousand)
Data Table on APAC - Market size and forecast 2025-2030 ($ thousand)
Chart on APAC - Year-over-year growth 2025-2030 (%)
Data Table on APAC - Year-over-year growth 2025-2030 (%)
Chart on Regional Comparison - APAC
Data Table on Regional Comparison - APAC

12.3.1 China - Market size and forecast 2025-2030

Chart on China - Market size and forecast 2025-2030 ($ thousand)
Data Table on China - Market size and forecast 2025-2030 ($ thousand)
Chart on China - Year-over-year growth 2025-2030 (%)
Data Table on China - Year-over-year growth 2025-2030 (%)

12.3.2 Japan - Market size and forecast 2025-2030

Chart on Japan - Market size and forecast 2025-2030 ($ thousand)
Data Table on Japan - Market size and forecast 2025-2030 ($ thousand)
Chart on Japan - Year-over-year growth 2025-2030 (%)
Data Table on Japan - Year-over-year growth 2025-2030 (%)

12.3.3 India - Market size and forecast 2025-2030

Chart on India - Market size and forecast 2025-2030 ($ thousand)
Data Table on India - Market size and forecast 2025-2030 ($ thousand)
Chart on India - Year-over-year growth 2025-2030 (%)
Data Table on India - Year-over-year growth 2025-2030 (%)

12.3.4 South Korea - Market size and forecast 2025-2030

Chart on South Korea - Market size and forecast 2025-2030 ($ thousand)
Data Table on South Korea - Market size and forecast 2025-2030 ($ thousand)
Chart on South Korea - Year-over-year growth 2025-2030 (%)
Data Table on South Korea - Year-over-year growth 2025-2030 (%)

12.3.5 Australia - Market size and forecast 2025-2030

Chart on Australia - Market size and forecast 2025-2030 ($ thousand)
Data Table on Australia - Market size and forecast 2025-2030 ($ thousand)
Chart on Australia - Year-over-year growth 2025-2030 (%)
Data Table on Australia - Year-over-year growth 2025-2030 (%)

12.3.6 Indonesia - Market size and forecast 2025-2030

Chart on Indonesia - Market size and forecast 2025-2030 ($ thousand)
Data Table on Indonesia - Market size and forecast 2025-2030 ($ thousand)
Chart on Indonesia - Year-over-year growth 2025-2030 (%)
Data Table on Indonesia - Year-over-year growth 2025-2030 (%)

12.4 Europe - Market size and forecast 2025-2030

Chart on Europe - Market size and forecast 2025-2030 ($ thousand)
Data Table on Europe - Market size and forecast 2025-2030 ($ thousand)
Chart on Europe - Year-over-year growth 2025-2030 (%)
Data Table on Europe - Year-over-year growth 2025-2030 (%)
Chart on Regional Comparison - Europe
Data Table on Regional Comparison - Europe

12.4.1 Germany - Market size and forecast 2025-2030

Chart on Germany - Market size and forecast 2025-2030 ($ thousand)
Data Table on Germany - Market size and forecast 2025-2030 ($ thousand)
Chart on Germany - Year-over-year growth 2025-2030 (%)
Data Table on Germany - Year-over-year growth 2025-2030 (%)

12.4.2 UK - Market size and forecast 2025-2030

Chart on UK - Market size and forecast 2025-2030 ($ thousand)
Data Table on UK - Market size and forecast 2025-2030 ($ thousand)
Chart on UK - Year-over-year growth 2025-2030 (%)
Data Table on UK - Year-over-year growth 2025-2030 (%)

12.4.3 France - Market size and forecast 2025-2030

Chart on France - Market size and forecast 2025-2030 ($ thousand)
Data Table on France - Market size and forecast 2025-2030 ($ thousand)
Chart on France - Year-over-year growth 2025-2030 (%)
Data Table on France - Year-over-year growth 2025-2030 (%)

12.4.4 Italy - Market size and forecast 2025-2030

Chart on Italy - Market size and forecast 2025-2030 ($ thousand)
Data Table on Italy - Market size and forecast 2025-2030 ($ thousand)
Chart on Italy - Year-over-year growth 2025-2030 (%)
Data Table on Italy - Year-over-year growth 2025-2030 (%)

12.4.5 Spain - Market size and forecast 2025-2030

Chart on Spain - Market size and forecast 2025-2030 ($ thousand)
Data Table on Spain - Market size and forecast 2025-2030 ($ thousand)
Chart on Spain - Year-over-year growth 2025-2030 (%)
Data Table on Spain - Year-over-year growth 2025-2030 (%)

12.4.6 The Netherlands - Market size and forecast 2025-2030

Chart on The Netherlands - Market size and forecast 2025-2030 ($ thousand)
Data Table on The Netherlands - Market size and forecast 2025-2030 ($ thousand)
Chart on The Netherlands - Year-over-year growth 2025-2030 (%)
Data Table on The Netherlands - Year-over-year growth 2025-2030 (%)

12.5 North America - Market size and forecast 2025-2030

Chart on North America - Market size and forecast 2025-2030 ($ thousand)
Data Table on North America - Market size and forecast 2025-2030 ($ thousand)
Chart on North America - Year-over-year growth 2025-2030 (%)
Data Table on North America - Year-over-year growth 2025-2030 (%)
Chart on Regional Comparison - North America
Data Table on Regional Comparison - North America

12.5.1 US - Market size and forecast 2025-2030

Chart on US - Market size and forecast 2025-2030 ($ thousand)
Data Table on US - Market size and forecast 2025-2030 ($ thousand)
Chart on US - Year-over-year growth 2025-2030 (%)
Data Table on US - Year-over-year growth 2025-2030 (%)

12.5.2 Canada - Market size and forecast 2025-2030

Chart on Canada - Market size and forecast 2025-2030 ($ thousand)
Data Table on Canada - Market size and forecast 2025-2030 ($ thousand)
Chart on Canada - Year-over-year growth 2025-2030 (%)
Data Table on Canada - Year-over-year growth 2025-2030 (%)

12.5.3 Mexico - Market size and forecast 2025-2030

Chart on Mexico - Market size and forecast 2025-2030 ($ thousand)
Data Table on Mexico - Market size and forecast 2025-2030 ($ thousand)
Chart on Mexico - Year-over-year growth 2025-2030 (%)
Data Table on Mexico - Year-over-year growth 2025-2030 (%)

12.6 South America - Market size and forecast 2025-2030

Chart on South America - Market size and forecast 2025-2030 ($ thousand)
Data Table on South America - Market size and forecast 2025-2030 ($ thousand)
Chart on South America - Year-over-year growth 2025-2030 (%)
Data Table on South America - Year-over-year growth 2025-2030 (%)
Chart on Regional Comparison - South America
Data Table on Regional Comparison - South America

12.6.1 Brazil - Market size and forecast 2025-2030

Chart on Brazil - Market size and forecast 2025-2030 ($ thousand)
Data Table on Brazil - Market size and forecast 2025-2030 ($ thousand)
Chart on Brazil - Year-over-year growth 2025-2030 (%)
Data Table on Brazil - Year-over-year growth 2025-2030 (%)

12.6.2 Argentina - Market size and forecast 2025-2030

Chart on Argentina - Market size and forecast 2025-2030 ($ thousand)
Data Table on Argentina - Market size and forecast 2025-2030 ($ thousand)
Chart on Argentina - Year-over-year growth 2025-2030 (%)
Data Table on Argentina - Year-over-year growth 2025-2030 (%)

12.6.3 Chile - Market size and forecast 2025-2030

Chart on Chile - Market size and forecast 2025-2030 ($ thousand)
Data Table on Chile - Market size and forecast 2025-2030 ($ thousand)
Chart on Chile - Year-over-year growth 2025-2030 (%)
Data Table on Chile - Year-over-year growth 2025-2030 (%)

12.7 Middle East and Africa - Market size and forecast 2025-2030

Chart on Middle East and Africa - Market size and forecast 2025-2030 ($ thousand)
Data Table on Middle East and Africa - Market size and forecast 2025-2030 ($ thousand)
Chart on Middle East and Africa - Year-over-year growth 2025-2030 (%)
Data Table on Middle East and Africa - Year-over-year growth 2025-2030 (%)
Chart on Regional Comparison - Middle East and Africa
Data Table on Regional Comparison - Middle East and Africa

12.7.1 Saudi Arabia - Market size and forecast 2025-2030

Chart on Saudi Arabia - Market size and forecast 2025-2030 ($ thousand)
Data Table on Saudi Arabia - Market size and forecast 2025-2030 ($ thousand)
Chart on Saudi Arabia - Year-over-year growth 2025-2030 (%)
Data Table on Saudi Arabia - Year-over-year growth 2025-2030 (%)

12.7.2 UAE - Market size and forecast 2025-2030

Chart on UAE - Market size and forecast 2025-2030 ($ thousand)
Data Table on UAE - Market size and forecast 2025-2030 ($ thousand)
Chart on UAE - Year-over-year growth 2025-2030 (%)
Data Table on UAE - Year-over-year growth 2025-2030 (%)

12.7.3 South Africa - Market size and forecast 2025-2030

Chart on South Africa - Market size and forecast 2025-2030 ($ thousand)
Data Table on South Africa - Market size and forecast 2025-2030 ($ thousand)
Chart on South Africa - Year-over-year growth 2025-2030 (%)
Data Table on South Africa - Year-over-year growth 2025-2030 (%)

12.7.4 Israel - Market size and forecast 2025-2030

Chart on Israel - Market size and forecast 2025-2030 ($ thousand)
Data Table on Israel - Market size and forecast 2025-2030 ($ thousand)
Chart on Israel - Year-over-year growth 2025-2030 (%)
Data Table on Israel - Year-over-year growth 2025-2030 (%)

12.7.5 Turkey - Market size and forecast 2025-2030

Chart on Turkey - Market size and forecast 2025-2030 ($ thousand)
Data Table on Turkey - Market size and forecast 2025-2030 ($ thousand)
Chart on Turkey - Year-over-year growth 2025-2030 (%)
Data Table on Turkey - Year-over-year growth 2025-2030 (%)

12.8 Market opportunity by geography

Market opportunity by geography ($ thousand)
Data Tables on Market opportunity by geography ($ thousand)

13. Drivers, Challenges, and Opportunity

13.1 Market drivers

Increasing workplace safety compliance requirements
Growth of construction and infrastructure development
Rising demand from marine and industrial operations

13.2 Market challenges

Raw material price volatility
Performance variability across application environments
Regulatory compliance complexity and certification burden

13.3 Impact of drivers and challenges

Impact of drivers and challenges in 2025 and 2030

13.4 Market opportunities

Shift toward application specific formulations
Growing preference for environmentally responsible coatings
Integration of decorative and safety performance features

14. Competitive Landscape

14.1 Overview

14.2

Overview on criticality of inputs and factors of differentiation

14.3 Landscape disruption

Overview on factors of disruption

14.4 Industry risks

Impact of key risks on business

15. Competitive Analysis

15.1 Companies profiled

Companies covered

15.2 Company ranking index

15.3 Market positioning of companies

Matrix on companies position and classification

15.4 3M Co.

3M Co. - Overview
3M Co. - Business segments
3M Co. - Key news
3M Co. - Key offerings
3M Co. - Segment focus
SWOT

15.5 Akzo Nobel NV

Akzo Nobel NV - Overview
Akzo Nobel NV - Business segments
Akzo Nobel NV - Key offerings
Akzo Nobel NV - Segment focus
SWOT

15.6 BASF SE

BASF SE - Overview
BASF SE - Business segments
BASF SE - Key news
BASF SE - Key offerings
BASF SE - Segment focus
SWOT

15.7 Carboline Co

Carboline Co - Overview
Carboline Co - Product / Service
Carboline Co - Key offerings
SWOT

15.8 Hempel AS

Hempel AS - Overview
Hempel AS - Product / Service
Hempel AS - Key offerings
SWOT

15.9 ITW Performance Polymers

ITW Performance Polymers - Overview
ITW Performance Polymers - Product / Service
ITW Performance Polymers - Key offerings
SWOT

15.10 Jotun AS

Jotun AS - Overview
Jotun AS - Product / Service
Jotun AS - Key offerings
SWOT

15.11 Kansai Paint Co. Ltd.

Kansai Paint Co. Ltd. - Overview
Kansai Paint Co. Ltd. - Business segments
Kansai Paint Co. Ltd. - Key offerings
Kansai Paint Co. Ltd. - Segment focus
SWOT

15.12 LATICRETE International Inc.

LATICRETE International Inc. - Overview
LATICRETE International Inc. - Product / Service
LATICRETE International Inc. - Key offerings
SWOT

15.13 Mapei S.p.A.

Mapei S.p.A. - Overview
Mapei S.p.A. - Product / Service
Mapei S.p.A. - Key offerings
SWOT

15.14 Nippon Paint Holdings Co Ltd.

Nippon Paint Holdings Co Ltd. - Overview
Nippon Paint Holdings Co Ltd. - Business segments
Nippon Paint Holdings Co Ltd. - Key offerings
Nippon Paint Holdings Co Ltd. - Segment focus
SWOT

15.15 PPG Industries Inc.

PPG Industries Inc. - Overview
PPG Industries Inc. - Business segments
PPG Industries Inc. - Key offerings
PPG Industries Inc. - Segment focus
SWOT

15.16 Rust Oleum Corp.

Rust Oleum Corp. - Overview
Rust Oleum Corp. - Product / Service
Rust Oleum Corp. - Key offerings
SWOT

15.17 Sika AG

Sika AG - Overview
Sika AG - Business segments
Sika AG - Key news
Sika AG - Key offerings
Sika AG - Segment focus
SWOT

15.18 The Sherwin Williams Co.

The Sherwin Williams Co. - Overview
The Sherwin Williams Co. - Business segments
The Sherwin Williams Co. - Key offerings
The Sherwin Williams Co. - Segment focus
SWOT

16. Appendix

16.1 Scope of the report

Market definition
Objectives
Notes and caveats

16.2 Inclusions and exclusions checklist

Inclusions checklist
Exclusions checklist

16.3 Currency conversion rates for US$

16.4 Research methodology

16.5 Data procurement

Information sources

16.6 Data validation

16.7 Validation techniques employed for market sizing

16.8 Data synthesis

16.9 360 degree market analysis

16.10 List of abbreviations

Research Methodology

Technavio presents a detailed picture of the market by way of study, synthesis, and summation of data from multiple sources. The analysts have presented the various facets of the market with a particular focus on identifying the key industry influencers. The data thus presented is comprehensive, reliable, and the result of extensive research, both primary and secondary.

INFORMATION SOURCES

Primary sources

  • Manufacturers and suppliers
  • Channel partners
  • Industry experts
  • Strategic decision makers

Secondary sources

  • Industry journals and periodicals
  • Government data
  • Financial reports of key industry players
  • Historical data
  • Press releases

DATA ANALYSIS

Data Synthesis

  • Collation of data
  • Estimation of key figures
  • Analysis of derived insights

Data Validation

  • Triangulation with data models
  • Reference against proprietary databases
  • Corroboration with industry experts

REPORT WRITING

Qualitative

  • Market drivers
  • Market challenges
  • Market trends
  • Five forces analysis

Quantitative

  • Market size and forecast
  • Market segmentation
  • Geographical insights
  • Competitive landscape

Interested in this report?

Get your sample now to see our research methodology and insights!

Download Now

Frequently Asked Questions

Anti-Slip Coatings market growth will increase by USD 23562.2 thousand thousand during 2026-2030.

The Anti-Slip Coatings market is expected to grow at a CAGR of 3.2% during 2026-2030.

Anti-Slip Coatings market is segmented by Type (Water-based, Solvent-based) Product type (Epoxy, Polyurethane, Acrylic, Others) Application (Industrial, Commercial, Residential, Others)

3M Co., Akzo Nobel NV, Amstep Products, BASF SE, Belzona International Ltd., Carboline Co, Chemco International Ltd., CoverTec Products LLC, Hempel AS, ITW Performance Polymers, Jotun AS, Kansai Paint Co. Ltd., LATICRETE International Inc., Mapei S.p.A., Nippon Paint Holdings Co Ltd., PPG Industries Inc., Rust Oleum Corp., Sika AG, The Sherwin Williams Co., Tnemec Co Inc are a few of the key vendors in the Anti-Slip Coatings market.

APAC will register the highest growth rate of 42.9% among the other regions. Therefore, the Anti-Slip Coatings market in APAC is expected to garner significant business opportunities for the vendors during the forecast period.

China, Japan, India, South Korea, Australia, Indonesia, Germany, UK, France, Italy, Spain, The Netherlands, US, Canada, Mexico, Brazil, Argentina, Chile, Saudi Arabia, UAE, South Africa, Israel, Turkey

  • Increasing workplace safety compliance requirements is the driving factor this market.

The Anti-Slip Coatings market vendors should focus on grabbing business opportunities from the Type segment as it accounted for the largest market share in the base year.
RIA - Research AI Assistant
Ask RIA
