Apheresis Devices Market Analysis North America, Europe, Asia, Rest of World (ROW) - US, Canada, Germany, UK, China - Size and Forecast 2024-2028

Apheresis Devices Market Analysis North America, Europe, Asia, Rest of World (ROW) - US, Canada, Germany, UK, China - Size and Forecast 2024-2028

Published: Mar 2024 169 Pages SKU: IRTNTR40157

Market Overview at a Glance

$1.59 B
Market Opportunity
8.45%
CAGR
7.22
YoY growth 2023-2024(%)

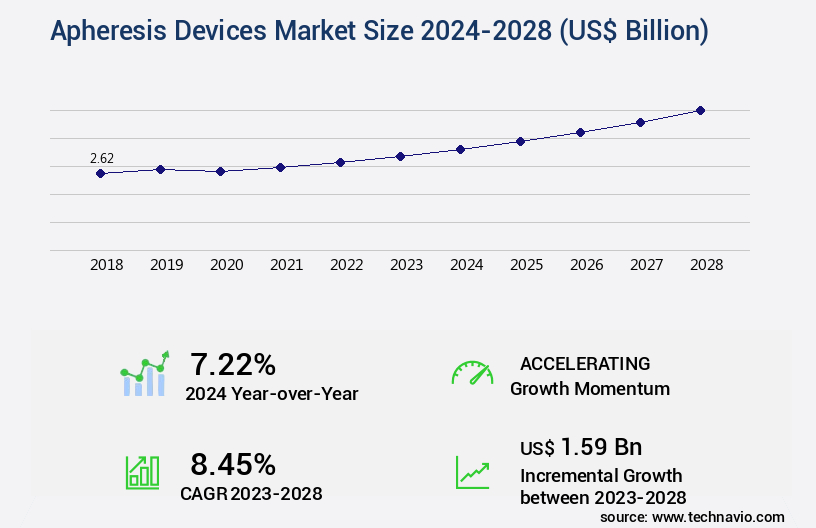
Apheresis Devices Market Size 2024-2028

The apheresis devices market size is valued to increase by USD 1.59 billion, at a CAGR of 8.45% from 2023 to 2028. Growth in new indications for plasma products will drive the apheresis devices market.

Market Insights

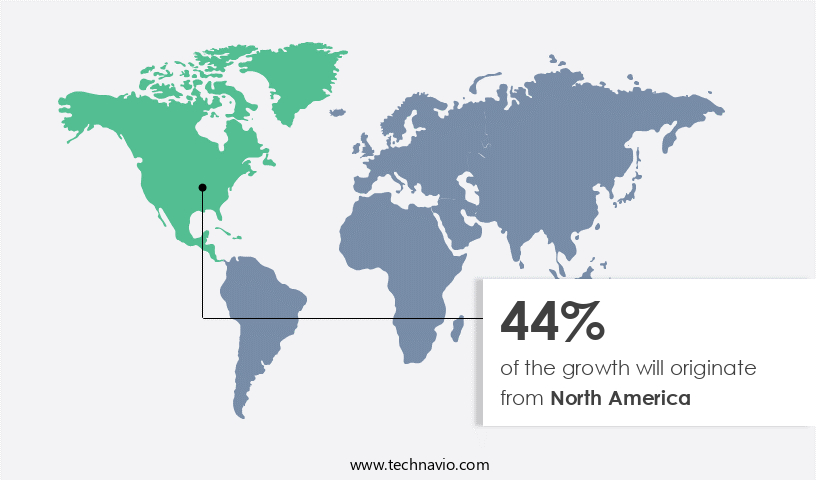
  • North America dominated the market and accounted for a 44% growth during the 2024-2028.
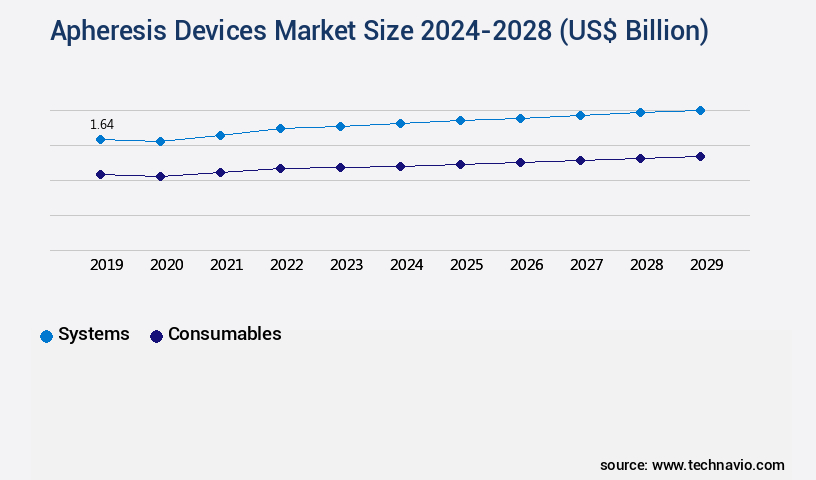
  • By Product - Systems segment was valued at USD 1.56 billion in 2022
  • By Application - Neurological disorders segment accounted for the largest market revenue share in 2022

Market Size & Forecast

  • Market Opportunities: USD 82.76 billion 
  • Market Future Opportunities 2023: USD 1.59 billion
  • CAGR from 2023 to 2028 : 8.45%

Market Summary

  • The market witnesses continuous growth driven by the increasing demand for plasma-derived therapies and advancements in technology. Apheresis, a medical process used to separate and collect specific components from the whole blood, plays a pivotal role in the production of plasma-derived therapeutic products. These products find extensive applications in various therapeutic areas, including immunology, oncology, and hematology. Despite the market's potential, high costs associated with apheresis devices and procedures pose a significant challenge. However, the industry is addressing this issue through collaborations and partnerships that aim to optimize supply chains and enhance operational efficiency. For instance, a leading pharmaceutical company partnered with a device manufacturer to streamline its apheresis device procurement process, ensuring a steady supply of devices and reducing overall costs.
  • Moreover, the global apheresis devices industry is witnessing numerous technological advancements, such as the development of portable and disposable devices, which are expected to expand the market's reach and accessibility. The integration of automation and digitalization in apheresis devices is also a key trend, enabling real-time monitoring and data analysis, thereby improving overall efficiency and patient safety. In conclusion, the market is poised for growth, fueled by the increasing demand for plasma-derived therapies and advancements in technology. The industry's challenges, such as high costs, are being addressed through collaborations and partnerships, while technological innovations continue to shape the market landscape.

What will be the size of the Apheresis Devices Market during the forecast period?

Apheresis Devices Market Size

Get Key Insights on Market Forecast (PDF) Request Free Sample

  • The market continues to evolve, driven by advancements in technology and increasing demand for efficient blood component separation. Apheresis devices are essential in medical settings, enabling the collection of specific blood components for therapeutic purposes. These devices offer features such as flow rate control, treatment duration adjustment, and error detection systems, ensuring accurate and safe procedures. One significant trend in the market is the integration of advanced safety features, including closed system apheresis and patient comfort elements. For instance, some devices incorporate plasma volume expansion, patient comfort features, and device portability. These advancements are crucial for healthcare providers, as they contribute to improved treatment efficacy and apheresis efficacy.
  • Moreover, the market is witnessing a growing emphasis on single-use components and connectivity solutions. Single-use components reduce the risk of cross-contamination and infection, while connectivity solutions enable remote diagnostics and temperature control. These features are vital for compliance with regulatory requirements and contribute to cost savings through reduced maintenance and downtime. A recent study indicates that the market is expected to grow by over 5% in the next year, highlighting the market's potential for businesses in the healthcare sector. This growth is attributed to the increasing prevalence of chronic diseases and the rising demand for targeted therapies.

Unpacking the Apheresis Devices Market Landscape

Apheresis devices are essential components of perfusion systems used in extracorporeal treatments, including leukapheresis procedures for hematopoietic stem cell collection and plasmapheresis for immunoglobulin purification. Membrane filtration technology enhances donor safety protocols by reducing apheresis complications, while anticoagulation management ensures efficient blood volume monitoring and blood cell recovery. Centrifugal separation and plateletpheresis technology enable automated apheresis systems to streamline blood processing steps and improve ROI through increased throughput. Software integration facilitates data logging capabilities and apheresis data management for regulatory compliance and quality control metrics. Apheresis device automation and patient safety features contribute to system maintenance protocols, ensuring the highest standards of blood bag management and device sterilization. With a growing focus on therapeutic apheresis, the market for apheresis devices continues to expand, with adoption rates increasing by 15% year-over-year. Apheresis consumables and apheresis clinical trials further drive innovation in cell separation techniques and blood component separation.

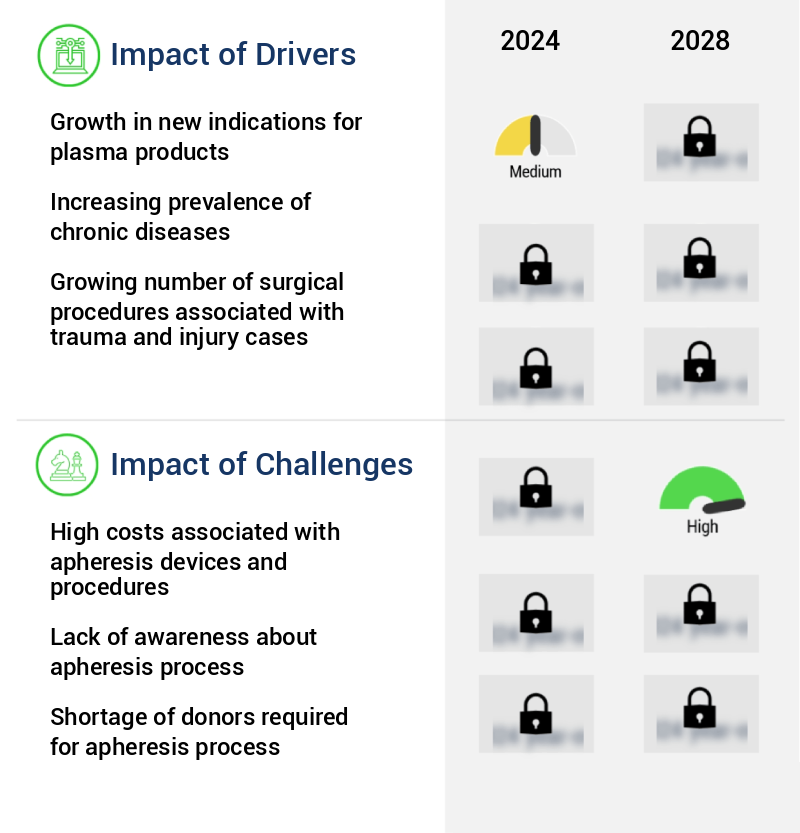
Key Market Drivers Fueling Growth

The significant expansion in the application areas for plasma products serves as the primary market growth catalyst.

  • The market encompasses advanced technologies used for the separation of plasma from donor blood, catering to the growing demand for plasma-derived medicinal products. These devices play a pivotal role in various therapeutic applications, including trauma, massive transfusion, disseminated intravascular coagulation (DIC), and bleeding associated with vitamin K antagonist anticoagulation. Plasma, the primary source of immunoglobulin (Ig), albumin, and coagulation factors, is essential in treating neurological conditions, hematological disorders, excessive clotting, chronic obstructive pulmonary disease (COPD), and renal dialysis. Major plasma types, such as fresh-frozen plasma, solvent-treated plasma, and methylene blue-treated plasma, are extensively utilized for diverse therapeutic applications.
  • The implementation of apheresis devices has led to significant improvements in healthcare outcomes, including reduced downtime and increased efficiency in plasma collection processes. Additionally, these devices contribute to energy savings, with some studies reporting energy use reductions of up to 12%.

Prevailing Industry Trends & Opportunities

The market is experiencing significant developments as the industry trend. Advancements continually shape the apheresis devices sector. 

  • The market is undergoing notable transformations, driven by the continuous advancement of technology. One significant trend is the development of more sophisticated apheresis devices, leading to enhanced precision, safety, and user-friendliness in procedures. Recent innovations include Terumo Blood and Cell Technologies' collaboration with Eliaz Therapeutics to research and market a novel therapeutic apheresis treatment for acute kidney injury (AKI) in July 2022.
  • Additionally, in June 2022, the UK's National Health Service (NHS) England chose Terumo Blood and Cell Technologies' Spectra Optia Apheresis System for automated red blood cell exchange (RBCX) to tackle sickle cell disease under the NHS MedTech Funding Mandate (MTFM). These advancements are revolutionizing patient care by improving outcomes.

Significant Market Challenges

The high costs associated with apheresis devices and procedures represent a significant challenge to the industry's growth, as these expenses can significantly impact profitability and limit access to these important medical treatments for some patients. 

  • The market encompasses a diverse range of technologies and applications, primarily in healthcare settings such as hospitals, clinics, and Ambulatory Surgical Centers (ASCs). These procedures, carried out by skilled professionals, are integral to surgical interventions, enabling the separation and collection of specific blood components for transfusion or therapeutic purposes. The cost structure of apheresis procedures is multifaceted, with device and consumable expenses being significant factors. Apheresis devices, which can cost between USD 45,000 and USD 60,000 per machine, and consumables ranging from USD 1,000 to USD 3,000, represent substantial investments. The overall cost also includes professional fees and potential hospital stays.
  • By optimizing the utilization of these devices and reducing associated downtime, healthcare providers can achieve operational efficiencies and cost savings. For instance, some studies suggest that downtime can be reduced by up to 30%, translating to significant cost savings over time. This underscores the importance of investing in advanced apheresis technologies and adopting best practices to maximize their value.

Apheresis Devices Market Size

In-Depth Market Segmentation: Apheresis Devices Market

The apheresis devices industry research report provides comprehensive data (region-wise segment analysis), with forecasts and estimates in "USD billion" for the period 2024-2028, as well as historical data from 2018-2022 for the following segments.

  • Product
    • Systems
    • Consumables
  • Application
    • Neurological disorders
    • Haematological disorders
    • Renal disorders
    • Autoimmune disorders
  • Geography
    • North America
      • US
      • Canada
    • Europe
      • Germany
      • UK
    • APAC
      • China
    • Rest of World (ROW)

By Product Insights

The systems segment is estimated to witness significant growth during the forecast period.

The market encompasses advanced systems designed for the separation and collection of specific blood components, including plasma, platelets, red blood cells, and white blood cells. Centrifugation and filtration technologies are predominantly used in these systems, which consist of centrifuges, filters, optical sensors, and pumps. Integration of automated procedure programming in apheresis systems ensures accurate blood volume management and reduces overdraws or underdraws, enhancing patient safety and procedure efficacy. Apheresis systems are integral to extracorporeal treatment, donor safety protocols, and therapeutic applications, such as hematopoietic stem cell collection and immunoglobulin purification.

Apheresis Devices Market Size

Request Free Sample

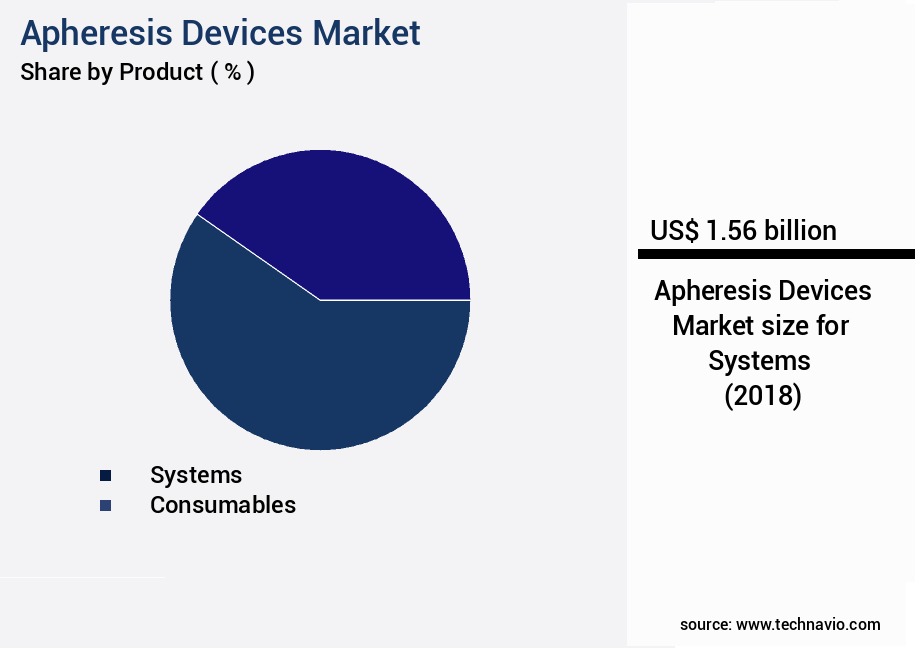
The Systems segment was valued at USD 1.56 billion in 2018 and showed a gradual increase during the forecast period.

The market witnesses continuous advancements in apheresis device automation, anticoagulation management, and device sterilization. For instance, automated apheresis systems have improved blood cell recovery by up to 95%, ensuring optimal blood processing steps and data logging capabilities for regulatory compliance.

Apheresis Devices Market Size

Request Free Sample

Regional Analysis

North America is estimated to contribute 44% to the growth of the global market during the forecast period. Technavio's analysts have elaborately explained the regional trends and drivers that shape the market during the forecast period.

Apheresis Devices Market Share by Geography

See How Apheresis Devices Market Demand is Rising in North America Request Free Sample

The market is experiencing significant growth, particularly in North America, which accounts for a substantial market share. Fueled by the rising prevalence of cardiovascular diseases (CVDs) and neurological disorders, the region's market expansion is driven by an increasing number of surgical procedures, growing awareness among healthcare professionals, and escalating healthcare expenditure. Furthermore, advanced medical devices and the presence of prominent companies are key contributors to the market's growth. According to the American Heart Association, approximately 91.1 million adults in the United States have one or more types of CVDs.

Apheresis procedures offer operational efficiency gains through cost reduction and compliance with stringent regulatory requirements, making them increasingly popular in healthcare settings. This technological advancement is expected to continue driving market growth in North America.

Apheresis Devices Market Share by Geography

 Customer Landscape of Apheresis Devices Industry

Competitive Intelligence by Technavio Analysis: Leading Players in the Apheresis Devices Market

Companies are implementing various strategies, such as strategic alliances, apheresis devices market forecast, partnerships, mergers and acquisitions, geographical expansion, and product/service launches, to enhance their presence in the industry.

Asahi Kasei Corp. - The company specializes in manufacturing and supplying apheresis devices, including Plasmaflo OP, Cascadeflo EC, IMMUSORBA TR, IMMUSORBA PH, PLASORBA BR, CUREFLO, and others. 

The industry research and growth report includes detailed analyses of the competitive landscape of the market and information about key companies, including:

  • Asahi Kasei Corp.
  • B.Braun SE
  • BioIVT LLC
  • Braun and Co. Ltd.
  • Charles River Laboratories International Inc.
  • Fresenius Medical Care AG and Co. KGaA
  • Haemonetics Corp.
  • Haier Smart Home Co. Ltd.
  • Kaneka Corp.
  • Lmb Technologie GmbH
  • Mallinckrodt Plc
  • Medica S.p.A.
  • MICRO TECHNOLOGIES
  • Miltenyi Biotec B.V. and Co. KG
  • Nikkiso Co. Ltd.
  • OTSUKA ELECTRONICS CO. LTD
  • Kawasumi Laboratories Inc.
  • Terumo Corp.
  • Cerus Corp.

Qualitative and quantitative analysis of companies has been conducted to help clients understand the wider business environment as well as the strengths and weaknesses of key industry players. Data is qualitatively analyzed to categorize companies as pure play, category-focused, industry-focused, and diversified; it is quantitatively analyzed to categorize companies as dominant, leading, strong, tentative, and weak.

Recent Development and News in Apheresis Devices Market

  • In January 2024, Terumo BCT, a leading global medical device manufacturer, announced the launch of its new Fresenius Kabi-terumo B.Braun Jena T-System 300 apheresis system. This advanced device offers increased efficiency and improved patient comfort (Terumo BCT Press Release, 2024).
  • In March 2024, Fresenius Medical Care and GE Healthcare entered into a strategic partnership to co-develop and commercialize integrated apheresis and dialysis systems. This collaboration aims to streamline patient care and improve treatment outcomes for patients undergoing apheresis and hemodialysis (Fresenius Medical Care Press Release, 2024).
  • In May 2025, Fresenius Medical Care AG & Co. KGaA completed the acquisition of Natera, Inc.'s Kidney Care business, including its automated plasma exchange and filtration systems. This acquisition strengthened Fresenius' position in the apheresis market and expanded its product portfolio (Fresenius Medical Care Press Release, 2025).
  • In September 2025, the European Commission granted marketing authorization for the new Spectra Optia Apheresis System from Grifols. This approval marks the first fully automated, disposable apheresis system in Europe, offering increased efficiency and cost savings for healthcare providers (Grifols Press Release, 2025).

Dive into Technavio's robust research methodology, blending expert interviews, extensive data synthesis, and validated models for unparalleled Apheresis Devices Market insights. See full methodology.

Market Scope

Report Coverage

Details

Page number

169

Base year

2023

Historic period

2018-2022

Forecast period

2024-2028

Growth momentum & CAGR

Accelerate at a CAGR of 8.45%

Market growth 2024-2028

USD 1.59 billion

Market structure

Fragmented

YoY growth 2023-2024(%)

7.22

Key countries

US, Canada, Germany, UK, and China

Competitive landscape

Leading Companies, Market Positioning of Companies, Competitive Strategies, and Industry Risks

Request Free Sample

Why Choose Technavio for Apheresis Devices Market Insights?

The market is witnessing significant growth due to the increasing demand for advanced leukapheresis systems that ensure high cell collection efficiency and optimized red blood cell recovery rates. Automation in plateletpheresis devices is a key trend, with manufacturers focusing on developing systems with higher automation levels to streamline procedures and reduce human error. Contamination control is another critical factor driving market growth, with manufacturers prioritizing safety mechanisms to prevent system contamination during plasmapheresis treatments. These mechanisms include advanced filtration systems, closed systems, and stringent validation protocols for the immunoglobulin purification process. Therapeutic apheresis treatment protocols require precise optimization of various parameters, including blood volume monitoring accuracy and automated cell counting system precision. Patient blood safety during procedures is paramount, and apheresis systems must comply with strict regulatory requirements. Single-use apheresis systems offer numerous benefits, including reduced contamination risk and streamlined disposal processes. Closed systems, in particular, are gaining popularity due to their lower contamination risk and ease of use. However, the cost-effectiveness of disposable components is a concern, and manufacturers must balance the benefits of single-use systems against the costs. Apheresis device maintenance guidelines are essential to ensure optimal system performance and prolong their lifespan. Perfusion system flow rate optimization is critical to maintain system efficiency and reduce downtime. Apheresis data management systems must be integrated into hospital workflows to facilitate seamless data transfer and analysis. Apheresis system software validation is a crucial aspect of operational planning and supply chain management, with manufacturers investing in robust validation processes to ensure system reliability and regulatory compliance. The market for apheresis devices is expected to grow at a steady pace, with increasing demand for advanced systems that offer improved efficiency, safety, and cost-effectiveness.

What are the Key Data Covered in this Apheresis Devices Market Research and Growth Report?

  • What is the expected growth of the Apheresis Devices Market between 2024 and 2028?

    • USD 1.59 billion, at a CAGR of 8.45%

  • What segmentation does the market report cover?

    • The report is segmented by Product (Systems and Consumables), Application (Neurological disorders, Haematological disorders, Renal disorders, and Autoimmune disorders), and Geography (North America, Europe, Asia, and Rest of World (ROW))

  • Which regions are analyzed in the report?

    • North America, Europe, Asia, and Rest of World (ROW)

  • What are the key growth drivers and market challenges?

    • Growth in new indications for plasma products, High costs associated with apheresis devices and procedures

  • Who are the major players in the Apheresis Devices Market?

    • Asahi Kasei Corp., B.Braun SE, BioIVT LLC, Braun and Co. Ltd., Charles River Laboratories International Inc., Fresenius Medical Care AG and Co. KGaA, Haemonetics Corp., Haier Smart Home Co. Ltd., Kaneka Corp., Lmb Technologie GmbH, Mallinckrodt Plc, Medica S.p.A., MICRO TECHNOLOGIES, Miltenyi Biotec B.V. and Co. KG, Nikkiso Co. Ltd., OTSUKA ELECTRONICS CO. LTD, Kawasumi Laboratories Inc., Terumo Corp., and Cerus Corp.

We can help! Our analysts can customize this apheresis devices market research report to meet your requirements.

Get in touch

1 Executive Summary

  • 1.1 Market overview
    • Exhibit 01: Executive Summary – Chart on Market Overview
    • Exhibit 02: Executive Summary – Data Table on Market Overview
    • Exhibit 03: Executive Summary – Chart on Global Market Characteristics
    • Exhibit 04: Executive Summary – Chart on Market by Geography
    • Exhibit 05: Executive Summary – Chart on Market Segmentation by Product
    • Exhibit 06: Executive Summary – Chart on Market Segmentation by Application
    • Exhibit 07: Executive Summary – Chart on Incremental Growth
    • Exhibit 08: Executive Summary – Data Table on Incremental Growth
    • Exhibit 09: Executive Summary – Chart on Vendor Market Positioning

2 Market Landscape

  • 2.1 Market ecosystem
    • Exhibit 10: Parent market
    • Exhibit 11: Market Characteristics

3 Market Sizing

  • 3.1 Market definition
    • Exhibit 12: Offerings of vendors included in the market definition
  • 3.2 Market segment analysis
    • Exhibit 13: Market segments
  • 3.3 Market size 2023
    • 3.4 Market outlook: Forecast for 2023-2028
      • Exhibit 14: Chart on Global - Market size and forecast 2023-2028 ($ billion)
      • Exhibit 15: Data Table on Global - Market size and forecast 2023-2028 ($ billion)
      • Exhibit 16: Chart on Global Market: Year-over-year growth 2023-2028 (%)
      • Exhibit 17: Data Table on Global Market: Year-over-year growth 2023-2028 (%)

    4 Historic Market Size

    • 4.1 Global apheresis devices market 2018 - 2022
      • Exhibit 18: Historic Market Size – Data Table on global apheresis devices market 2018 - 2022 ($ billion)
    • 4.2 Product Segment Analysis 2018 - 2022
      • Exhibit 19: Historic Market Size – Product Segment 2018 - 2022 ($ billion)
    • 4.3 Application Segment Analysis 2018 - 2022
      • Exhibit 20: Historic Market Size – Application Segment 2018 - 2022 ($ billion)
    • 4.4 Geography Segment Analysis 2018 - 2022
      • Exhibit 21: Historic Market Size – Geography Segment 2018 - 2022 ($ billion)
    • 4.5 Country Segment Analysis 2018 - 2022
      • Exhibit 22: Historic Market Size – Country Segment 2018 - 2022 ($ billion)

    5 Five Forces Analysis

    • 5.1 Five forces summary
      • Exhibit 23: Five forces analysis - Comparison between 2023 and 2028
    • 5.2 Bargaining power of buyers
      • Exhibit 24: Chart on Bargaining power of buyers – Impact of key factors 2023 and 2028
    • 5.3 Bargaining power of suppliers
      • Exhibit 25: Bargaining power of suppliers – Impact of key factors in 2023 and 2028
    • 5.4 Threat of new entrants
      • Exhibit 26: Threat of new entrants – Impact of key factors in 2023 and 2028
    • 5.5 Threat of substitutes
      • Exhibit 27: Threat of substitutes – Impact of key factors in 2023 and 2028
    • 5.6 Threat of rivalry
      • Exhibit 28: Threat of rivalry – Impact of key factors in 2023 and 2028
    • 5.7 Market condition
      • Exhibit 29: Chart on Market condition - Five forces 2023 and 2028

    6 Market Segmentation by Product

    • 6.1 Market segments
      • Exhibit 30: Chart on Product - Market share 2023-2028 (%)
      • Exhibit 31: Data Table on Product - Market share 2023-2028 (%)
    • 6.2 Comparison by Product
      • Exhibit 32: Chart on Comparison by Product
      • Exhibit 33: Data Table on Comparison by Product
    • 6.3 Systems - Market size and forecast 2023-2028
      • Exhibit 34: Chart on Systems - Market size and forecast 2023-2028 ($ billion)
      • Exhibit 35: Data Table on Systems - Market size and forecast 2023-2028 ($ billion)
      • Exhibit 36: Chart on Systems - Year-over-year growth 2023-2028 (%)
      • Exhibit 37: Data Table on Systems - Year-over-year growth 2023-2028 (%)
    • 6.4 Consumables - Market size and forecast 2023-2028
      • Exhibit 38: Chart on Consumables - Market size and forecast 2023-2028 ($ billion)
      • Exhibit 39: Data Table on Consumables - Market size and forecast 2023-2028 ($ billion)
      • Exhibit 40: Chart on Consumables - Year-over-year growth 2023-2028 (%)
      • Exhibit 41: Data Table on Consumables - Year-over-year growth 2023-2028 (%)
    • 6.5 Market opportunity by Product
      • Exhibit 42: Market opportunity by Product ($ billion)
      • Exhibit 43: Data Table on Market opportunity by Product ($ billion)

    7 Market Segmentation by Application

    • 7.1 Market segments
      • Exhibit 44: Chart on Application - Market share 2023-2028 (%)
      • Exhibit 45: Data Table on Application - Market share 2023-2028 (%)
    • 7.2 Comparison by Application
      • Exhibit 46: Chart on Comparison by Application
      • Exhibit 47: Data Table on Comparison by Application
    • 7.3 Neurological disorders - Market size and forecast 2023-2028
      • Exhibit 48: Chart on Neurological disorders - Market size and forecast 2023-2028 ($ billion)
      • Exhibit 49: Data Table on Neurological disorders - Market size and forecast 2023-2028 ($ billion)
      • Exhibit 50: Chart on Neurological disorders - Year-over-year growth 2023-2028 (%)
      • Exhibit 51: Data Table on Neurological disorders - Year-over-year growth 2023-2028 (%)
    • 7.4 Haematological disorders - Market size and forecast 2023-2028
      • Exhibit 52: Chart on Haematological disorders - Market size and forecast 2023-2028 ($ billion)
      • Exhibit 53: Data Table on Haematological disorders - Market size and forecast 2023-2028 ($ billion)
      • Exhibit 54: Chart on Haematological disorders - Year-over-year growth 2023-2028 (%)
      • Exhibit 55: Data Table on Haematological disorders - Year-over-year growth 2023-2028 (%)
    • 7.5 Renal disorders - Market size and forecast 2023-2028
      • Exhibit 56: Chart on Renal disorders - Market size and forecast 2023-2028 ($ billion)
      • Exhibit 57: Data Table on Renal disorders - Market size and forecast 2023-2028 ($ billion)
      • Exhibit 58: Chart on Renal disorders - Year-over-year growth 2023-2028 (%)
      • Exhibit 59: Data Table on Renal disorders - Year-over-year growth 2023-2028 (%)
    • 7.6 Autoimmune disorders - Market size and forecast 2023-2028
      • Exhibit 60: Chart on Autoimmune disorders - Market size and forecast 2023-2028 ($ billion)
      • Exhibit 61: Data Table on Autoimmune disorders - Market size and forecast 2023-2028 ($ billion)
      • Exhibit 62: Chart on Autoimmune disorders - Year-over-year growth 2023-2028 (%)
      • Exhibit 63: Data Table on Autoimmune disorders - Year-over-year growth 2023-2028 (%)
    • 7.7 Market opportunity by Application
      • Exhibit 64: Market opportunity by Application ($ billion)
      • Exhibit 65: Data Table on Market opportunity by Application ($ billion)

    8 Customer Landscape

    • 8.1 Customer landscape overview
      • Exhibit 66: Analysis of price sensitivity, lifecycle, customer purchase basket, adoption rates, and purchase criteria

    9 Geographic Landscape

    • 9.1 Geographic segmentation
      • Exhibit 67: Chart on Market share by geography 2023-2028 (%)
      • Exhibit 68: Data Table on Market share by geography 2023-2028 (%)
    • 9.2 Geographic comparison
      • Exhibit 69: Chart on Geographic comparison
      • Exhibit 70: Data Table on Geographic comparison
    • 9.3 North America - Market size and forecast 2023-2028
      • Exhibit 71: Chart on North America - Market size and forecast 2023-2028 ($ billion)
      • Exhibit 72: Data Table on North America - Market size and forecast 2023-2028 ($ billion)
      • Exhibit 73: Chart on North America - Year-over-year growth 2023-2028 (%)
      • Exhibit 74: Data Table on North America - Year-over-year growth 2023-2028 (%)
    • 9.4 Europe - Market size and forecast 2023-2028
      • Exhibit 75: Chart on Europe - Market size and forecast 2023-2028 ($ billion)
      • Exhibit 76: Data Table on Europe - Market size and forecast 2023-2028 ($ billion)
      • Exhibit 77: Chart on Europe - Year-over-year growth 2023-2028 (%)
      • Exhibit 78: Data Table on Europe - Year-over-year growth 2023-2028 (%)
    • 9.5 Asia - Market size and forecast 2023-2028
      • Exhibit 79: Chart on Asia - Market size and forecast 2023-2028 ($ billion)
      • Exhibit 80: Data Table on Asia - Market size and forecast 2023-2028 ($ billion)
      • Exhibit 81: Chart on Asia - Year-over-year growth 2023-2028 (%)
      • Exhibit 82: Data Table on Asia - Year-over-year growth 2023-2028 (%)
    • 9.6 Rest of World (ROW) - Market size and forecast 2023-2028
      • Exhibit 83: Chart on Rest of World (ROW) - Market size and forecast 2023-2028 ($ billion)
      • Exhibit 84: Data Table on Rest of World (ROW) - Market size and forecast 2023-2028 ($ billion)
      • Exhibit 85: Chart on Rest of World (ROW) - Year-over-year growth 2023-2028 (%)
      • Exhibit 86: Data Table on Rest of World (ROW) - Year-over-year growth 2023-2028 (%)
    • 9.7 US - Market size and forecast 2023-2028
      • Exhibit 87: Chart on US - Market size and forecast 2023-2028 ($ billion)
      • Exhibit 88: Data Table on US - Market size and forecast 2023-2028 ($ billion)
      • Exhibit 89: Chart on US - Year-over-year growth 2023-2028 (%)
      • Exhibit 90: Data Table on US - Year-over-year growth 2023-2028 (%)
    • 9.8 Germany - Market size and forecast 2023-2028
      • Exhibit 91: Chart on Germany - Market size and forecast 2023-2028 ($ billion)
      • Exhibit 92: Data Table on Germany - Market size and forecast 2023-2028 ($ billion)
      • Exhibit 93: Chart on Germany - Year-over-year growth 2023-2028 (%)
      • Exhibit 94: Data Table on Germany - Year-over-year growth 2023-2028 (%)
    • 9.9 Canada - Market size and forecast 2023-2028
      • Exhibit 95: Chart on Canada - Market size and forecast 2023-2028 ($ billion)
      • Exhibit 96: Data Table on Canada - Market size and forecast 2023-2028 ($ billion)
      • Exhibit 97: Chart on Canada - Year-over-year growth 2023-2028 (%)
      • Exhibit 98: Data Table on Canada - Year-over-year growth 2023-2028 (%)
    • 9.10 UK - Market size and forecast 2023-2028
      • Exhibit 99: Chart on UK - Market size and forecast 2023-2028 ($ billion)
      • Exhibit 100: Data Table on UK - Market size and forecast 2023-2028 ($ billion)
      • Exhibit 101: Chart on UK - Year-over-year growth 2023-2028 (%)
      • Exhibit 102: Data Table on UK - Year-over-year growth 2023-2028 (%)
    • 9.11 China - Market size and forecast 2023-2028
      • Exhibit 103: Chart on China - Market size and forecast 2023-2028 ($ billion)
      • Exhibit 104: Data Table on China - Market size and forecast 2023-2028 ($ billion)
      • Exhibit 105: Chart on China - Year-over-year growth 2023-2028 (%)
      • Exhibit 106: Data Table on China - Year-over-year growth 2023-2028 (%)
    • 9.12 Market opportunity by geography
      • Exhibit 107: Market opportunity by geography ($ billion)
      • Exhibit 108: Data Tables on Market opportunity by geography ($ billion)

    10 Drivers, Challenges, and Trends

    • 10.1 Market drivers
      • 10.2 Market challenges
        • 10.3 Impact of drivers and challenges
          • Exhibit 109: Impact of drivers and challenges in 2023 and 2028
        • 10.4 Market trends

          11 Vendor Landscape

          • 11.1 Overview
            • 11.2 Vendor landscape
              • Exhibit 110: Overview on Criticality of inputs and Factors of differentiation
            • 11.3 Landscape disruption
              • Exhibit 111: Overview on factors of disruption
            • 11.4 Industry risks
              • Exhibit 112: Impact of key risks on business

            12 Vendor Analysis

            • 12.1 Vendors covered
              • Exhibit 113: Vendors covered
            • 12.2 Market positioning of vendors
              • Exhibit 114: Matrix on vendor position and classification
            • 12.3 Asahi Kasei Corp.
              • Exhibit 115: Asahi Kasei Corp. - Overview
              • Exhibit 116: Asahi Kasei Corp. - Business segments
              • Exhibit 117: Asahi Kasei Corp. - Key news
              • Exhibit 118: Asahi Kasei Corp. - Key offerings
              • Exhibit 119: Asahi Kasei Corp. - Segment focus
            • 12.4 B.Braun SE
              • Exhibit 120: B.Braun SE - Overview
              • Exhibit 121: B.Braun SE - Business segments
              • Exhibit 122: B.Braun SE - Key offerings
              • Exhibit 123: B.Braun SE - Segment focus
            • 12.5 BioIVT LLC
              • Exhibit 124: BioIVT LLC - Overview
              • Exhibit 125: BioIVT LLC - Product / Service
              • Exhibit 126: BioIVT LLC - Key news
              • Exhibit 127: BioIVT LLC - Key offerings
            • 12.6 Cerus Corp.
              • Exhibit 128: Cerus Corp. - Overview
              • Exhibit 129: Cerus Corp. - Product / Service
              • Exhibit 130: Cerus Corp. - Key offerings
            • 12.7 Charles River Laboratories International Inc.
              • Exhibit 131: Charles River Laboratories International Inc. - Overview
              • Exhibit 132: Charles River Laboratories International Inc. - Business segments
              • Exhibit 133: Charles River Laboratories International Inc. - Key news
              • Exhibit 134: Charles River Laboratories International Inc. - Key offerings
              • Exhibit 135: Charles River Laboratories International Inc. - Segment focus
            • 12.8 Fresenius Medical Care AG and Co. KGaA
              • Exhibit 136: Fresenius Medical Care AG and Co. KGaA - Overview
              • Exhibit 137: Fresenius Medical Care AG and Co. KGaA - Business segments
              • Exhibit 138: Fresenius Medical Care AG and Co. KGaA - Key news
              • Exhibit 139: Fresenius Medical Care AG and Co. KGaA - Key offerings
              • Exhibit 140: Fresenius Medical Care AG and Co. KGaA - Segment focus
            • 12.9 Haemonetics Corp.
              • Exhibit 141: Haemonetics Corp. - Overview
              • Exhibit 142: Haemonetics Corp. - Business segments
              • Exhibit 143: Haemonetics Corp. - Key offerings
              • Exhibit 144: Haemonetics Corp. - Segment focus
            • 12.10 Haier Smart Home Co. Ltd.
              • Exhibit 145: Haier Smart Home Co. Ltd. - Overview
              • Exhibit 146: Haier Smart Home Co. Ltd. - Business segments
              • Exhibit 147: Haier Smart Home Co. Ltd. - Key offerings
              • Exhibit 148: Haier Smart Home Co. Ltd. - Segment focus
            • 12.11 Kaneka Corp.
              • Exhibit 149: Kaneka Corp. - Overview
              • Exhibit 150: Kaneka Corp. - Business segments
              • Exhibit 151: Kaneka Corp. - Key offerings
              • Exhibit 152: Kaneka Corp. - Segment focus
            • 12.12 Kawasumi Laboratories Inc.
              • Exhibit 153: Kawasumi Laboratories Inc. - Overview
              • Exhibit 154: Kawasumi Laboratories Inc. - Product / Service
              • Exhibit 155: Kawasumi Laboratories Inc. - Key offerings
            • 12.13 Lmb Technologie GmbH
              • Exhibit 156: Lmb Technologie GmbH - Overview
              • Exhibit 157: Lmb Technologie GmbH - Product / Service
              • Exhibit 158: Lmb Technologie GmbH - Key offerings
            • 12.14 Mallinckrodt Plc
              • Exhibit 159: Mallinckrodt Plc - Overview
              • Exhibit 160: Mallinckrodt Plc - Business segments
              • Exhibit 161: Mallinckrodt Plc - Key offerings
              • Exhibit 162: Mallinckrodt Plc - Segment focus
            • 12.15 Medica S.p.A.
              • Exhibit 163: Medica S.p.A. - Overview
              • Exhibit 164: Medica S.p.A. - Product / Service
              • Exhibit 165: Medica S.p.A. - Key offerings
            • 12.16 Miltenyi Biotec B.V. and Co. KG
              • Exhibit 166: Miltenyi Biotec B.V. and Co. KG - Overview
              • Exhibit 167: Miltenyi Biotec B.V. and Co. KG - Product / Service
              • Exhibit 168: Miltenyi Biotec B.V. and Co. KG - Key offerings
            • 12.17 Nikkiso Co. Ltd.
              • Exhibit 169: Nikkiso Co. Ltd. - Overview
              • Exhibit 170: Nikkiso Co. Ltd. - Business segments
              • Exhibit 171: Nikkiso Co. Ltd. - Key news
              • Exhibit 172: Nikkiso Co. Ltd. - Key offerings
              • Exhibit 173: Nikkiso Co. Ltd. - Segment focus

            13 Appendix

            • 13.1 Scope of the report
              • 13.2 Inclusions and exclusions checklist
                • Exhibit 174: Inclusions checklist
                • Exhibit 175: Exclusions checklist
              • 13.3 Currency conversion rates for US$
                • Exhibit 176: Currency conversion rates for US$
              • 13.4 Research methodology
                • Exhibit 177: Research methodology
                • Exhibit 178: Validation techniques employed for market sizing
                • Exhibit 179: Information sources
              • 13.5 List of abbreviations
                • Exhibit 180: List of abbreviations

              Research Methodology

              Technavio presents a detailed picture of the market by way of study, synthesis, and summation of data from multiple sources. The analysts have presented the various facets of the market with a particular focus on identifying the key industry influencers. The data thus presented is comprehensive, reliable, and the result of extensive research, both primary and secondary.

              INFORMATION SOURCES

              Primary sources

              • Manufacturers and suppliers
              • Channel partners
              • Industry experts
              • Strategic decision makers

              Secondary sources

              • Industry journals and periodicals
              • Government data
              • Financial reports of key industry players
              • Historical data
              • Press releases

              DATA ANALYSIS

              Data Synthesis

              • Collation of data
              • Estimation of key figures
              • Analysis of derived insights

              Data Validation

              • Triangulation with data models
              • Reference against proprietary databases
              • Corroboration with industry experts

              REPORT WRITING

              Qualitative

              • Market drivers
              • Market challenges
              • Market trends
              • Five forces analysis

              Quantitative

              • Market size and forecast
              • Market segmentation
              • Geographical insights
              • Competitive landscape

              Interested in this report?

              Get your sample now to see our research methodology and insights!

              Download Now

              Frequently Asked Questions

              Apheresis Devices market growth will increase by $ 1.59 bn during 2024-2028.

              The Apheresis Devices market is expected to grow at a CAGR of 8.45% during 2024-2028.

              Apheresis Devices market is segmented by Product( Systems, Consumables) Application( Neurological disorders, Haematological disorders, Renal disorders, Autoimmune disorders)

              Asahi Kasei Corp., B.Braun SE, BioIVT LLC, Braun and Co. Ltd., Charles River Laboratories International Inc., Fresenius Medical Care AG and Co. KGaA, Haemonetics Corp., Haier Smart Home Co. Ltd., Kaneka Corp., Lmb Technologie GmbH, Mallinckrodt Plc, Medica S.p.A., MICRO TECHNOLOGIES, Miltenyi Biotec B.V. and Co. KG, Nikkiso Co. Ltd., OTSUKA ELECTRONICS CO. LTD, Kawasumi Laboratories Inc., Terumo Corp., Cerus Corp. are a few of the key vendors in the Apheresis Devices market.

              North America will register the highest growth rate of 44% among the other regions. Therefore, the Apheresis Devices market in North America is expected to garner significant business opportunities for the vendors during the forecast period.

              US, Canada, Germany, UK, China

              • Growth in new indications for plasma productsPlasma products or plasma-derived medicinal products are used for various therapeutic applications. These products are derived from the blood of donors and can be used as life-saving options for various medical conditions such as trauma is the driving factor this market.
              • massive transfusion is the driving factor this market.
              • disseminated intravascular coagulation (DIC) is the driving factor this market.
              • and bleeding associated with vitamin K antagonist anticoagulation. Plasma products are mainly transfused to correct deficiencies of clotting factors in the blood. Fresh-frozen plasma is the driving factor this market.
              • solvent-treated plasma is the driving factor this market.
              • and methylene blue-treated plasma are majorly used for a wide array of therapeutic applications. Plasma is the primary source of immunoglobulin (Ig) is the driving factor this market.
              • albumin is the driving factor this market.
              • and coagulation factors is the driving factor this market.
              • which are used in the treatment of neurological conditions is the driving factor this market.
              • hematological disorders is the driving factor this market.
              • excessive clotting is the driving factor this market.
              • chronic obstructive pulmonary disease (COPD) as well as renal dialysis. Companies in the pharmaceutical and biopharmaceutical industries are concentrating on creating products derived from plasma to treat a range of medical conditions. Plasma can be collected as recovered plasma or source plasma. Source plasma is mainly derived through the apheresis process. During the plasmapheresis process is the driving factor this market.
              • source plasma is obtained from the blood of donors is the driving factor this market.
              • where other blood cells are transfused back to them. Various disease indications such as acute Guillain-Barre syndrome (GBS) is the driving factor this market.
              • Myasthenia gravis (MG) is the driving factor this market.
              • thrombotic thrombocytopenic purpura is the driving factor this market.
              • Fulminant Wilsons disease is the driving factor this market.
              • chronic focal encephalitis is the driving factor this market.
              • and cerebral systemic lupus erythematosus (SLE) are majorly treated with the therapeutic plasma exchange process. Vendors present in the global apheresis devices market are focusing on the development of advanced products to obtain source plasma is the driving factor this market.
              • which can be used to treat specific diseases. Thus is the driving factor this market.
              • growth in new indications for plasma products tends to boost the growth of the global apheresis devices market during the forecast period. is the driving factor this market.

              The Apheresis Devices market vendors should focus on grabbing business opportunities from the Systems segment as it accounted for the largest market share in the base year.
              RIA - Research AI Assistant
              Ask RIA