Apparel Logistics Market Analysis, Size, and Forecast 2026-2030: Europe (Germany, UK, and France), North America (US, Canada, and Mexico), APAC (China, India, and Japan), South America (Brazil, Argentina, and Colombia), Middle East and Africa (Saudi Arabia, UAE, and South Africa), and Rest of World (ROW)

Apparel Logistics Market Analysis, Size, and Forecast 2026-2030:
Europe (Germany, UK, and France), North America (US, Canada, and Mexico), APAC (China, India, and Japan), South America (Brazil, Argentina, and Colombia), Middle East and Africa (Saudi Arabia, UAE, and South Africa), and Rest of World (ROW)

Published: Dec 2025 289 Pages SKU: IRTNTR74337

Market Overview at a Glance

$52.35 B
Market Opportunity
7.1%
CAGR 2025 - 2030
35.3%
Europe Growth
$48.15 B
Transportation segment 2024

Apparel Logistics Market Size 2026-2030

The apparel logistics market size is valued to increase by USD 52.35 billion, at a CAGR of 7.1% from 2025 to 2030. Fast replenishment cycle in apparel industry will drive the apparel logistics market.

Major Market Trends & Insights

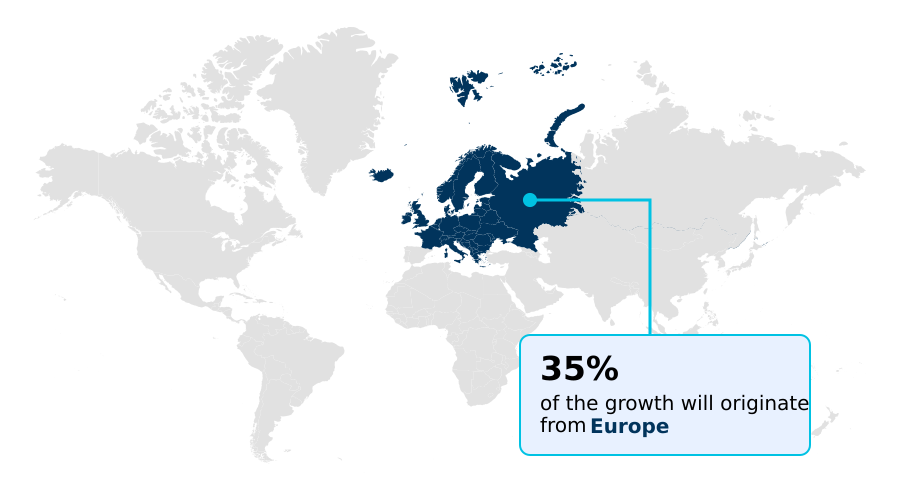
  • Europe dominated the market and accounted for a 35.3% growth during the forecast period.
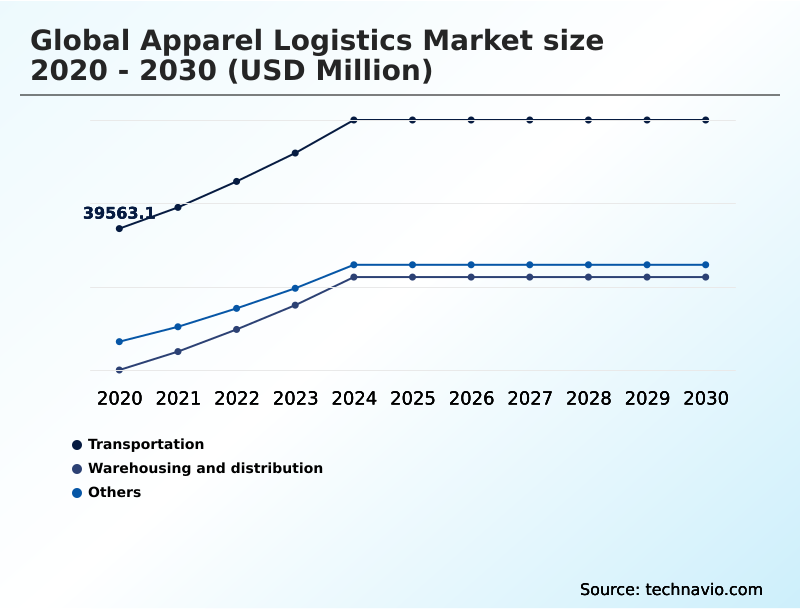
  • By Service Type - Transportation segment was valued at USD 48.15 billion in 2024
  • By Product - Pre-production segment accounted for the largest market revenue share in 2024

Market Size & Forecast

  • Market Opportunities: USD 82.23 billion
  • Market Future Opportunities: USD 52.35 billion
  • CAGR from 2025 to 2030 : 7.1%

Market Summary

  • The apparel logistics market is undergoing a significant transformation, driven by the dual pressures of fast fashion and the rise of e-commerce. Success in this environment depends on achieving a delicate balance between speed, cost, and sustainability.
  • Key drivers include the adoption of omnichannel retailing, which demands a seamless integration of physical and digital sales channels, and the relentless pace of the fast fashion supply chain, requiring rapid inventory turnover.
  • In response, logistics providers are investing heavily in distribution center automation and advanced warehouse management platforms to handle high volumes of stock keeping units (SKU) and complex order fulfillment.
  • For instance, a global fashion brand must orchestrate a complex network to manage its e-commerce fulfillment, including efficient returns processing for online purchases, which can account for a significant portion of sales. This necessitates sophisticated reverse logistics capabilities. However, the industry faces challenges from supply chain complexity and volatile operational costs.
  • The strategic implementation of technologies that improve supply chain visibility and enable agile responses to demand forecasting is no longer a competitive advantage but a fundamental requirement for survival and growth in a highly dynamic market.

What will be the Size of the Apparel Logistics Market during the forecast period?

Get Key Insights on Market Forecast (PDF) Request Free Sample

How is the Apparel Logistics Market Segmented?

The apparel logistics industry research report provides comprehensive data (region-wise segment analysis), with forecasts and estimates in "USD million" for the period 2026-2030, as well as historical data from 2020-2024 for the following segments.

  • Service type
    • Transportation
    • Warehousing and distribution
    • Others
  • Product
    • Pre-production
    • Trade logistics
  • Mode of transportation
    • Road
    • Air
    • Rail
    • Water
  • Geography
    • Europe
      • Germany
      • UK
      • France
    • North America
      • US
      • Canada
      • Mexico
    • APAC
      • China
      • India
      • Japan
    • South America
      • Brazil
      • Argentina
      • Colombia
    • Middle East and Africa
      • Saudi Arabia
      • UAE
      • South Africa
    • Rest of World (ROW)

By Service Type Insights

The transportation segment is estimated to witness significant growth during the forecast period.

The transportation segment is evolving beyond simple freight movement to offer sophisticated, value-driven services. Providers are delivering high schedule reliability through integrated networks, a crucial factor for brands managing tight production timelines and high inventory turnover.

For luxury goods logistics, specialized handling like garment-on-hanger (GOH) transport is standard, while sea-air combined transport offers a balanced solution for speed and cost. A key differentiator is the ability to manage a high diversity of stock keeping units (SKU).

The push toward sustainability is promoting green logistics solutions and the adoption of a digital product passport to meet regulatory demands. This ensures end-to-end supply chain visibility and supports a more resilient fulfillment operation.

Request Free Sample

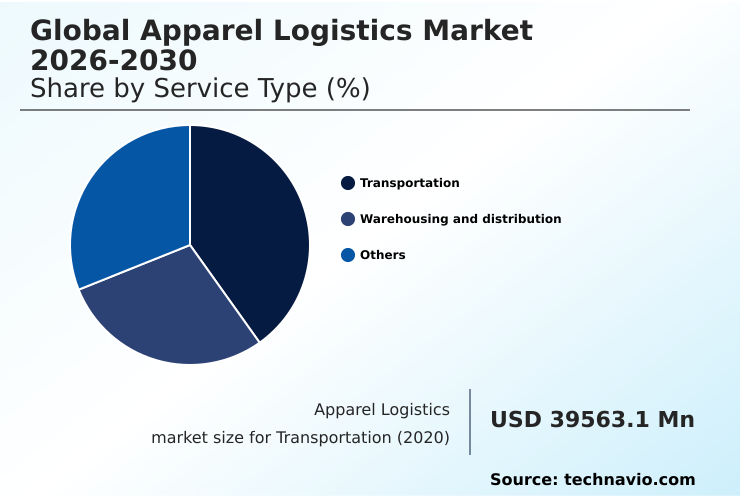
The Transportation segment was valued at USD 48.15 billion in 2024 and showed a gradual increase during the forecast period.

Request Free Sample

Regional Analysis

Europe is estimated to contribute 35.3% to the growth of the global market during the forecast period.Technavio’s analysts have elaborately explained the regional trends and drivers that shape the market during the forecast period.

See How Apparel Logistics Market Demand is Rising in Europe Request Free Sample

The geographic landscape of apparel logistics is being reshaped by strategic shifts in sourcing and distribution.

In North America, the trend of nearshoring logistics is gaining momentum, with many brands moving production to Mexico to achieve significant lead time reduction and enhance supply chain responsiveness, supported by bonded warehousing and efficient cross-docking facilities.

Europe, which accounts for 35.3% of the incremental growth, is pioneering the sustainable supply chain through stringent regulations and investment in multimodal transportation. Here, logistics network optimization focuses on balancing efficiency with a lower carbon footprint.

Meanwhile, APAC, contributing 29.93% to growth, is transitioning from a pure manufacturing hub to a major consumption market, requiring sophisticated omnichannel distribution networks.

This global reconfiguration requires logistics providers to adapt from traditional full truckload (FTL) models to more agile, regionally-focused strategies.

Market Dynamics

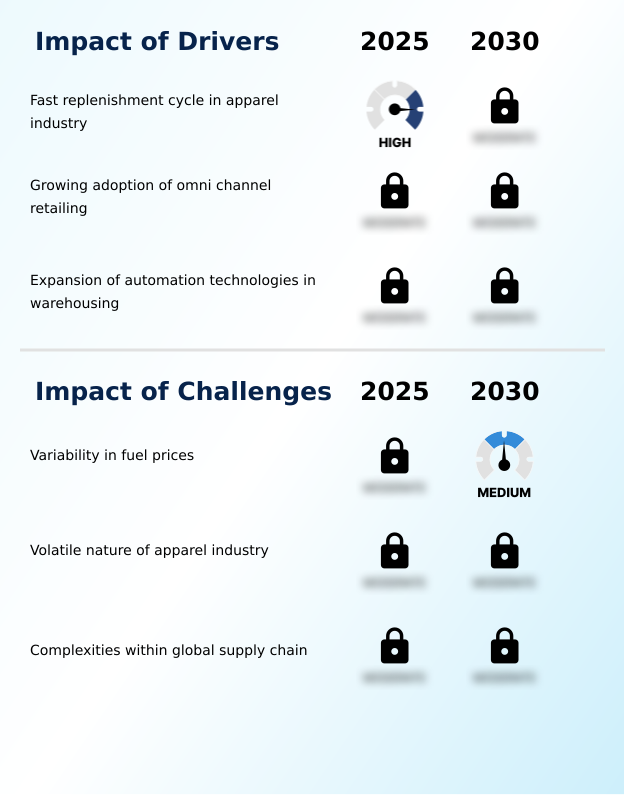
Our researchers analyzed the data with 2025 as the base year, along with the key drivers, trends, and challenges. A holistic analysis of drivers will help companies refine their marketing strategies to gain a competitive advantage.

  • The evolution of the apparel logistics market is being defined by a strategic focus on operational excellence and technological adoption. The imperative for improving last-mile delivery speed is driving investment in advanced routing systems and urban distribution hubs.
  • Simultaneously, automation in apparel warehousing is becoming standard practice for managing fast fashion inventory and handling high SKU complexity, which is essential for successful omnichannel fulfillment strategies. A key area of focus is optimizing apparel reverse logistics, as efficient returns management is critical for profitability.
  • Reducing apparel logistics costs remains a constant battle, with the impact of fuel price volatility forcing a re-evaluation of transport modes, including a closer look at LTL vs FTL for fashion shipments and the benefits of sea-air transport for apparel.
  • The successful implementation of RFID for inventory accuracy is directly linked to improving apparel supply chain visibility, a cornerstone of modern logistics. For high-end brands, specialized strategies for logistics for luxury fashion are crucial. As manufacturing diversifies, the nearshoring impact on logistics is significant, with some companies more than halving their lead times.
  • The effective use of technology in apparel logistics, especially in warehouse management for e-commerce, and understanding the role of 3PL in apparel are vital. These efforts are complicated by cross-border apparel logistics challenges and the need for a sustainable apparel supply chain, particularly in apparel logistics in emerging markets.

What are the key market drivers leading to the rise in the adoption of Apparel Logistics Industry?

  • The fast replenishment cycle in the apparel industry, driven by evolving fashion trends and consumer demand for speed, is a key driver for market growth.

  • The primary driver of the apparel logistics market is the need to support the high velocity of the fast fashion supply chain and the complexities of omnichannel retailing.
  • To meet consumer expectations for rapid delivery, companies are deploying networks of micro-fulfillment centers and leveraging digital freight matching platforms to optimize last-mile delivery.
  • Sophisticated warehouse management platforms are essential for orchestrating e-commerce fulfillment, where effective demand forecasting can improve inventory placement and reduce stockouts.
  • This focus on distribution center automation is not just about speed; strategies that enhance the omnichannel experience have been shown to boost customer loyalty by more than 15%.
  • These drivers are pushing logistics toward a more responsive and data-driven operational model.

What are the market trends shaping the Apparel Logistics Industry?

  • The growing adoption of RFID technology within the apparel industry is a significant market trend, enabling enhanced inventory visibility and operational efficiency across the supply chain.

  • The apparel logistics market is increasingly shaped by technological advancements that enhance visibility and efficiency. The adoption of item-level RFID is a pivotal trend, enabling near-perfect inventory accuracy and providing the granular data needed for robust supply chain traceability. This technology, coupled with real-time tracking systems, provides a foundation for sophisticated returns processing, a critical component of circular economy logistics.
  • As e-commerce continues to drive smaller, more frequent orders, the industry is seeing greater reliance on less-than-truckload (LTL) services and significant last-mile innovation. Furthermore, logistics providers are investing in automated sorting systems to manage the high volume of returns and prepare items for resale, which has been shown to accelerate the process by over 40%.

What challenges does the Apparel Logistics Industry face during its growth?

  • The variability in fuel prices presents a key challenge to the apparel logistics market, directly impacting transportation costs and overall profitability.

  • Navigating the apparel logistics market involves managing significant supply chain complexity and external risks. Volatility in operational expenses remains a primary concern, where effective logistics cost management is critical to preserving margins. Building supply chain resilience requires a robust transportation network with high schedule reliability to mitigate disruptions.
  • In certain regions, ensuring shipment integrity necessitates secure convoy protocols and specialized freight forwarding expertise. Cross-border movements add another layer of difficulty, with customs brokerage becoming a key strategic function. Furthermore, the industry is under pressure for carbon footprint reduction, which can conflict with the demand for speed.
  • Fuel costs, for instance, can account for over 25% of transport expenses, creating significant financial uncertainty for providers.

Exclusive Technavio Analysis on Customer Landscape

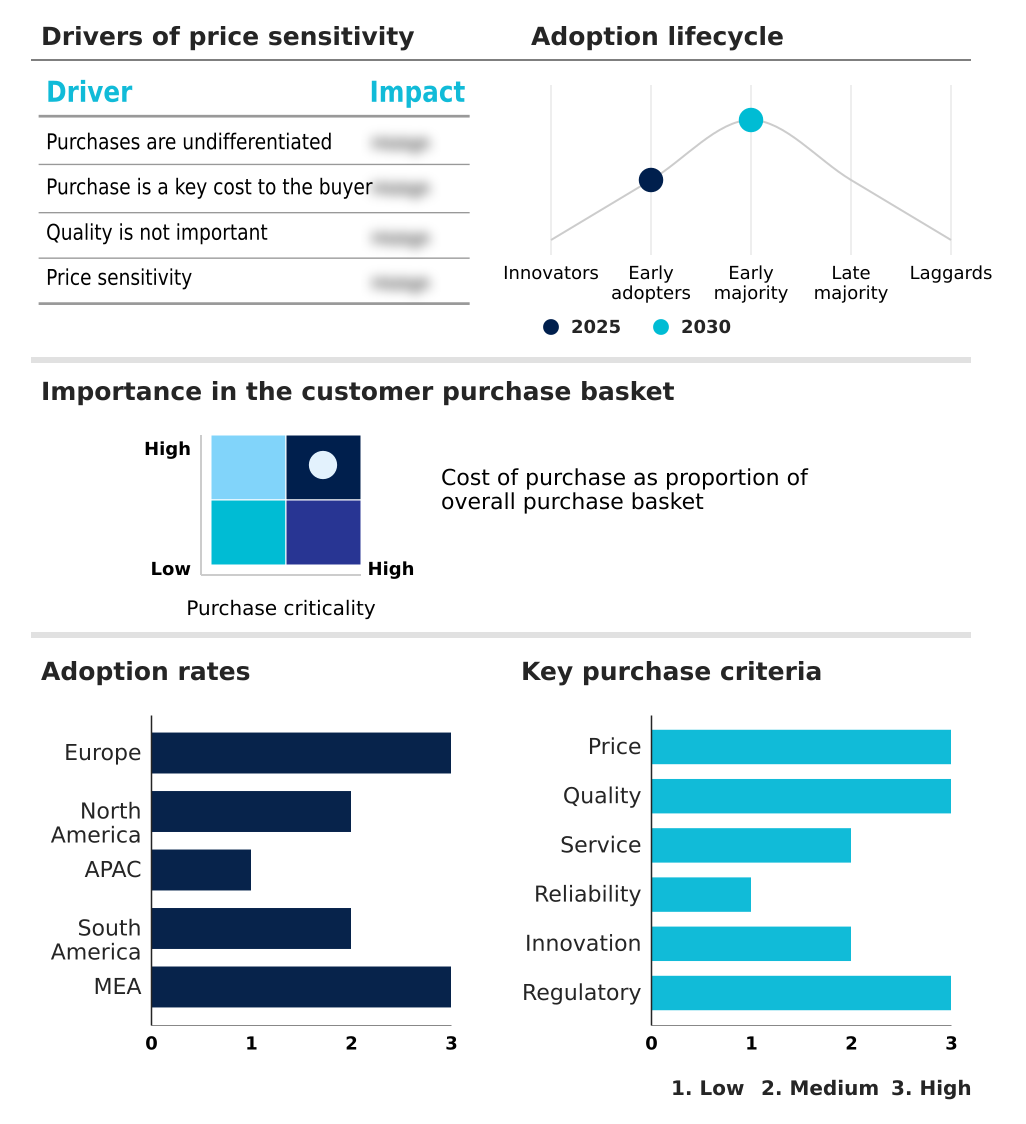
The apparel logistics market forecasting report includes the adoption lifecycle of the market, covering from the innovator’s stage to the laggard’s stage. It focuses on adoption rates in different regions based on penetration. Furthermore, the apparel logistics market report also includes key purchase criteria and drivers of price sensitivity to help companies evaluate and develop their market growth analysis strategies.

Customer Landscape of Apparel Logistics Industry

Competitive Landscape

Companies are implementing various strategies, such as strategic alliances, apparel logistics market forecast, partnerships, mergers and acquisitions, geographical expansion, and product/service launches, to enhance their presence in the industry.

Agility Public Warehousing Co. - Provides international-standard apparel logistics and warehousing solutions through global logistics parks, catering to multinational corporations, local markets, and small businesses.

The industry research and growth report includes detailed analyses of the competitive landscape of the market and information about key companies, including:

  • Agility Public Warehousing Co.
  • Apparel Logistic Group Inc.
  • Bollore SE
  • CMA CGM Group
  • Delhivery Ltd.
  • Deutsche Bahn AG
  • DSV AS
  • Expeditors International
  • Gulf Agency Co. Ltd.
  • Hellmann Worldwide Logistics
  • Kintetsu Group Holdings Ltd.
  • Kuehne Nagel Management AG
  • Logwin AG
  • NFI Industries Inc.
  • Nippon Express Holdings Inc.
  • PVS Fulfillment GmbH
  • Shipbob Inc.

Qualitative and quantitative analysis of companies has been conducted to help clients understand the wider business environment as well as the strengths and weaknesses of key industry players. Data is qualitatively analyzed to categorize companies as pure play, category-focused, industry-focused, and diversified; it is quantitatively analyzed to categorize companies as dominant, leading, strong, tentative, and weak.

Recent Development and News in Apparel logistics market

  • In February 2025, GXO Logistics expanded its partnership with sportswear brand Castore, taking over warehousing and transportation services across the UK, the US, and Europe to support the brand's global growth.
  • In February 2025, the Gemini Cooperation, a strategic alliance between Maersk and Hapag-Lloyd, commenced operations, introducing a hub-and-spoke network designed to achieve over 90% schedule reliability for ocean freight.
  • In April 2025, DSV AS completed its acquisition of DB Schenker from Deutsche Bahn AG, creating a logistics giant with expanded capabilities in global air and sea freight for apparel clients.
  • In April 2025, the European Commission adopted the ESPR Working Plan, which establishes strict sustainability and digital traceability requirements for textiles, mandating digital product passports for goods entering the EU.

Dive into Technavio’s robust research methodology, blending expert interviews, extensive data synthesis, and validated models for unparalleled Apparel Logistics Market insights. See full methodology.

Market Scope
Page number 289
Base year 2025
Historic period 2020-2024
Forecast period 2026-2030
Growth momentum & CAGR Accelerate at a CAGR of 7.1%
Market growth 2026-2030 USD 52348.1 million
Market structure Fragmented
YoY growth 2025-2026(%) 6.7%
Key countries Germany, UK, France, Italy, Spain, The Netherlands, US, Canada, Mexico, China, India, Japan, South Korea, Australia, Indonesia, Brazil, Argentina, Colombia, Saudi Arabia, UAE, South Africa, Turkey and Israel
Competitive landscape Leading Companies, Market Positioning of Companies, Competitive Strategies, and Industry Risks

Request Free Sample

Research Analyst Overview

  • The apparel logistics market is defined by its intricate operational demands, compelling providers to master both freight forwarding and customs brokerage to navigate global trade. A primary boardroom focus is the shift towards a sustainable supply chain, where the implementation of a digital product passport and green logistics solutions are becoming key investment criteria.
  • This is driven by both regulatory pressure and consumer demand. The rise of omnichannel retailing has made last-mile delivery and e-commerce fulfillment critical, with strategies like micro-fulfillment centers and digital freight matching optimizing urban distribution. Concurrently, supply chain visibility enabled by item-level RFID and real-time tracking is essential for managing the high volume of SKUs.
  • The industry grapples with a high rate of returns exceeding 30%, making efficient reverse logistics and circular economy logistics vital for profitability. Providers are leveraging automated sorting systems and advanced warehouse management platforms to handle this complexity.
  • Strategic sourcing trends, such as nearshoring logistics, are being adopted to shorten lead times, while specialized transport like garment-on-hanger (GOH) and sea-air combined transport cater to specific product needs. The use of bonded warehousing and proficient cross-docking further streamlines complex supply chains.

What are the Key Data Covered in this Apparel Logistics Market Research and Growth Report?

  • What is the expected growth of the Apparel Logistics Market between 2026 and 2030?

    • USD 52.35 billion, at a CAGR of 7.1%

  • What segmentation does the market report cover?

    • The report is segmented by Service Type (Transportation, Warehousing and distribution, and Others), Product (Pre-production, and Trade logistics), Mode of Transportation (Road, Air, Rail, and Water) and Geography (Europe, North America, APAC, South America, Middle East and Africa)

  • Which regions are analyzed in the report?

    • Europe, North America, APAC, South America and Middle East and Africa

  • What are the key growth drivers and market challenges?

    • Fast replenishment cycle in apparel industry, Variability in fuel prices

  • Who are the major players in the Apparel Logistics Market?

    • Agility Public Warehousing Co., Apparel Logistic Group Inc., Bollore SE, CMA CGM Group, Delhivery Ltd., Deutsche Bahn AG, DSV AS, Expeditors International, Gulf Agency Co. Ltd., Hellmann Worldwide Logistics, Kintetsu Group Holdings Ltd., Kuehne Nagel Management AG, Logwin AG, NFI Industries Inc., Nippon Express Holdings Inc., PVS Fulfillment GmbH and Shipbob Inc.

Market Research Insights

  • The apparel logistics market is characterized by intense pressure to enhance supply chain resilience and optimize the transportation network. A critical focus is on managing supply chain complexity driven by the proliferation of stock-keeping units and the demands of omnichannel sales.
  • Effective logistics network optimization has become paramount, with data showing that streamlined fulfillment operations can reduce last-mile delivery costs by up to 15%. Moreover, achieving high inventory accuracy, often reaching over 99% through advanced tracking technologies, is essential for supporting a profitable fast fashion supply chain.
  • As online returns frequently exceed 30% of sales, sophisticated returns processing is crucial for logistics cost management and maintaining a sustainable supply chain. These dynamics underscore the need for continuous innovation in last-mile innovation and distribution center automation.

We can help! Our analysts can customize this apparel logistics market research report to meet your requirements.

Get in touch

1. Executive Summary

1.1 Market overview

Executive Summary - Chart on Market Overview
Executive Summary - Data Table on Market Overview
Executive Summary - Chart on Global Market Characteristics
Executive Summary - Chart on Market by Geography
Executive Summary - Chart on Market Segmentation by Service Type
Executive Summary - Chart on Market Segmentation by Product
Executive Summary - Chart on Market Segmentation by Mode of Transportation
Executive Summary - Chart on Incremental Growth
Executive Summary - Data Table on Incremental Growth
Executive Summary - Chart on Company Market Positioning

2. Technavio Analysis

2.1 Analysis of price sensitivity, lifecycle, customer purchase basket, adoption rates, and purchase criteria

2.2 Criticality of inputs and Factors of differentiation

Chart on Overview on criticality of inputs and factors of differentiation

2.3 Factors of disruption

Chart on Overview on factors of disruption

2.4 Impact of drivers and challenges

Chart on Impact of drivers and challenges in 2025 and 2030

3. Market Landscape

3.1 Market ecosystem

Chart on Parent Market
Data Table on - Parent Market

3.2 Market characteristics

Chart on Market characteristics analysis

3.3 Value chain analysis

Chart on Value chain analysis

4. Market Sizing

4.1 Market definition

Data Table on Offerings of companies included in the market definition

4.2 Market segment analysis

Market segments

4.3 Market size 2025

4.4 Market outlook: Forecast for 2025-2030

Chart on Global - Market size and forecast 2025-2030 ($ million)
Data Table on Global - Market size and forecast 2025-2030 ($ million)
Chart on Global Market: Year-over-year growth 2025-2030 (%)
Data Table on Global Market: Year-over-year growth 2025-2030 (%)

5. Historic Market Size

5.1 Global Apparel Logistics Market 2020 - 2024

Historic Market Size - Data Table on Global Apparel Logistics Market 2020 - 2024 ($ million)

5.2 Service Type segment analysis 2020 - 2024

Historic Market Size - Service Type Segment 2020 - 2024 ($ million)

5.3 Product segment analysis 2020 - 2024

Historic Market Size - Product Segment 2020 - 2024 ($ million)

5.4 Mode of Transportation segment analysis 2020 - 2024

Historic Market Size - Mode of Transportation Segment 2020 - 2024 ($ million)

5.5 Geography segment analysis 2020 - 2024

Historic Market Size - Geography Segment 2020 - 2024 ($ million)

5.6 Country segment analysis 2020 - 2024

Historic Market Size - Country Segment 2020 - 2024 ($ million)

6. Qualitative Analysis

6.1 Impact of AI in global apparel logistics market

7. Five Forces Analysis

7.1 Five forces summary

Five forces analysis - Comparison between 2025 and 2030

7.2 Bargaining power of buyers

Bargaining power of buyers - Impact of key factors 2025 and 2030

7.3 Bargaining power of suppliers

Bargaining power of suppliers - Impact of key factors in 2025 and 2030

7.4 Threat of new entrants

Threat of new entrants - Impact of key factors in 2025 and 2030

7.5 Threat of substitutes

Threat of substitutes - Impact of key factors in 2025 and 2030

7.6 Threat of rivalry

Threat of rivalry - Impact of key factors in 2025 and 2030

7.7 Market condition

Chart on Market condition - Five forces 2025 and 2030

8. Market Segmentation by Service Type

8.1 Market segments

Chart on Service Type - Market share 2025-2030 (%)
Data Table on Service Type - Market share 2025-2030 (%)

8.2 Comparison by Service Type

Chart on Comparison by Service Type
Data Table on Comparison by Service Type

8.3 Transportation - Market size and forecast 2025-2030

Chart on Transportation - Market size and forecast 2025-2030 ($ million)
Data Table on Transportation - Market size and forecast 2025-2030 ($ million)
Chart on Transportation - Year-over-year growth 2025-2030 (%)
Data Table on Transportation - Year-over-year growth 2025-2030 (%)

8.4 Warehousing and distribution - Market size and forecast 2025-2030

Chart on Warehousing and distribution - Market size and forecast 2025-2030 ($ million)
Data Table on Warehousing and distribution - Market size and forecast 2025-2030 ($ million)
Chart on Warehousing and distribution - Year-over-year growth 2025-2030 (%)
Data Table on Warehousing and distribution - Year-over-year growth 2025-2030 (%)

8.5 Others - Market size and forecast 2025-2030

Chart on Others - Market size and forecast 2025-2030 ($ million)
Data Table on Others - Market size and forecast 2025-2030 ($ million)
Chart on Others - Year-over-year growth 2025-2030 (%)
Data Table on Others - Year-over-year growth 2025-2030 (%)

8.6 Market opportunity by Service Type

Market opportunity by Service Type ($ million)
Data Table on Market opportunity by Service Type ($ million)

9. Market Segmentation by Product

9.1 Market segments

Chart on Product - Market share 2025-2030 (%)
Data Table on Product - Market share 2025-2030 (%)

9.2 Comparison by Product

Chart on Comparison by Product
Data Table on Comparison by Product

9.3 Pre-production - Market size and forecast 2025-2030

Chart on Pre-production - Market size and forecast 2025-2030 ($ million)
Data Table on Pre-production - Market size and forecast 2025-2030 ($ million)
Chart on Pre-production - Year-over-year growth 2025-2030 (%)
Data Table on Pre-production - Year-over-year growth 2025-2030 (%)

9.4 Trade logistics - Market size and forecast 2025-2030

Chart on Trade logistics - Market size and forecast 2025-2030 ($ million)
Data Table on Trade logistics - Market size and forecast 2025-2030 ($ million)
Chart on Trade logistics - Year-over-year growth 2025-2030 (%)
Data Table on Trade logistics - Year-over-year growth 2025-2030 (%)

9.5 Market opportunity by Product

Market opportunity by Product ($ million)
Data Table on Market opportunity by Product ($ million)

10. Market Segmentation by Mode of Transportation

10.1 Market segments

Chart on Mode of Transportation - Market share 2025-2030 (%)
Data Table on Mode of Transportation - Market share 2025-2030 (%)

10.2 Comparison by Mode of Transportation

Chart on Comparison by Mode of Transportation
Data Table on Comparison by Mode of Transportation

10.3 Road - Market size and forecast 2025-2030

Chart on Road - Market size and forecast 2025-2030 ($ million)
Data Table on Road - Market size and forecast 2025-2030 ($ million)
Chart on Road - Year-over-year growth 2025-2030 (%)
Data Table on Road - Year-over-year growth 2025-2030 (%)

10.4 Air - Market size and forecast 2025-2030

Chart on Air - Market size and forecast 2025-2030 ($ million)
Data Table on Air - Market size and forecast 2025-2030 ($ million)
Chart on Air - Year-over-year growth 2025-2030 (%)
Data Table on Air - Year-over-year growth 2025-2030 (%)

10.5 Rail - Market size and forecast 2025-2030

Chart on Rail - Market size and forecast 2025-2030 ($ million)
Data Table on Rail - Market size and forecast 2025-2030 ($ million)
Chart on Rail - Year-over-year growth 2025-2030 (%)
Data Table on Rail - Year-over-year growth 2025-2030 (%)

10.6 Water - Market size and forecast 2025-2030

Chart on Water - Market size and forecast 2025-2030 ($ million)
Data Table on Water - Market size and forecast 2025-2030 ($ million)
Chart on Water - Year-over-year growth 2025-2030 (%)
Data Table on Water - Year-over-year growth 2025-2030 (%)

10.7 Market opportunity by Mode of Transportation

Market opportunity by Mode of Transportation ($ million)
Data Table on Market opportunity by Mode of Transportation ($ million)

11. Customer Landscape

11.1 Customer landscape overview

Analysis of price sensitivity, lifecycle, customer purchase basket, adoption rates, and purchase criteria

12. Geographic Landscape

12.1 Geographic segmentation

Chart on Market share by geography 2025-2030 (%)
Data Table on Market share by geography 2025-2030 (%)

12.2 Geographic comparison

Chart on Geographic comparison
Data Table on Geographic comparison

12.3 Europe - Market size and forecast 2025-2030

Chart on Europe - Market size and forecast 2025-2030 ($ million)
Data Table on Europe - Market size and forecast 2025-2030 ($ million)
Chart on Europe - Year-over-year growth 2025-2030 (%)
Data Table on Europe - Year-over-year growth 2025-2030 (%)
Chart on Regional Comparison - Europe
Data Table on Regional Comparison - Europe

12.3.1 Germany - Market size and forecast 2025-2030

Chart on Germany - Market size and forecast 2025-2030 ($ million)
Data Table on Germany - Market size and forecast 2025-2030 ($ million)
Chart on Germany - Year-over-year growth 2025-2030 (%)
Data Table on Germany - Year-over-year growth 2025-2030 (%)

12.3.2 UK - Market size and forecast 2025-2030

Chart on UK - Market size and forecast 2025-2030 ($ million)
Data Table on UK - Market size and forecast 2025-2030 ($ million)
Chart on UK - Year-over-year growth 2025-2030 (%)
Data Table on UK - Year-over-year growth 2025-2030 (%)

12.3.3 France - Market size and forecast 2025-2030

Chart on France - Market size and forecast 2025-2030 ($ million)
Data Table on France - Market size and forecast 2025-2030 ($ million)
Chart on France - Year-over-year growth 2025-2030 (%)
Data Table on France - Year-over-year growth 2025-2030 (%)

12.3.4 Italy - Market size and forecast 2025-2030

Chart on Italy - Market size and forecast 2025-2030 ($ million)
Data Table on Italy - Market size and forecast 2025-2030 ($ million)
Chart on Italy - Year-over-year growth 2025-2030 (%)
Data Table on Italy - Year-over-year growth 2025-2030 (%)

12.3.5 Spain - Market size and forecast 2025-2030

Chart on Spain - Market size and forecast 2025-2030 ($ million)
Data Table on Spain - Market size and forecast 2025-2030 ($ million)
Chart on Spain - Year-over-year growth 2025-2030 (%)
Data Table on Spain - Year-over-year growth 2025-2030 (%)

12.3.6 The Netherlands - Market size and forecast 2025-2030

Chart on The Netherlands - Market size and forecast 2025-2030 ($ million)
Data Table on The Netherlands - Market size and forecast 2025-2030 ($ million)
Chart on The Netherlands - Year-over-year growth 2025-2030 (%)
Data Table on The Netherlands - Year-over-year growth 2025-2030 (%)

12.4 North America - Market size and forecast 2025-2030

Chart on North America - Market size and forecast 2025-2030 ($ million)
Data Table on North America - Market size and forecast 2025-2030 ($ million)
Chart on North America - Year-over-year growth 2025-2030 (%)
Data Table on North America - Year-over-year growth 2025-2030 (%)
Chart on Regional Comparison - North America
Data Table on Regional Comparison - North America

12.4.1 US - Market size and forecast 2025-2030

Chart on US - Market size and forecast 2025-2030 ($ million)
Data Table on US - Market size and forecast 2025-2030 ($ million)
Chart on US - Year-over-year growth 2025-2030 (%)
Data Table on US - Year-over-year growth 2025-2030 (%)

12.4.2 Canada - Market size and forecast 2025-2030

Chart on Canada - Market size and forecast 2025-2030 ($ million)
Data Table on Canada - Market size and forecast 2025-2030 ($ million)
Chart on Canada - Year-over-year growth 2025-2030 (%)
Data Table on Canada - Year-over-year growth 2025-2030 (%)

12.4.3 Mexico - Market size and forecast 2025-2030

Chart on Mexico - Market size and forecast 2025-2030 ($ million)
Data Table on Mexico - Market size and forecast 2025-2030 ($ million)
Chart on Mexico - Year-over-year growth 2025-2030 (%)
Data Table on Mexico - Year-over-year growth 2025-2030 (%)

12.5 APAC - Market size and forecast 2025-2030

Chart on APAC - Market size and forecast 2025-2030 ($ million)
Data Table on APAC - Market size and forecast 2025-2030 ($ million)
Chart on APAC - Year-over-year growth 2025-2030 (%)
Data Table on APAC - Year-over-year growth 2025-2030 (%)
Chart on Regional Comparison - APAC
Data Table on Regional Comparison - APAC

12.5.1 China - Market size and forecast 2025-2030

Chart on China - Market size and forecast 2025-2030 ($ million)
Data Table on China - Market size and forecast 2025-2030 ($ million)
Chart on China - Year-over-year growth 2025-2030 (%)
Data Table on China - Year-over-year growth 2025-2030 (%)

12.5.2 India - Market size and forecast 2025-2030

Chart on India - Market size and forecast 2025-2030 ($ million)
Data Table on India - Market size and forecast 2025-2030 ($ million)
Chart on India - Year-over-year growth 2025-2030 (%)
Data Table on India - Year-over-year growth 2025-2030 (%)

12.5.3 Japan - Market size and forecast 2025-2030

Chart on Japan - Market size and forecast 2025-2030 ($ million)
Data Table on Japan - Market size and forecast 2025-2030 ($ million)
Chart on Japan - Year-over-year growth 2025-2030 (%)
Data Table on Japan - Year-over-year growth 2025-2030 (%)

12.5.4 South Korea - Market size and forecast 2025-2030

Chart on South Korea - Market size and forecast 2025-2030 ($ million)
Data Table on South Korea - Market size and forecast 2025-2030 ($ million)
Chart on South Korea - Year-over-year growth 2025-2030 (%)
Data Table on South Korea - Year-over-year growth 2025-2030 (%)

12.5.5 Australia - Market size and forecast 2025-2030

Chart on Australia - Market size and forecast 2025-2030 ($ million)
Data Table on Australia - Market size and forecast 2025-2030 ($ million)
Chart on Australia - Year-over-year growth 2025-2030 (%)
Data Table on Australia - Year-over-year growth 2025-2030 (%)

12.5.6 Indonesia - Market size and forecast 2025-2030

Chart on Indonesia - Market size and forecast 2025-2030 ($ million)
Data Table on Indonesia - Market size and forecast 2025-2030 ($ million)
Chart on Indonesia - Year-over-year growth 2025-2030 (%)
Data Table on Indonesia - Year-over-year growth 2025-2030 (%)

12.6 South America - Market size and forecast 2025-2030

Chart on South America - Market size and forecast 2025-2030 ($ million)
Data Table on South America - Market size and forecast 2025-2030 ($ million)
Chart on South America - Year-over-year growth 2025-2030 (%)
Data Table on South America - Year-over-year growth 2025-2030 (%)
Chart on Regional Comparison - South America
Data Table on Regional Comparison - South America

12.6.1 Brazil - Market size and forecast 2025-2030

Chart on Brazil - Market size and forecast 2025-2030 ($ million)
Data Table on Brazil - Market size and forecast 2025-2030 ($ million)
Chart on Brazil - Year-over-year growth 2025-2030 (%)
Data Table on Brazil - Year-over-year growth 2025-2030 (%)

12.6.2 Argentina - Market size and forecast 2025-2030

Chart on Argentina - Market size and forecast 2025-2030 ($ million)
Data Table on Argentina - Market size and forecast 2025-2030 ($ million)
Chart on Argentina - Year-over-year growth 2025-2030 (%)
Data Table on Argentina - Year-over-year growth 2025-2030 (%)

12.6.3 Colombia - Market size and forecast 2025-2030

Chart on Colombia - Market size and forecast 2025-2030 ($ million)
Data Table on Colombia - Market size and forecast 2025-2030 ($ million)
Chart on Colombia - Year-over-year growth 2025-2030 (%)
Data Table on Colombia - Year-over-year growth 2025-2030 (%)

12.7 Middle East and Africa - Market size and forecast 2025-2030

Chart on Middle East and Africa - Market size and forecast 2025-2030 ($ million)
Data Table on Middle East and Africa - Market size and forecast 2025-2030 ($ million)
Chart on Middle East and Africa - Year-over-year growth 2025-2030 (%)
Data Table on Middle East and Africa - Year-over-year growth 2025-2030 (%)
Chart on Regional Comparison - Middle East and Africa
Data Table on Regional Comparison - Middle East and Africa

12.7.1 Saudi Arabia - Market size and forecast 2025-2030

Chart on Saudi Arabia - Market size and forecast 2025-2030 ($ million)
Data Table on Saudi Arabia - Market size and forecast 2025-2030 ($ million)
Chart on Saudi Arabia - Year-over-year growth 2025-2030 (%)
Data Table on Saudi Arabia - Year-over-year growth 2025-2030 (%)

12.7.2 UAE - Market size and forecast 2025-2030

Chart on UAE - Market size and forecast 2025-2030 ($ million)
Data Table on UAE - Market size and forecast 2025-2030 ($ million)
Chart on UAE - Year-over-year growth 2025-2030 (%)
Data Table on UAE - Year-over-year growth 2025-2030 (%)

12.7.3 South Africa - Market size and forecast 2025-2030

Chart on South Africa - Market size and forecast 2025-2030 ($ million)
Data Table on South Africa - Market size and forecast 2025-2030 ($ million)
Chart on South Africa - Year-over-year growth 2025-2030 (%)
Data Table on South Africa - Year-over-year growth 2025-2030 (%)

12.7.4 Turkey - Market size and forecast 2025-2030

Chart on Turkey - Market size and forecast 2025-2030 ($ million)
Data Table on Turkey - Market size and forecast 2025-2030 ($ million)
Chart on Turkey - Year-over-year growth 2025-2030 (%)
Data Table on Turkey - Year-over-year growth 2025-2030 (%)

12.7.5 Israel - Market size and forecast 2025-2030

Chart on Israel - Market size and forecast 2025-2030 ($ million)
Data Table on Israel - Market size and forecast 2025-2030 ($ million)
Chart on Israel - Year-over-year growth 2025-2030 (%)
Data Table on Israel - Year-over-year growth 2025-2030 (%)

12.8 Market opportunity by geography

Market opportunity by geography ($ million)
Data Tables on Market opportunity by geography ($ million)

13. Drivers, Challenges, and Opportunity

13.1 Market drivers

Fast replenishment cycle in apparel industry
Growing adoption of omni channel retailing
Expansion of automation technologies in warehousing

13.2 Market challenges

Variability in fuel prices
Volatile nature of apparel industry
Complexities within global supply chain

13.3 Impact of drivers and challenges

Impact of drivers and challenges in 2025 and 2030

13.4 Market opportunities

Growing adoption of RFID tags in apparel industry
Increasing product returns for apparel goods
Increasing demand for less-than-truckload transportation in apparel industry

14. Competitive Landscape

14.1 Overview

14.2

Overview on criticality of inputs and factors of differentiation

14.3 Landscape disruption

Overview on factors of disruption

14.4 Industry risks

Impact of key risks on business

15. Competitive Analysis

15.1 Companies profiled

Companies covered

15.2 Company ranking index

15.3 Market positioning of companies

Matrix on companies position and classification

15.4 Agility Public Warehousing Co.

Agility Public Warehousing Co. - Overview
Agility Public Warehousing Co. - Business segments
Agility Public Warehousing Co. - Key offerings
Agility Public Warehousing Co. - Segment focus
SWOT

15.5 Apparel Logistic Group Inc.

Apparel Logistic Group Inc. - Overview
Apparel Logistic Group Inc. - Product / Service
Apparel Logistic Group Inc. - Key offerings
SWOT

15.6 Bollore SE

Bollore SE - Overview
Bollore SE - Business segments
Bollore SE - Key offerings
Bollore SE - Segment focus
SWOT

15.7 CMA CGM Group

CMA CGM Group - Overview
CMA CGM Group - Product / Service
CMA CGM Group - Key news
CMA CGM Group - Key offerings
SWOT

15.8 Delhivery Ltd.

Delhivery Ltd. - Overview
Delhivery Ltd. - Business segments
Delhivery Ltd. - Key offerings
Delhivery Ltd. - Segment focus
SWOT

15.9 Deutsche Bahn AG

Deutsche Bahn AG - Overview
Deutsche Bahn AG - Product / Service
Deutsche Bahn AG - Key offerings
SWOT

15.10 DSV AS

DSV AS - Overview
DSV AS - Business segments
DSV AS - Key offerings
DSV AS - Segment focus
SWOT

15.11 Expeditors International

Expeditors International - Overview
Expeditors International - Business segments
Expeditors International - Key offerings
Expeditors International - Segment focus
SWOT

15.12 Gulf Agency Co. Ltd.

Gulf Agency Co. Ltd. - Overview
Gulf Agency Co. Ltd. - Product / Service
Gulf Agency Co. Ltd. - Key offerings
SWOT

15.13 Hellmann Worldwide Logistics

Hellmann Worldwide Logistics - Overview
Hellmann Worldwide Logistics - Product / Service
Hellmann Worldwide Logistics - Key offerings
SWOT

15.14 Kintetsu Group Holdings Ltd.

Kintetsu Group Holdings Ltd. - Overview
Kintetsu Group Holdings Ltd. - Product / Service
Kintetsu Group Holdings Ltd. - Key offerings
SWOT

15.15 Kuehne Nagel Management AG

Kuehne Nagel Management AG - Overview
Kuehne Nagel Management AG - Business segments
Kuehne Nagel Management AG - Key news
Kuehne Nagel Management AG - Key offerings
Kuehne Nagel Management AG - Segment focus
SWOT

15.16 Logwin AG

Logwin AG - Overview
Logwin AG - Product / Service
Logwin AG - Key offerings
SWOT

15.17 NFI Industries Inc.

NFI Industries Inc. - Overview
NFI Industries Inc. - Product / Service
NFI Industries Inc. - Key offerings
SWOT

15.18 Nippon Express Holdings Inc.

Nippon Express Holdings Inc. - Overview
Nippon Express Holdings Inc. - Business segments
Nippon Express Holdings Inc. - Key news
Nippon Express Holdings Inc. - Key offerings
Nippon Express Holdings Inc. - Segment focus
SWOT

16. Appendix

16.1 Scope of the report

Market definition
Objectives
Notes and caveats

16.2 Inclusions and exclusions checklist

Inclusions checklist
Exclusions checklist

16.3 Currency conversion rates for US$

16.4 Research methodology

16.5 Data procurement

Information sources

16.6 Data validation

16.7 Validation techniques employed for market sizing

16.8 Data synthesis

16.9 360 degree market analysis

16.10 List of abbreviations

Research Methodology

Technavio presents a detailed picture of the market by way of study, synthesis, and summation of data from multiple sources. The analysts have presented the various facets of the market with a particular focus on identifying the key industry influencers. The data thus presented is comprehensive, reliable, and the result of extensive research, both primary and secondary.

INFORMATION SOURCES

Primary sources

  • Manufacturers and suppliers
  • Channel partners
  • Industry experts
  • Strategic decision makers

Secondary sources

  • Industry journals and periodicals
  • Government data
  • Financial reports of key industry players
  • Historical data
  • Press releases

DATA ANALYSIS

Data Synthesis

  • Collation of data
  • Estimation of key figures
  • Analysis of derived insights

Data Validation

  • Triangulation with data models
  • Reference against proprietary databases
  • Corroboration with industry experts

REPORT WRITING

Qualitative

  • Market drivers
  • Market challenges
  • Market trends
  • Five forces analysis

Quantitative

  • Market size and forecast
  • Market segmentation
  • Geographical insights
  • Competitive landscape

Interested in this report?

Get your sample now to see our research methodology and insights!

Download Now

Frequently Asked Questions

Apparel Logistics market growth will increase by USD 52348.1 million during 2026-2030 .

The Apparel Logistics market is expected to grow at a CAGR of 7.1% during 2026-2030 .

Apparel Logistics market is segmented by Service type (Transportation, Warehousing and distribution, Others) Product (Pre-production, Trade logistics) Mode of transportation (Road, Air, Rail, Water)

Agility Public Warehousing Co., Apparel Logistic Group Inc., Bollore SE, CMA CGM Group, Delhivery Ltd., Deutsche Bahn AG, DSV AS, Expeditors International, Gulf Agency Co. Ltd., Hellmann Worldwide Logistics, Kintetsu Group Holdings Ltd., Kuehne Nagel Management AG, Logwin AG, NFI Industries Inc., Nippon Express Holdings Inc., PVS Fulfillment GmbH, Shipbob Inc. are a few of the key vendors in the Apparel Logistics market.

Europe will register the highest growth rate of 35.3% among the other regions. Therefore, the Apparel Logistics market in Europe is expected to garner significant business opportunities for the vendors during the forecast period.

Germany, UK, France, Italy, Spain, The Netherlands, US, Canada, Mexico, China, India, Japan, South Korea, Australia, Indonesia, Brazil, Argentina, Colombia, Saudi Arabia, UAE, South Africa, Turkey, Israel

  • Fast replenishment cycle in apparel industry is the driving factor this market.

The Apparel Logistics market vendors should focus on grabbing business opportunities from the Service type segment as it accounted for the largest market share in the base year.