
Architectural Services Market Size 2025-2029
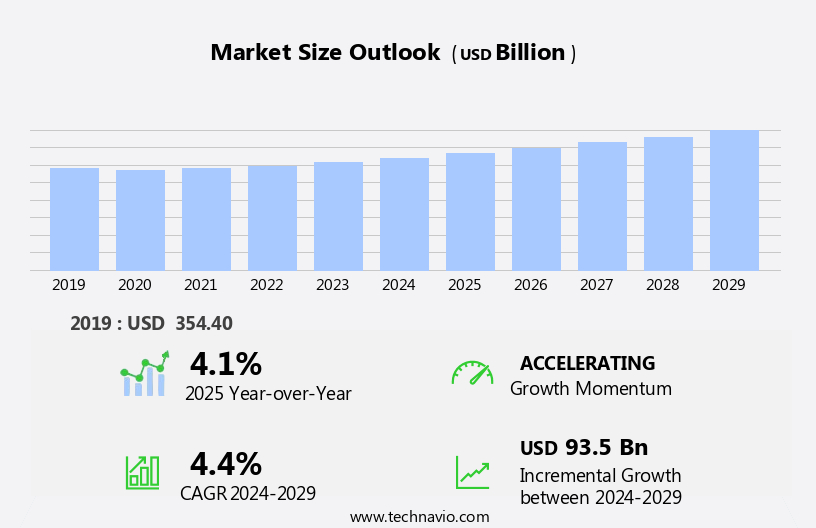
The architectural services market size is forecast to increase by USD 93.5 billion at a CAGR of 4.4% between 2024 and 2029.
- The market is experiencing significant growth, driven primarily by the expansion of the global construction industry. This sector's continued expansion is fueled by increasing infrastructure development, urbanization, and rising demand for sustainable and energy-efficient buildings. Another key driver is the growing prevalence of Building Information Modeling (BIM), a digital tool that streamlines design and construction processes, enhances collaboration, and reduces errors. However, the market faces challenges due to economic volatility and uncertainty in the construction industry. Fluctuating commodity prices, regulatory changes, and geopolitical risks can impact project timelines and budgets. To capitalize on market opportunities and navigate these challenges effectively, companies must stay informed of industry trends and adapt to evolving client needs. Strategic partnerships, innovation, and operational efficiency are essential to remaining competitive in this dynamic market.
What will be the Size of the Architectural Services Market during the forecast period?
- The market encompasses a range of professional services involved in the design and planning of construction projects. This market is driven by various factors, including urbanization and the increasing demand for infrastructure development in both developed and developing nations. Architectural services span from urban planning and feasibility studies to architectural programming, project management, construction documentation, and sustainable construction. The market's size is significant, with continuous growth attributed to the increasing focus on patient care, patient outcomes, and patient satisfaction in the healthcare sector.
- Building space optimization, feasibility studies, and project management services are essential components of the market, ensuring the financial potential and return on investment for construction projects. The integration of computer software and fundamental bioclimatic design principles further enhances the market's value proposition, contributing to operational cost savings and sustainable construction practices.
How is this Architectural Services Industry segmented?
The architectural services industry research report provides comprehensive data (region-wise segment analysis), with forecasts and estimates in "USD billion" for the period 2025-2029, as well as historical data from 2019-2023 for the following segments.
- End-user
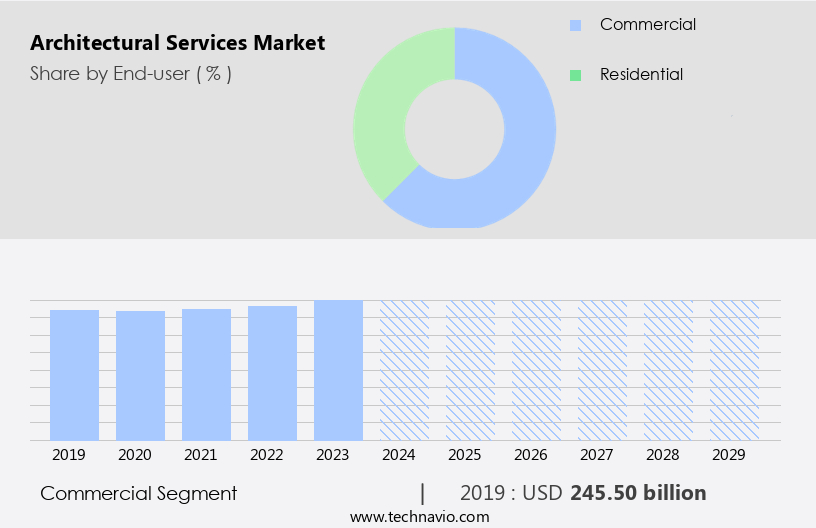
- Commercial
- Residential
- Type
- Construction and project management
- Engineering and interior designing
- Urban planning
- Architectural advisory services
- Others
- Application
- New construction
- Renovation and remodeling
- Restoration and conservation
- Geography
- North America
- US
- Canada
- Europe
- France
- Germany
- UK
- APAC
- China
- India
- Japan
- South Korea
- Middle East and Africa
- South America
- Brazil
- North America
By End-user Insights
The commercial segment is estimated to witness significant growth during the forecast period. The market caters to the demand for innovative and efficient design solutions in the commercial sector. Urbanization, population growth, and economic expansion are key drivers fueling this market. Commercial structures, such as hotels, restaurants, retail outlets, and office buildings, require specialized architectural services to meet their unique needs. Leading firms like AECOM and HOK offer project management, urban planning, interior design, and construction documentation services to cater to this market. The adoption of advanced design technologies, such as VR technology, CAD software, and 3D printing technology, is transforming the architectural landscape. Sustainable buildings, green buildings, and eco-friendly amenities are becoming increasingly popular, driven by environmental regulations and customer demand. The residential sector also presents significant growth opportunities, with a focus on affordable housing, custom residences, and luxury apartments. Reliable suppliers and service providers are essential in ensuring the success of architectural projects, particularly in the context of rapid infrastructure development and updated design technologies.
Get a glance at the market report of share of various segments Request Free Sample
The commercial segment was valued at USD 245.50 billion in 2019 and showed a gradual increase during the forecast period.
Regional Analysis
North America is estimated to contribute 47% to the growth of the global market during the forecast period. Technavio's analysts have elaborately explained the regional trends and drivers that shape the market during the forecast period.

For more insights on the market size of various regions, Request Free Sample
The North American market is a significant global market, driven by the region's early adoption of advanced technologies and the mature construction industry. The industry's technological maturity is evident in sectors such as oil and gas, manufacturing, building, and mining. The presence of leading companies in the region contributes to market growth. Urbanization and infrastructure development are accelerating in North America, fueled by its advanced and developing economies. In the architectural services sector, this translates to increased demand for project management services, urban planning, and sustainable building designs. The market also caters to various end-user segments, including healthcare, hospitality, and education.
Market Dynamics
Our researchers analyzed the data with 2024 as the base year, along with the key drivers, trends, and challenges. A holistic analysis of drivers will help companies refine their marketing strategies to gain a competitive advantage.
What are the key market drivers leading to the rise in the adoption of Architectural Services Industry?
- Growth of global construction industry is the key driver of the market. The global construction industry is undergoing significant transformations, with developed economies, such as the US and the UK, addressing the issue of aging infrastructure. This trend is driving the construction market, as maintenance and restoration operations become a priority, and sustainable building development and retrofitting practices gain traction. Additionally, the global economy's overall growth is providing a strong foundation for market expansion.
- The construction industry's evolution presents substantial opportunities for the market. Factors such as increasing government investments, population growth, and economic advancements in developing countries have contributed to market growth. Green and sustainable building developments have also spurred substantial investments and technological innovations. The market is poised to benefit from these industry shifts.
What are the market trends shaping the Architectural Services Industry?
- Growing prevalence of Building Information Modeling (BIM) is the upcoming market trend. The market has witnessed significant growth due to the adoption of Building Information Modeling (BIM) technology. BIM allows architects to create 3D models of buildings and structures, facilitating communication and collaboration among stakeholders, including architects, engineers, contractors, and clients.
- This technology has become essential for managing construction projects and promoting teamwork, especially as more firms and project stakeholders work remotely. For instance, the New Santiago Bernabeu Stadium in Spain underwent a major renovation in 2024, employing BIM in conjunction with digital twin technology to streamline the project and enhance cooperation among team members. The implementation of BIM has led to improved project outcomes, increased efficiency, and better communication, making it an indispensable tool in the architectural services sector.
What challenges does the Architectural Services Industry face during its growth?
- Economic volatility and uncertainty in construction industry is a key challenge affecting the industry growth. The market faces challenges from economic instability and uncertainty. Fluctuations in demand and project cancellations can negatively impact architectural firms' revenue, profitability, and future business prospects. Geopolitical tensions, such as those in Ukraine, the Middle East, and Sudan, can significantly disrupt economies and decrease the demand for architectural services and construction activity. These disruptions can lead to postponed or canceled projects for architectural firms.
- Economic instability, including political instability, financial crises, or trade tensions, can also influence the demand for architectural services in various regions. These economic challenges can create uncertainty and volatility in the market, making it essential for firms to adapt and navigate these complexities to remain competitive.
Exclusive Customer Landscape
The architectural services market forecasting report includes the adoption lifecycle of the market, covering from the innovator's stage to the laggard's stage. It focuses on adoption rates in different regions based on penetration. Furthermore, the architectural services market report also includes key purchase criteria and drivers of price sensitivity to help companies evaluate and develop their market growth analysis strategies.
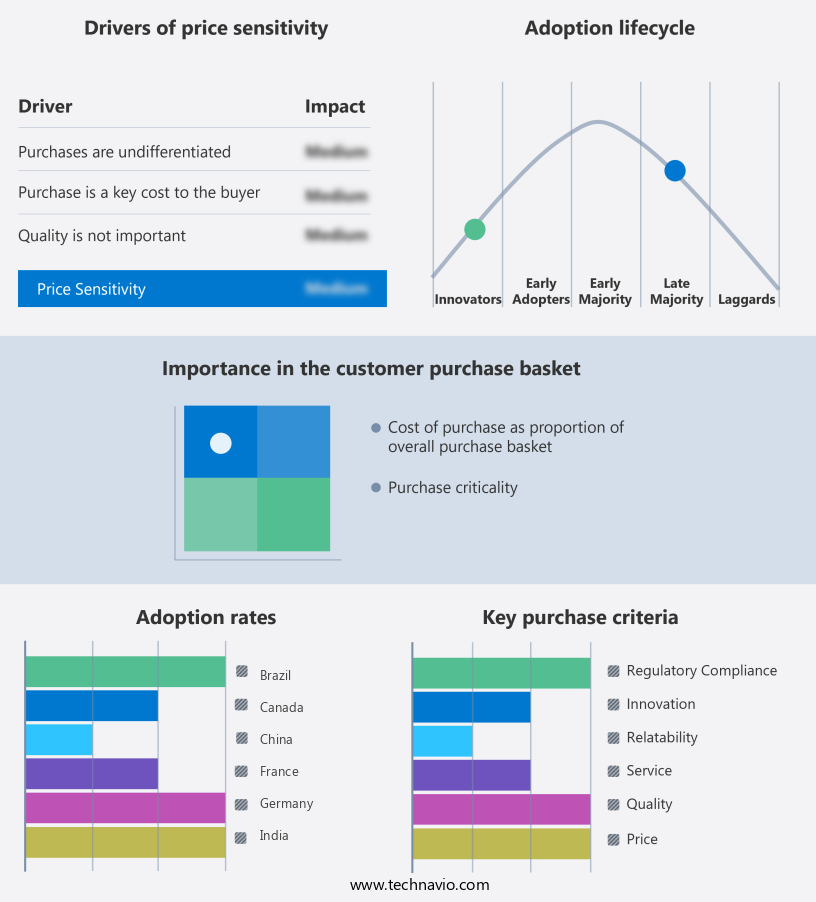
Customer Landscape
Key Companies & Market Insights
Companies are implementing various strategies, such as strategic alliances, architectural services market forecast, partnerships, mergers and acquisitions, geographical expansion, and product/service launches, to enhance their presence in the industry.
AECOM - The company offers architectural services such as planning, programming, and design of office buildings.
The industry research and growth report includes detailed analyses of the competitive landscape of the market and information about key companies, including:
- Aedas Ltd.
- Arcadis NV
- Arup Group Ltd.
- C.F. Moller Danmark AS
- Dar Al Handasah Consultants Shair and Partners Holdings Ltd.
- DP Architects Pte Ltd.
- Foster and Partners Group Ltd.
- Gensler. M. Arthur Gensler Jr. and Associates Inc.
- HDR Inc.
- HKS Inc.
- HOK Group Inc.
- Jacobs Solutions Inc.
- NIKKEN SEKKEI Ltd.
- Perkins Eastman
- SAS AREP
- Scott Brownrigg
- Stantec Inc.
- Surbana Jurong Pvt. Ltd.
- The Jerde Partnership Inc.
Qualitative and quantitative analysis of companies has been conducted to help clients understand the wider business environment as well as the strengths and weaknesses of key industry players. Data is qualitatively analyzed to categorize companies as pure play, category-focused, industry-focused, and diversified; it is quantitatively analyzed to categorize companies as dominant, leading, strong, tentative, and weak.
Research Analyst Overview
The market continues to experience significant growth as urbanization expands in developing nations. This trend is driven by the increasing demand for project management services, urban planning, and the construction of various building types, including residential buildings, commercial complexes, transportation hubs, and civic infrastructure. The patient care sector is another key area where architectural services are in high demand. The focus on patient outcomes and satisfaction has led to a greater emphasis on building space design and interior design, as well as the integration of technology such as VR technology and virtual reality in hospitality and healthcare facilities.
In addition, the construction industry is undergoing a paradigm change with the adoption of advanced design technology, such as CAD software and 3D printing technology. Sustainable buildings and green buildings are becoming increasingly popular, with a focus on sustainable construction, building codes, and eco-friendly procedures. The industrial segment is also witnessing an increase in new factory establishments, with a growing need for architectural advisory services to ensure efficient and cost-effective design and construction. The education segment is another area of growth, with a focus on natural light, feasibility studies, architectural programming, and project management. The technology environment is playing a crucial role in the market, with the use of digital design tools, computer controlled fabrication, and connectivity and interconnectedness becoming increasingly important.
Moreover, the nature of technology is also leading to a shift towards rapid infrastructure development and updated design technologies. Architectural firms are forming strategic partnerships to stay competitive and meet the diverse needs of their customer base. The use of 3D models and augmented reality is becoming more common in the design process, allowing for more accurate and efficient space planning and homeownership solutions. The rising population expansion and increasing disposable income in both rural and urban areas are driving the demand for affordable housing, with a focus on practical floor plans, eco-friendly amenities, and reliable suppliers and service providers.
Furthermore, custom residences and luxury apartments are also in high demand, with technological developments and lifestyle needs influencing the design of these structures. The use of advanced design technology and sustainable structures is becoming increasingly important in the face of environmental regulations and local competition. Material compositions and supply chains are being reevaluated to reduce energy consumption and operating costs, making buildings more healthier and efficient.
|
Market Scope |
|
|
Report Coverage |
Details |
|
Page number |
210 |
|
Base year |
2024 |
|
Historic period |
2019-2023 |
|
Forecast period |
2025-2029 |
|
Growth momentum & CAGR |
Accelerate at a CAGR of 4.4% |
|
Market growth 2025-2029 |
USD 93.5 billion |
|
Market structure |
Fragmented |
|
YoY growth 2024-2025(%) |
4.1 |
|
Key countries |
US, China, Canada, Germany, UK, France, India, Brazil, Japan, South Korea, |
|
Competitive landscape |
Leading Companies, market growth and forecasting, Market Positioning of Companies, Competitive Strategies, and Industry Risks |
What are the Key Data Covered in this Architectural Services Market Research and Growth Report?
- CAGR of the Architectural Services industry during the forecast period
- Detailed information on factors that will drive the growth and forecasting between 2025 and 2029
- Precise estimation of the size of the market and its contribution of the industry in focus to the parent market
- Accurate predictions about upcoming growth and trends and changes in consumer behaviour
- Growth of the market across North America, Europe, APAC, Middle East and Africa, South America,
- Thorough analysis of the market's competitive landscape and detailed information about companies
- Comprehensive analysis of factors that will challenge the architectural services market growth of industry companies
We can help! Our analysts can customize this architectural services market research report to meet your requirements.
 RIA -
RIA - 
