
Computer Market Size 2024-2028
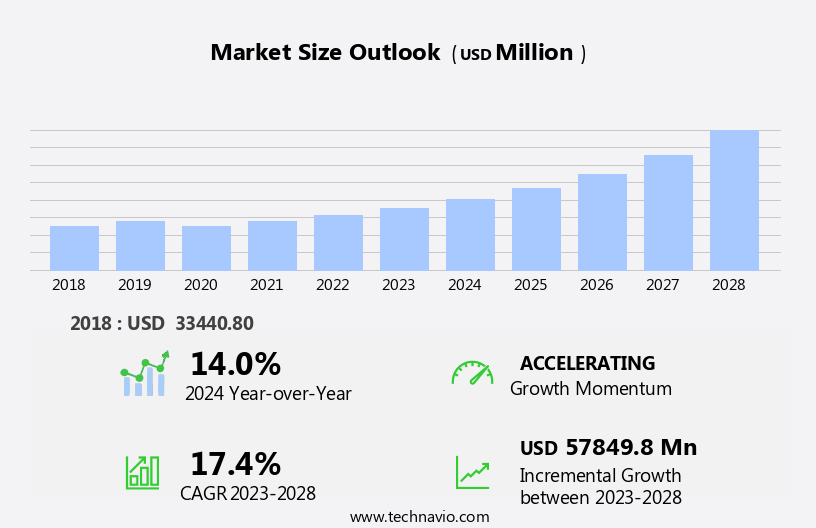
The computer market size is forecast to increase by USD 57.85 billion, at a CAGR of 17.4% between 2023 and 2028.
- The market is witnessing significant shifts driven by the increasing adoption of laptops in educational institutions and the rapid penetration of Internet-enabled devices. This trend is transforming the way education is delivered and received, creating a vast opportunity for market players. Simultaneously, the tendency to buy devices with low configuration presents both a challenge and an opportunity. On one hand, it puts pressure on prices and forces companies to innovate and offer affordable solutions. On the other hand, it opens up a large customer base seeking cost-effective devices.
- Companies that can balance affordability with performance and offer value-added services will likely gain a competitive edge. The market's dynamics are shaped by these factors, requiring strategic planning and agility from market participants. To capitalize on opportunities and navigate challenges effectively, companies must stay informed about the evolving needs of their customer base and adapt accordingly.
What will be the Size of the Computer Market during the forecast period?
Explore in-depth regional segment analysis with market size data - historical 2018-2022 and forecasts 2024-2028 - in the full report.
Request Free Sample
The market continues to evolve, with dynamic market dynamics shaping the industry across various sectors. Performance metrics, such as power supplies and graphics processing, play a crucial role in driving product development. Customer service and data security are paramount in ensuring customer satisfaction and brand loyalty. Operating systems and virtual reality are revolutionizing user experiences, while machine learning and data centers facilitate advanced data analytics. Power supplies and cooling systems are essential components, with energy efficiency and machine learning technologies optimizing performance. Product development is ongoing, with a focus on enhancing processor speed, screen resolution, and memory capacity. Data centers and cloud computing are transforming the way businesses operate, with remote work and the Internet of Things driving demand.
Customer service and technical support are critical in addressing repair costs and software compatibility issues. Security software and data storage solutions are integral to maintaining data security. Wireless technologies and cloud storage offer convenience and flexibility, while component availability and operating system support are essential for seamless integration. The market's continuous dynamism is evident in the emergence of artificial intelligence, augmented reality, and facial recognition technologies. Data analytics and digital transformation are reshaping industries, with supply chain management and digital workflows streamlining operations. The market's evolution is ongoing, with new innovations and applications constantly unfolding.
How is this Computer Industry segmented?
The computer industry research report provides comprehensive data (region-wise segment analysis), with forecasts and estimates in "USD million" for the period 2024-2028, as well as historical data from 2018-2022 for the following segments.
- Product
- Laptop
- Desktop
- Geography
- North America
- US
- Canada
- Europe
- France
- Germany
- Italy
- UK
- APAC
- China
- India
- Japan
- South Korea
- Rest of World (ROW)
- North America
By Product Insights
The laptop segment is estimated to witness significant growth during the forecast period.
In the dynamic the market, laptops, as compact personal computers, continue to gain popularity due to their mobility and versatility. Equipped with high-performance processors, these devices cater to diverse uses such as work, education, multimedia consumption, and gaming. Power supplies ensure uninterrupted usage, while product development introduces new features like longer battery life and enhanced graphics processing. Customer service and technical support address user queries and issues, ensuring a harmonious user experience. Data centers and cloud computing facilitate remote work and collaboration, while data security measures protect sensitive information. Operating systems offer compatibility with various software applications, and machine learning algorithms enhance user experience.
Virtual reality and augmented reality technologies offer immersive experiences, while data analytics provides valuable insights. Storage capacity and memory capacity are crucial factors, with cloud storage and wireless technologies enabling seamless data access. Energy efficiency is a significant concern, with cooling systems ensuring optimal performance. Repair costs and component availability impact the total cost of ownership. Security software and data storage solutions safeguard valuable information, while software compatibility and operating system support ensure seamless integration of applications. The Internet of Things and digital transformation continue to influence the market, with facial recognition and artificial intelligence technologies enhancing user experience. Brands prioritize customer satisfaction and brand loyalty, offering after-sales services and warranties.
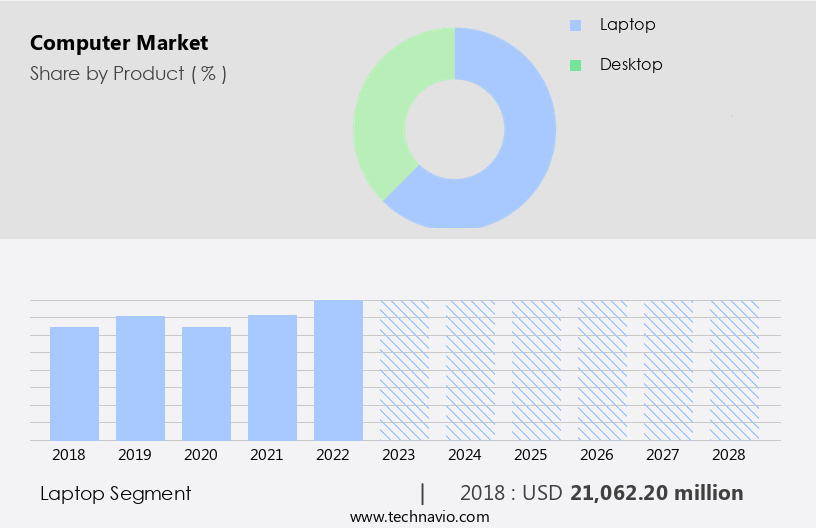
The Laptop segment was valued at USD 21.06 billion in 2018 and showed a gradual increase during the forecast period.
Regional Analysis
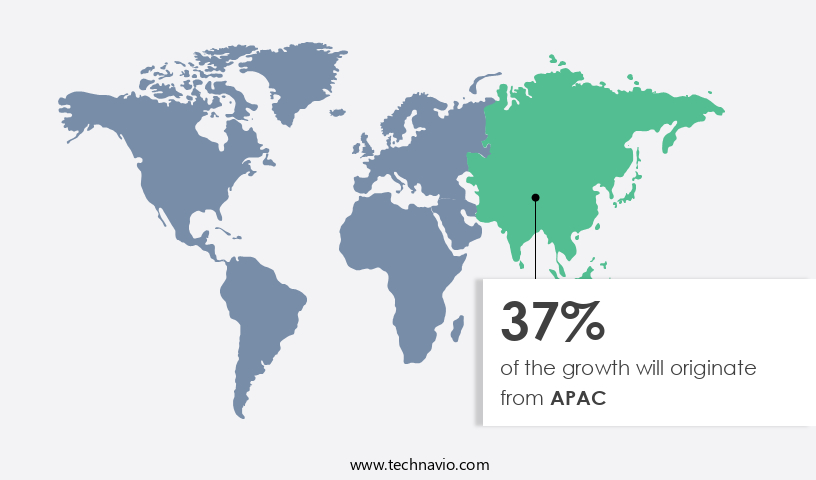
APAC is estimated to contribute 37% to the growth of the global market during the forecast period.Technavio’s analysts have elaborately explained the regional trends and drivers that shape the market during the forecast period.
The market experienced significant growth in 2023, with the APAC region holding a substantial market share. Major players, including HP, Dell Technologies, and Lenovo, continued to dominate sales in countries like India. Acer, recognizing the potential in the gaming market, targeted casual gamers to boost revenue. The demand for computers in sectors such as healthcare, education, entertainment, and others drove market expansion. Small and medium-sized enterprises (SMEs) also contributed to growth due to regulatory requirements, like the Goods and Services Tax (GST), necessitating precise transaction records. To cater to this need, Acer collaborated with Tally to ensure their devices supported GST-related computations.
Advancements in performance metrics, power supplies, and product development continued to enhance computer capabilities. Graphics processing and cooling systems improved gaming and multimedia experiences. Machine learning and artificial intelligence enabled more efficient and intelligent computing. Data centers and data security became increasingly important, with operating systems and software compatibility ensuring seamless integration. Virtual reality, augmented reality, and remote work expanded the market's reach. Energy efficiency, battery life, and repair costs remained key concerns for consumers. Security software, data storage, and data analytics were essential for businesses. Memory capacity, internet of things, and digital transformation shaped the future of computing.
Cloud computing, supply chain management, facial recognition, customer satisfaction, brand loyalty, component availability, and operating system support were other significant trends. Wireless technologies and screen resolution further enhanced user experience.
Market Dynamics
Our researchers analyzed the data with 2023 as the base year, along with the key drivers, trends, and challenges. A holistic analysis of drivers will help companies refine their marketing strategies to gain a competitive advantage.
In the dynamic and ever-evolving the market, consumers seek the latest innovations in technology to enhance their digital experiences. From powerful desktops to sleek laptops, the market caters to various user needs. Graphics cards and processors are crucial components, delivering stunning visuals and swift performance. Operating systems, such as Windows and macOS, provide the foundation for seamless computing. RAM and storage capacities expand functionality, while monitors and keyboards offer ergonomic comfort. Wireless connectivity, including Wi-Fi and Bluetooth, ensure uninterrupted communication. Peripherals, like printers and scanners, expand a computer's capabilities. Software solutions, like productivity suites and security programs, optimize usage and safeguard data. The market is a vibrant ecosystem, continuously adapting to consumer demands and technological advancements.
What are the key market drivers leading to the rise in the adoption of Computer Industry?
- The growing prevalence of laptops in educational settings serves as the primary catalyst for market expansion in this sector.
- The market is experiencing significant growth due to various factors that are driving demand for technology solutions. One key trend is the increasing adoption of laptops in educational institutions, as they offer cost-effective, wireless, and convenient solutions for students. Laptops enable students to take notes, collaborate with peers, and access a range of writing and editing tools, making learning more interactive and efficient. Furthermore, the rise of cloud computing and virtual technologies is allowing students to access online courses from anywhere, at any time, enhancing their educational experience. Moreover, businesses are undergoing digital transformation, integrating technology into their operations to improve efficiency and productivity.
- Operating system support for the latest software and component availability are crucial for businesses in this regard. Facial recognition technology, for instance, is increasingly being used for supply chain management and customer satisfaction purposes, adding value to businesses. Brand loyalty is another factor influencing the market's growth, as consumers continue to prefer established brands for their reliability and quality. The market is expected to continue its upward trajectory, as technology continues to evolve and become more integrated into our daily lives.
What are the market trends shaping the Computer Industry?
- The trend in the market is toward rapid penetration of Internet-enabled devices. This includes the increasing use of smartphones, tablets, laptops, and other connected devices.
- The market is experiencing significant growth due to the increasing demand for advanced technology in various sectors. Performance metrics, such as power supplies, graphics processing, and cooling systems, are becoming increasingly important as users seek improved system efficiency and productivity. Product development in machine learning and data centers is driving innovation, with companies focusing on enhancing data security and storage speed to meet customer needs. Digital content providers are partnering with computer companies to offer pre-loaded applications and content, catering to the growing preference for customized learning and accessibility. The shift from traditional textbooks to digital content is accelerating, with learners and educational institutions benefiting from lower costs and increased convenience.
- In the realm of data centers, there is a heightened focus on power efficiency, as the demand for cloud services continues to surge. Cooling systems are also being optimized to ensure optimal performance and reliability. As machine learning applications become more prevalent, there is a growing need for robust and efficient power supplies to support the increased computational requirements. Data security remains a top priority, with companies investing in advanced encryption and authentication technologies to protect sensitive information. The integration of machine learning algorithms into data security systems is expected to further enhance their capabilities and improve overall system performance.
- In summary, the market is witnessing dynamic growth, driven by the need for improved performance, advanced features, and increased security in various applications. companies are responding to these demands by investing in product development, partnerships, and innovation to meet the evolving needs of their customers.
What challenges does the Computer Industry face during its growth?
- The propensity for consumers to purchase low-configuration devices poses a significant challenge to the industry's growth trajectory.
- The market is experiencing significant advancements, driven by the integration of innovative technologies such as artificial intelligence, virtual reality, and high-definition operating systems. These developments offer immersive and harmonious user experiences, emphasizing the importance of processor speed, screen resolution, and energy efficiency. However, the increasing complexity of education software poses challenges for users, necessitating updated hardware solutions. This issue results in older devices becoming incompatible with new software updates, leading some users to opt for lower-configuration computers. Consequently, the market growth may be hindered due to the premature obsolescence of devices.
- Additionally, wireless technologies and cloud storage have become essential components, with technical support playing a crucial role in ensuring seamless integration and functionality. Repair costs remain a concern for consumers, making it essential for manufacturers to address these issues through ongoing innovation and improvement.
Exclusive Customer Landscape
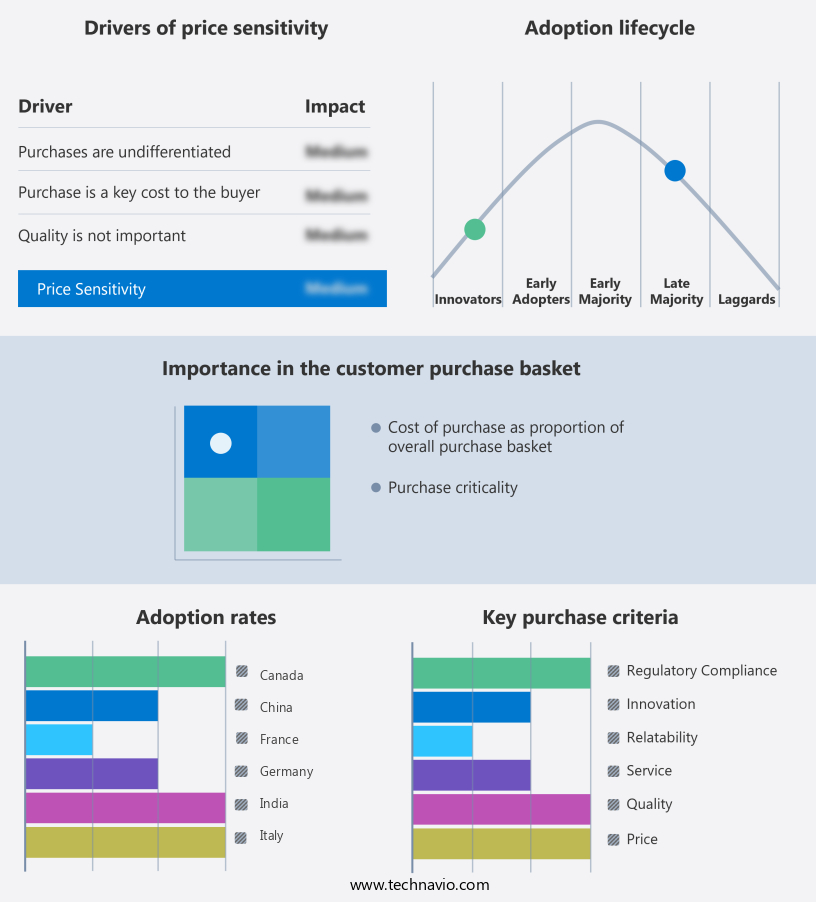
The computer market forecasting report includes the adoption lifecycle of the market, covering from the innovator’s stage to the laggard’s stage. It focuses on adoption rates in different regions based on penetration. Furthermore, the computer market report also includes key purchase criteria and drivers of price sensitivity to help companies evaluate and develop their market growth analysis strategies.
Customer Landscape
Key Companies & Market Insights
Companies are implementing various strategies, such as strategic alliances, computer market forecast, partnerships, mergers and acquisitions, geographical expansion, and product/service launches, to enhance their presence in the industry.
Acer Inc. - The tech company introduces a diverse range of computers under its brands Aspire and Predator, delivering innovative solutions to meet diverse user needs, enhancing digital experiences, and driving technological advancements.
The industry research and growth report includes detailed analyses of the competitive landscape of the market and information about key companies, including:
- Acer Inc.
- Apple Inc.
- ASUSTeK Computer Inc.
- Dell Technologies Inc.
- Fujitsu Ltd.
- HP Inc.
- Lenovo Group Ltd.
- LG Corp.
- Micro Star International Co. Ltd.
- Microsoft Corp.
- Nokia Corp.
- Panasonic Holdings Corp.
- Razer Inc.
- Samsung Electronics Co. Ltd.
- Toshiba Corp.
- Xiaomi Inc.
Qualitative and quantitative analysis of companies has been conducted to help clients understand the wider business environment as well as the strengths and weaknesses of key industry players. Data is qualitatively analyzed to categorize companies as pure play, category-focused, industry-focused, and diversified; it is quantitatively analyzed to categorize companies as dominant, leading, strong, tentative, and weak.
Recent Development and News in Computer Market
- In January 2024, Intel Corporation announced the launch of its new 11th Gen Intel Core processor family, featuring up to six cores and improved performance for laptops and desktops. This release aimed to strengthen Intel's position in the competitive CPU market (Intel Press Release, 2024).
- In March 2024, Microsoft and Sony formed a strategic partnership to bring Microsoft's Azure cloud services to Sony's PlayStation gaming consoles. This collaboration aimed to enhance the gaming experience by providing improved game streaming and cloud services (Microsoft News Center, 2024).
- In May 2024, IBM announced the acquisition of Red Hat, a leading open-source software company, for approximately USD34 billion. This acquisition was aimed at expanding IBM's hybrid cloud offerings and strengthening its position in the enterprise software market (IBM Press Release, 2024).
- In April 2025, Apple unveiled its new M1 Ultra chip, combining the power of two M1 chips to deliver improved performance for its Mac computers. This technological advancement aimed to further solidify Apple's position in the high-performance computing market (Apple Newsroom, 2025).
Research Analyst Overview
- In the dynamic the market, proprietary software continues to dominate, driving innovation in various sectors. IoT devices are revolutionizing industries with their data collection capabilities, triggering a need for agile development and predictive analytics. Edge computing and server farms optimize power efficiency through cooling solutions like water and liquid cooling, while 3D printing enables rapid prototyping in software development. Embedded systems and game development intersect, with neural networks and deep learning powering advanced AI in gaming. Open source software and high-performance computing collaborate to solve complex problems, while cloud security and blockchain technology secure data in the digital age.
- Software licensing models evolve, with quantum computing pushing the boundaries of computation. Big data and data mining fuel business intelligence, while network security safeguards against cyber threats. Thin clients and virtual desktops transform the workplace, offering flexibility and cost savings. Game development, IoT devices, and edge computing intersect, driving innovation in AI and data processing. Power consumption and cooling remain key concerns, with thermal paste and cooling fans addressing these challenges. Data governance and natural language processing ensure data privacy and accessibility. In the realm of hardware, power efficiency and cooling solutions are essential for server farms and high-performance computing.
- Neural networks and deep learning fuel advancements in computer vision and natural language processing. Blockchain technology and cloud security protect data integrity and privacy. Proprietary software and open source software coexist, each offering unique advantages. Agile development and predictive analytics streamline the software development lifecycle. Game development and 3D printing merge, pushing boundaries in visual effects and prototyping. Market trends include the integration of AI in various industries, the rise of edge computing, and the increasing importance of data security and privacy. Proprietary software, open source software, and hardware innovations continue to shape the market.
Dive into Technavio’s robust research methodology, blending expert interviews, extensive data synthesis, and validated models for unparalleled Computer Market insights. See full methodology.
|
Market Scope |
|
|
Report Coverage |
Details |
|
Page number |
161 |
|
Base year |
2023 |
|
Historic period |
2018-2022 |
|
Forecast period |
2024-2028 |
|
Growth momentum & CAGR |
Accelerate at a CAGR of 17.4% |
|
Market growth 2024-2028 |
USD 57849.8 million |
|
Market structure |
Fragmented |
|
YoY growth 2023-2024(%) |
14.0 |
|
Key countries |
China, India, South Korea, France, Italy, UK, Germany, US, Japan, and Canada |
|
Competitive landscape |
Leading Companies, Market Positioning of Companies, Competitive Strategies, and Industry Risks |
What are the Key Data Covered in this Computer Market Research and Growth Report?
- CAGR of the Computer industry during the forecast period
- Detailed information on factors that will drive the growth and forecasting between 2024 and 2028
- Precise estimation of the size of the market and its contribution of the industry in focus to the parent market
- Accurate predictions about upcoming growth and trends and changes in consumer behaviour
- Growth of the market across APAC, North America, Europe, South America, and Middle East and Africa
- Thorough analysis of the market’s competitive landscape and detailed information about companies
- Comprehensive analysis of factors that will challenge the computer market growth of industry companies
We can help! Our analysts can customize this computer market research report to meet your requirements.
 RIA -
RIA - 
