Armored Civilian Vehicles Market Analysis, Size, and Forecast 2026-2030: North America (US, Mexico, and Canada), Europe (Germany, UK, and France), APAC (China, India, and Japan), South America (Brazil and Colombia), Middle East and Africa (UAE, South Africa, and Saudi Arabia), and Rest of World (ROW)

Armored Civilian Vehicles Market Analysis, Size, and Forecast 2026-2030:
North America (US, Mexico, and Canada), Europe (Germany, UK, and France), APAC (China, India, and Japan), South America (Brazil and Colombia), Middle East and Africa (UAE, South Africa, and Saudi Arabia), and Rest of World (ROW)

Published: May 2026 308 Pages SKU: IRTNTR80614

Market Overview at a Glance

$718.2 Mn
Market Opportunity
7.1%
CAGR 2025 - 2030
28.4%
North America Growth
$791.9 Mn
SUV segment 2024

Armored Civilian Vehicles Market Size 2026-2030

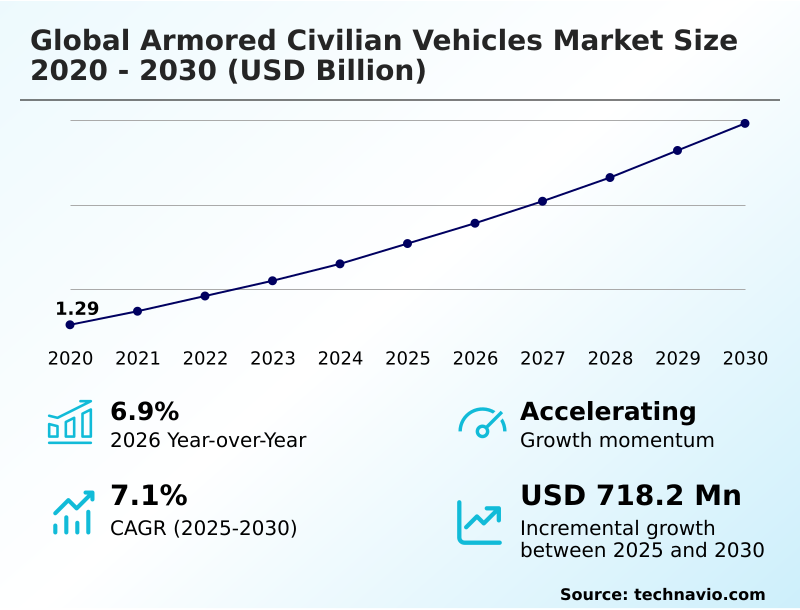
The armored civilian vehicles market size is valued to increase by USD 718.2 million, at a CAGR of 7.1% from 2025 to 2030. Increasing global security threats and personal risk perception will drive the armored civilian vehicles market.

Major Market Trends & Insights

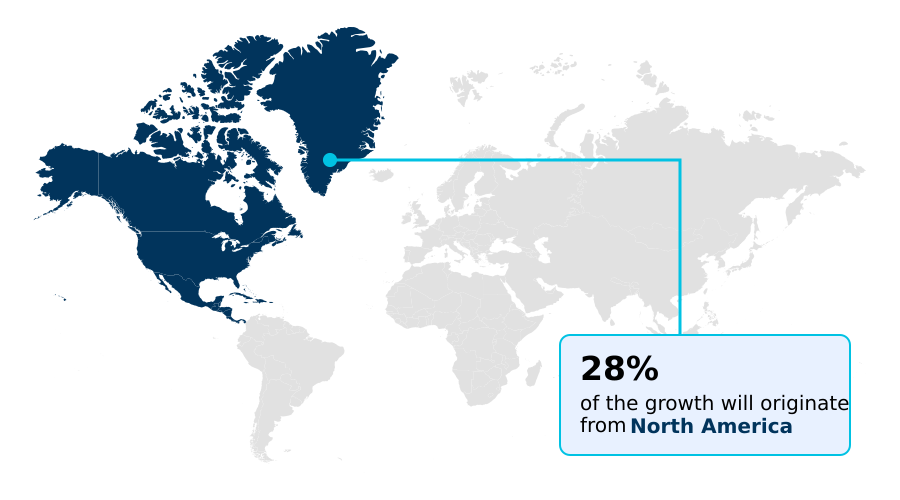
  • North America dominated the market and accounted for a 28.4% growth during the forecast period.
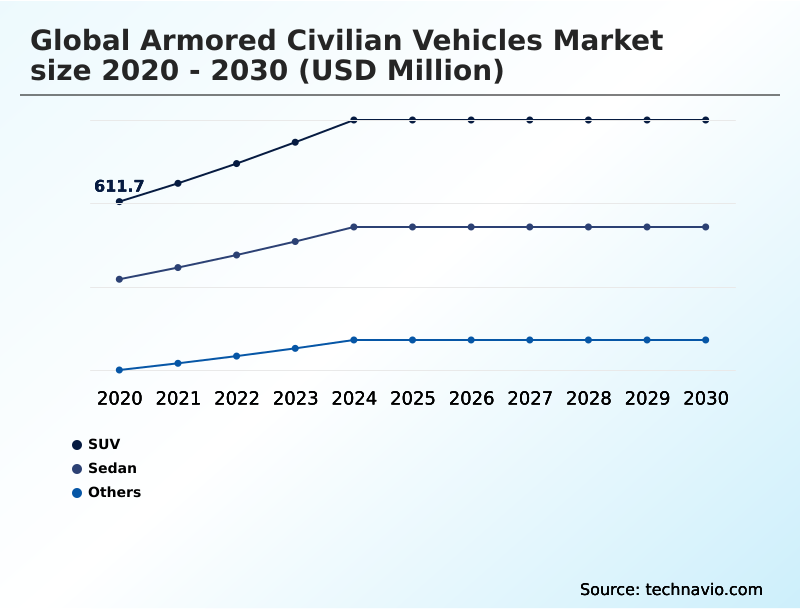
  • By Type - SUV segment was valued at USD 791.9 million in 2024
  • By End-user - Government segment accounted for the largest market revenue share in 2024

Market Size & Forecast

  • Market Opportunities: USD 1.19 billion
  • Market Future Opportunities: USD 718.2 million
  • CAGR from 2025 to 2030 : 7.1%

Market Summary

  • The armored civilian vehicles market is undergoing a significant transformation, driven by evolving security needs and technological advancements. No longer confined to government and diplomatic use, the market now caters to a growing civilian clientele demanding personal security vehicles.
  • This shift is pushing manufacturers toward innovations in lightweight composite materials and discreet armoring solutions that preserve the aesthetics and vehicle performance dynamics of luxury platforms. A critical challenge remains in the realm of armored electric vehicles, where protecting the high-voltage battery pack from ballistic threats requires novel engineering approaches.
  • For instance, a corporate security director must now evaluate not just traditional ballistic threat assessment data but also the complexities of armored vehicle maintenance for an EV fleet. This involves balancing certified ballistic protection with operational factors like range, charging infrastructure, and the specialized vehicle armoring process, ensuring executive protection transport is both secure and practical in modern operational environments.

What will be the Size of the Armored Civilian Vehicles Market during the forecast period?

Get Key Insights on Market Forecast (PDF) Request Free Sample

How is the Armored Civilian Vehicles Market Segmented?

The armored civilian vehicles industry research report provides comprehensive data (region-wise segment analysis), with forecasts and estimates in "USD million" for the period 2026-2030, as well as historical data from 2020-2024 for the following segments.

  • Type
    • SUV
    • Sedan
    • Others
  • End-user
    • Government
    • Civilian
  • Vehicle type
    • ICE
    • Electric
    • Hybrid
  • Distribution channel
    • Direct sales
    • Distributors
    • Online platforms
  • Geography
    • North America
      • US
      • Mexico
      • Canada
    • Europe
      • Germany
      • UK
      • France
    • APAC
      • China
      • India
      • Japan
    • South America
      • Brazil
      • Colombia
    • Middle East and Africa
      • UAE
      • South Africa
      • Saudi Arabia
    • Rest of World (ROW)

By Type Insights

The suv segment is estimated to witness significant growth during the forecast period.

The Sports Utility Vehicle (SUV) segment dominates the market, representing the preferred platform for armoring due to inherent design advantages.

Their body-on-frame construction, higher ground clearance, and powerful engines facilitate the integration of heavy ballistic materials with a reduced impact on vehicle performance dynamics.

This allows for comprehensive passenger compartment integrity and the addition of features like blast mitigation flooring and suspension reinforcement.

Demand for armored suvs spans government, corporate, and private clients, with a strong trend toward low-profile armoring to maintain a discreet appearance.

The segment accounts for over 48% of armored civilian vehicle sales, driven by its versatility and ability to combine high-security with luxury. Key offerings include tactical response vehicles and customized executive protection transport, featuring upgraded braking systems and advanced security.

Request Free Sample

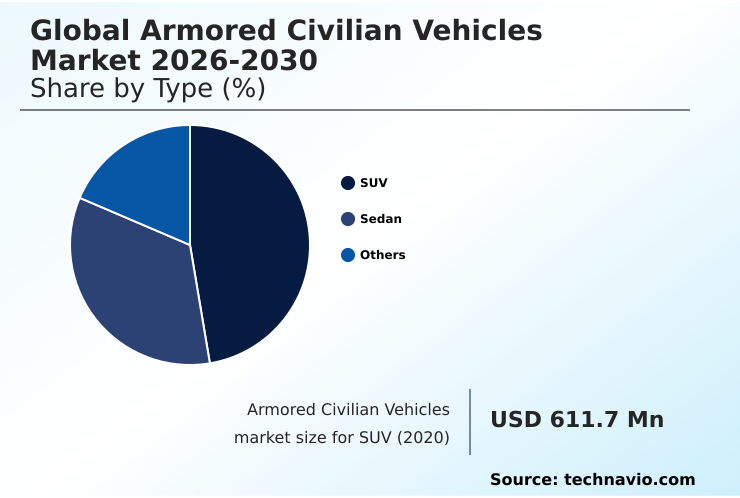
The SUV segment was valued at USD 791.9 million in 2024 and showed a gradual increase during the forecast period.

Request Free Sample

Regional Analysis

North America is estimated to contribute 28.4% to the growth of the global market during the forecast period.Technavio’s analysts have elaborately explained the regional trends and drivers that shape the market during the forecast period.

See How Armored Civilian Vehicles Market Demand is Rising in North America Request Free Sample

The geographic landscape of the armored civilian vehicles market is diverse, with regional demands shaped by unique security and economic factors.

North America leads in technological sophistication, focusing on low-profile armoring and executive protection transport, and is expected to account for over 28% of the market's incremental growth.

In contrast, markets in South America are volume-driven, with a broader customer base seeking personal security vehicles due to regional safety concerns.

The APAC region is the fastest-growing, with a regional expansion rate of nearly 7.8%, fueled by rising wealth and the need for high-security transport. This global distribution necessitates complex armored transport logistics and adherence to varied armored vehicle export regulations.

Efficient supply chain management in this sector has been shown to reduce delivery lead times by up to 20% for international clients, a key competitive differentiator.
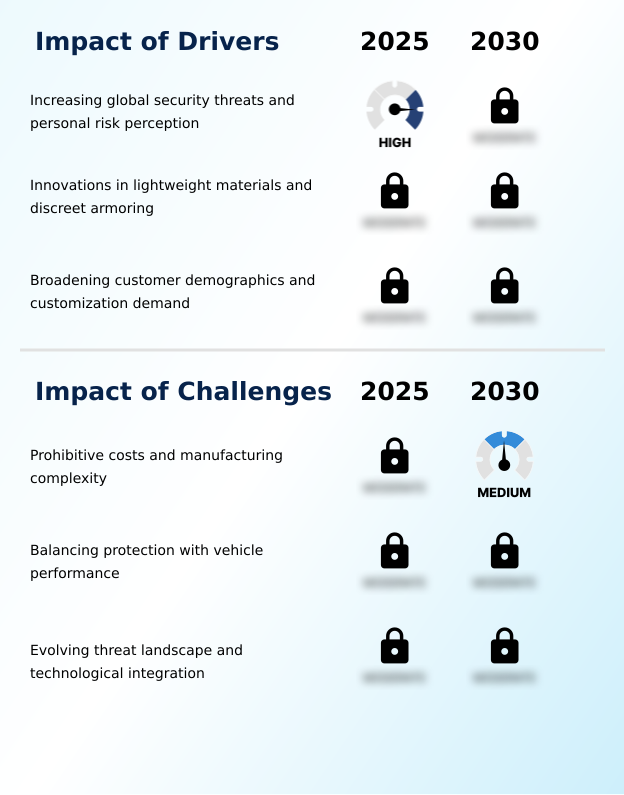
Market Dynamics

Our researchers analyzed the data with 2025 as the base year, along with the key drivers, trends, and challenges. A holistic analysis of drivers will help companies refine their marketing strategies to gain a competitive advantage.

  • The decision-making process for acquiring a protected vehicle involves complex trade-offs, beginning with the core choice between lightweight composite armor versus ballistic steel. This decision directly influences the total cost of armoring a cadillac escalade and defines the engineering approach for a project like armoring a tesla model s, where the challenges of armoring electric vehicles are paramount.
  • The critical task of protecting ev batteries from ballistic threats requires specialized materials and techniques. For those seeking the best armored suv for personal use, understanding the difference between vpam vr7 versus vr9 ballistic protection is essential.
  • The armored vehicle manufacturing process explained to clients must cover key systems, including the details of upgrading brakes on an armored vehicle and the specifics of run-flat tire performance on armored suvs, which heavily impact armor on vehicle handling. For high-end platforms like an armored toyota land cruiser, features are extensive.
  • The logistics of how to import an armored car are also a consideration for international buyers. For others, the focus is on discreet armoring for luxury sedans or anti-kidnapping features in civilian vehicles. Specialized applications such as an armored vehicle for cash in transit require robust suspension upgrades for armored trucks.
  • The process of maintaining an armored mercedes-benz s-class differs from that of customizing an armored jeep wagoneer, reflecting the diverse needs met by the industry, including government procurement of armored civilian vehicles.

What are the key market drivers leading to the rise in the adoption of Armored Civilian Vehicles Industry?

  • Increasing global security threats and a heightened perception of personal risk are primary drivers for the armored civilian vehicles market.

  • Persistent global security concerns and an expanding private-sector client base are key market drivers. There is rising demand for discreet armoring solutions, particularly for armored luxury sedans and armored suvs, from executives and high-net-worth individuals.
  • This has broadened the market for personal security vehicles, with the non-government segment growing by over 30% in recent years. This clientele demands certified ballistic protection that does not visibly alter the vehicle.
  • Consequently, manufacturers are innovating with advanced ballistic glass technology and integrated armor. The ability to offer extensive armored car customization is a significant differentiator, with requests for bespoke interiors and specialized equipment increasing by 50%.
  • This creates a robust market for both new armored suv for sale and aftermarket armored vehicle conversion services, all driven by a proactive approach to vehicle-borne threat mitigation.

What are the market trends shaping the Armored Civilian Vehicles Industry?

  • The integration of advanced electronics and network-centric capabilities is a dominant trend. This transforms armored platforms from protected transport into mobile command centers.

  • A primary trend is the rapid adoption of electric and hybrid drivetrains, presenting unique ev armoring challenges. The industry is focused on developing lightweight armor solutions to counteract the added mass of batteries, with new composite applications reducing overall weight by up to 15% without compromising protection.
  • This shift is accompanied by the deep integration of network-centric capabilities, transforming vehicles into mobile command centers with secure communication suites. These electronic systems improve situational awareness by over 40% in urban environments. The rise of hybrid armored vehicle tech offers a bridge solution, combining silent electric-mode operation with the extended range of traditional engines.
  • This focus on technological advancement is redefining the capabilities of personal security vehicles and tactical civilian vehicles, aligning with modern security demands and sustainability goals, while also influencing armored vehicle maintenance protocols.

What challenges does the Armored Civilian Vehicles Industry face during its growth?

  • The prohibitive costs and inherent complexity of the manufacturing process present a significant challenge to the armored civilian vehicles market.

  • The market's primary challenges are the high civilian armored vehicle cost and the engineering complexity of the vehicle armoring process. Integrating protection, which can increase a vehicle's base cost by over 200%, requires a complete vehicle disassembly for chassis reinforcement and the installation of materials that meet specific ballistic certification levels. This labor-intensive process makes scaling production difficult.
  • A perpetual engineering challenge is balancing protection with performance; the addition of armor can reduce acceleration by up to 25%, necessitating costly upgrades to braking and suspension systems.
  • This trade-off between the armored vehicle weight impact and vehicle dynamics control is a critical consideration in every build, from cash-in-transit vehicles to vip protection vehicles, and heavily influences the final armored vehicle resale value.

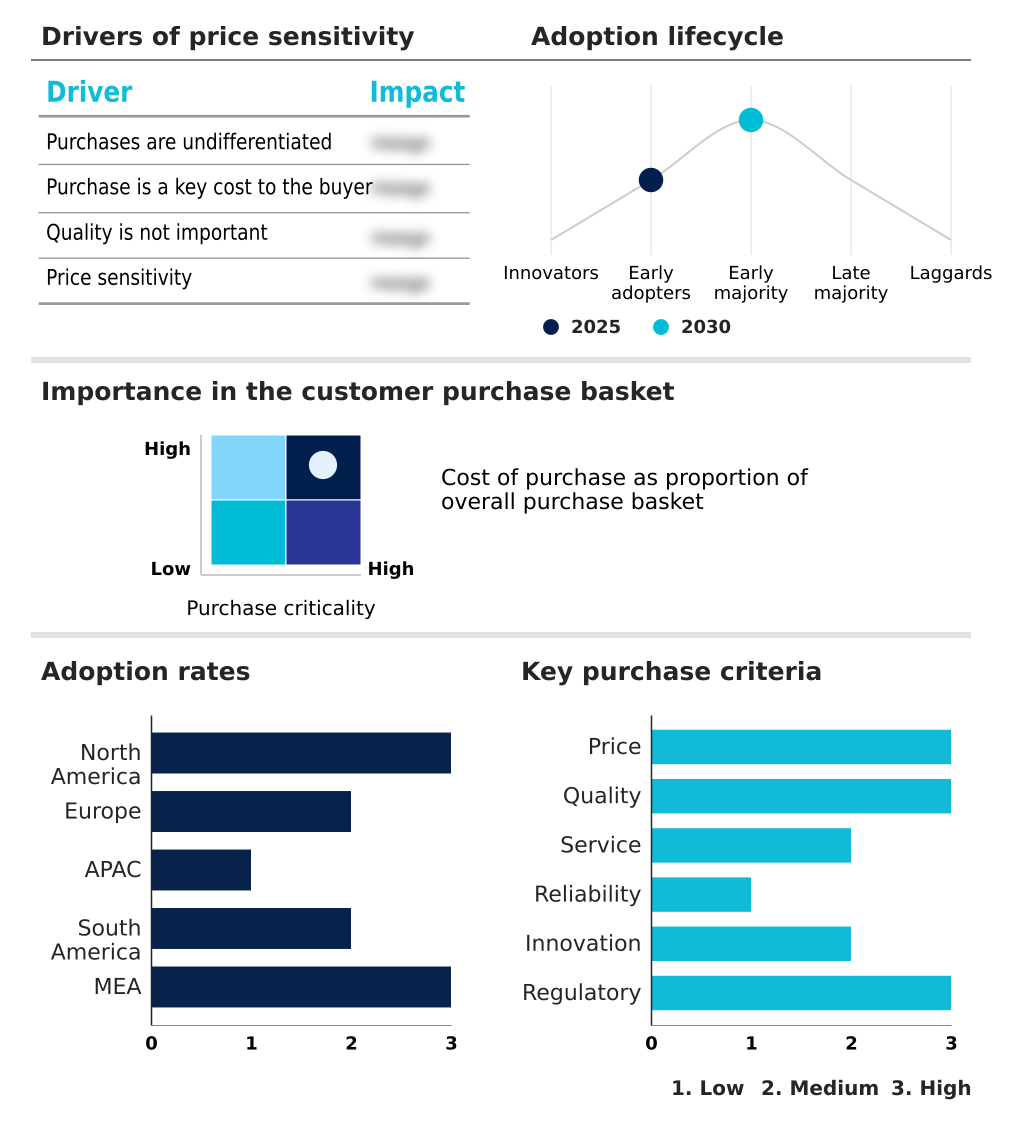
Exclusive Technavio Analysis on Customer Landscape

The armored civilian vehicles market forecasting report includes the adoption lifecycle of the market, covering from the innovator’s stage to the laggard’s stage. It focuses on adoption rates in different regions based on penetration. Furthermore, the armored civilian vehicles market report also includes key purchase criteria and drivers of price sensitivity to help companies evaluate and develop their market growth analysis strategies.

Customer Landscape of Armored Civilian Vehicles Industry

Competitive Landscape

Companies are implementing various strategies, such as strategic alliances, armored civilian vehicles market forecast, partnerships, mergers and acquisitions, geographical expansion, and product/service launches, to enhance their presence in the industry.

Alpine Armoring Inc. - Specializes in the design, engineering, and manufacturing of armored cars, trucks, and vehicles, offering integrated parts, accessories, and logistics support.

The industry research and growth report includes detailed analyses of the competitive landscape of the market and information about key companies, including:

  • Alpine Armoring Inc.
  • Artan Armored Vehicles
  • Aurum Security GmbH
  • Bayerische Motoren Werke AG
  • Harrow Armored Vehicles
  • INKAS Armored Vehicle Mft.
  • International Armored Group
  • International Armoring Corp.
  • Jankel Tactical Systems
  • JCBL Armouring Solutions
  • Lenco Industries Inc.
  • Mercedes Benz Group AG
  • MEVA LLC
  • Rezvani Motors
  • Roshel Inc.
  • Schutzcarr Global
  • STREIT Group
  • TAC Armored Vehicles LLC
  • The Armored Group LLC
  • Ultimate Armour Works

Qualitative and quantitative analysis of companies has been conducted to help clients understand the wider business environment as well as the strengths and weaknesses of key industry players. Data is qualitatively analyzed to categorize companies as pure play, category-focused, industry-focused, and diversified; it is quantitatively analyzed to categorize companies as dominant, leading, strong, tentative, and weak.

Recent Development and News in Armored civilian vehicles market

  • In February 2025, Tesla secured a contract with the United States State Department to develop and manufacture a specialized fleet of high-security armored electric vehicles, signaling governmental endorsement of EV technology for critical security roles.
  • In February 2025, INKAS Armored Vehicle Manufacturing announced a major investment to establish a large-scale production facility in Fort Pierce, Florida, to significantly increase production capacity for the Americas.
  • In May 2025, INKAS Armored Vehicle Manufacturing announced it was the first company to offer the newly refreshed 2025 lineup of General Motors full-size sport utility vehicles, including the Cadillac Escalade and GMC Yukon, with BR6 level armoring.
  • In May 2025, INKAS Armored Vehicle Manufacturing released its digital guide of the top armored vehicles and models for the year, detailing features of popular platforms to attract and educate prospective clients globally.

Dive into Technavio’s robust research methodology, blending expert interviews, extensive data synthesis, and validated models for unparalleled Armored Civilian Vehicles Market insights. See full methodology.

Market Scope
Page number 308
Base year 2025
Historic period 2020-2024
Forecast period 2026-2030
Growth momentum & CAGR Accelerate at a CAGR of 7.1%
Market growth 2026-2030 USD 718.2 million
Market structure Fragmented
YoY growth 2025-2026(%) 6.9%
Key countries US, Mexico, Canada, Germany, UK, France, Russia, Italy, Spain, China, India, Japan, South Korea, Australia, Indonesia, Brazil, Chile, Colombia, UAE, South Africa, Saudi Arabia, Qatar and Turkey
Competitive landscape Leading Companies, Market Positioning of Companies, Competitive Strategies, and Industry Risks

Request Free Sample

Research Analyst Overview

  • The armored civilian vehicles market is defined by a consistent push toward advanced material science and integrated security systems. The industry has moved beyond reliance on traditional ballistic steel production, now leveraging lightweight composite materials, aramid fiber panels, and advanced ceramic plates to meet stringent ballistic protection standards, including the vpam vr7 ballistic standard.
  • This evolution is critical for maintaining vehicle performance dynamics while ensuring passenger compartment integrity. Key components like multi-layered ballistic glass, fuel tank protection, and run-flat tire systems are now standard, but the frontier of innovation lies in complex systems.
  • For instance, developing effective high-voltage battery protection for armored electric vehicles represents a significant R&D focus, directly influencing boardroom decisions on technology investment. Firms that secure oem-certified armoring status demonstrate a higher level of integration, which has been shown to improve client trust by over 25%.
  • This technical depth, from chassis reinforcement and engine compartment armoring to implementing secure communication suites and 360-degree surveillance systems, dictates market leadership.

What are the Key Data Covered in this Armored Civilian Vehicles Market Research and Growth Report?

  • What is the expected growth of the Armored Civilian Vehicles Market between 2026 and 2030?

    • USD 718.2 million, at a CAGR of 7.1%

  • What segmentation does the market report cover?

    • The report is segmented by Type (SUV, Sedan, and Others), End-user (Government, and Civilian), Vehicle Type (ICE, Electric, and Hybrid), Distribution Channel (Direct sales, Distributors, and Online platforms) and Geography (North America, Europe, APAC, South America, Middle East and Africa)

  • Which regions are analyzed in the report?

    • North America, Europe, APAC, South America and Middle East and Africa

  • What are the key growth drivers and market challenges?

    • Increasing global security threats and personal risk perception, Prohibitive costs and manufacturing complexity

  • Who are the major players in the Armored Civilian Vehicles Market?

    • Alpine Armoring Inc., Artan Armored Vehicles, Aurum Security GmbH, Bayerische Motoren Werke AG, Harrow Armored Vehicles, INKAS Armored Vehicle Mft., International Armored Group, International Armoring Corp., Jankel Tactical Systems, JCBL Armouring Solutions, Lenco Industries Inc., Mercedes Benz Group AG, MEVA LLC, Rezvani Motors, Roshel Inc., Schutzcarr Global, STREIT Group, TAC Armored Vehicles LLC, The Armored Group LLC and Ultimate Armour Works

Market Research Insights

  • Market dynamics are increasingly shaped by client demand for sophisticated armored car customization and discreet security vehicles that do not compromise on performance. The focus is on balancing the armored vehicle weight impact with agility, pushing innovation in ballistic material science.
  • This has led to advancements where new armoring packages reduce vehicle weight by up to 15% compared to traditional methods, directly improving fuel efficiency. Furthermore, streamlined armoring engineering process has enabled a 20% reduction in vehicle conversion times for popular models, enhancing manufacturers' ability to meet demand.
  • Buyers now scrutinize ballistic certification levels more closely, demanding certified protection that aligns with specific threat environments. This intricate balance of cost, performance, and security defines the competitive landscape.

We can help! Our analysts can customize this armored civilian vehicles market research report to meet your requirements.

Get in touch

1. Executive Summary

1.1 Market overview

Executive Summary - Chart on Market Overview
Executive Summary - Data Table on Market Overview
Executive Summary - Chart on Global Market Characteristics
Executive Summary - Chart on Market by Geography
Executive Summary - Chart on Market Segmentation by Type
Executive Summary - Chart on Market Segmentation by End-user
Executive Summary - Chart on Market Segmentation by Vehicle Type
Executive Summary - Chart on Market Segmentation by Distribution Channel
Executive Summary - Chart on Incremental Growth
Executive Summary - Data Table on Incremental Growth
Executive Summary - Chart on Company Market Positioning

2. Technavio Analysis

2.1 Analysis of price sensitivity, lifecycle, customer purchase basket, adoption rates, and purchase criteria

2.2 Criticality of inputs and Factors of differentiation

Chart on Overview on criticality of inputs and factors of differentiation

2.3 Factors of disruption

Chart on Overview on factors of disruption

2.4 Impact of drivers and challenges

Chart on Impact of drivers and challenges in 2025 and 2030

3. Market Landscape

3.1 Market ecosystem

Chart on Parent Market
Data Table on - Parent Market

3.2 Market characteristics

Chart on Market characteristics analysis

3.3 Value chain analysis

Chart on Value chain analysis

4. Market Sizing

4.1 Market definition

Data Table on Offerings of companies included in the market definition

4.2 Market segment analysis

Market segments

4.3 Market size 2025

4.4 Market outlook: Forecast for 2025-2030

Chart on Global - Market size and forecast 2025-2030 ($ million)
Data Table on Global - Market size and forecast 2025-2030 ($ million)
Chart on Global Market: Year-over-year growth 2025-2030 (%)
Data Table on Global Market: Year-over-year growth 2025-2030 (%)

5. Historic Market Size

5.1 Global Armored Civilian Vehicles Market 2020 - 2024

Historic Market Size - Data Table on Global Armored Civilian Vehicles Market 2020 - 2024 ($ million)

5.2 Type segment analysis 2020 - 2024

Historic Market Size - Type Segment 2020 - 2024 ($ million)

5.3 End-user segment analysis 2020 - 2024

Historic Market Size - End-user Segment 2020 - 2024 ($ million)

5.4 Vehicle Type segment analysis 2020 - 2024

Historic Market Size - Vehicle Type Segment 2020 - 2024 ($ million)

5.5 Distribution Channel segment analysis 2020 - 2024

Historic Market Size - Distribution Channel Segment 2020 - 2024 ($ million)

5.6 Geography segment analysis 2020 - 2024

Historic Market Size - Geography Segment 2020 - 2024 ($ million)

5.7 Country segment analysis 2020 - 2024

Historic Market Size - Country Segment 2020 - 2024 ($ million)

6. Qualitative Analysis

6.1 Impact of AI on Global Armored Civilian Vehicles Market

6.2 Impact of Geopolitical Conflicts on Global Armored Civilian Vehicles Market

7. Five Forces Analysis

7.1 Five forces summary

Five forces analysis - Comparison between 2025 and 2030

7.2 Bargaining power of buyers

Bargaining power of buyers - Impact of key factors 2025 and 2030

7.3 Bargaining power of suppliers

Bargaining power of suppliers - Impact of key factors in 2025 and 2030

7.4 Threat of new entrants

Threat of new entrants - Impact of key factors in 2025 and 2030

7.5 Threat of substitutes

Threat of substitutes - Impact of key factors in 2025 and 2030

7.6 Threat of rivalry

Threat of rivalry - Impact of key factors in 2025 and 2030

7.7 Market condition

Chart on Market condition - Five forces 2025 and 2030

8. Market Segmentation by Type

8.1 Market segments

Chart on Type - Market share 2025-2030 (%)
Data Table on Type - Market share 2025-2030 (%)

8.2 Comparison by Type

Chart on Comparison by Type
Data Table on Comparison by Type

8.3 SUV - Market size and forecast 2025-2030

Chart on SUV - Market size and forecast 2025-2030 ($ million)
Data Table on SUV - Market size and forecast 2025-2030 ($ million)
Chart on SUV - Year-over-year growth 2025-2030 (%)
Data Table on SUV - Year-over-year growth 2025-2030 (%)

8.4 Sedan - Market size and forecast 2025-2030

Chart on Sedan - Market size and forecast 2025-2030 ($ million)
Data Table on Sedan - Market size and forecast 2025-2030 ($ million)
Chart on Sedan - Year-over-year growth 2025-2030 (%)
Data Table on Sedan - Year-over-year growth 2025-2030 (%)

8.5 Others - Market size and forecast 2025-2030

Chart on Others - Market size and forecast 2025-2030 ($ million)
Data Table on Others - Market size and forecast 2025-2030 ($ million)
Chart on Others - Year-over-year growth 2025-2030 (%)
Data Table on Others - Year-over-year growth 2025-2030 (%)

8.6 Market opportunity by Type

Market opportunity by Type ($ million)
Data Table on Market opportunity by Type ($ million)

9. Market Segmentation by End-user

9.1 Market segments

Chart on End-user - Market share 2025-2030 (%)
Data Table on End-user - Market share 2025-2030 (%)

9.2 Comparison by End-user

Chart on Comparison by End-user
Data Table on Comparison by End-user

9.3 Government - Market size and forecast 2025-2030

Chart on Government - Market size and forecast 2025-2030 ($ million)
Data Table on Government - Market size and forecast 2025-2030 ($ million)
Chart on Government - Year-over-year growth 2025-2030 (%)
Data Table on Government - Year-over-year growth 2025-2030 (%)

9.4 Civilian - Market size and forecast 2025-2030

Chart on Civilian - Market size and forecast 2025-2030 ($ million)
Data Table on Civilian - Market size and forecast 2025-2030 ($ million)
Chart on Civilian - Year-over-year growth 2025-2030 (%)
Data Table on Civilian - Year-over-year growth 2025-2030 (%)

9.5 Market opportunity by End-user

Market opportunity by End-user ($ million)
Data Table on Market opportunity by End-user ($ million)

10. Market Segmentation by Vehicle Type

10.1 Market segments

Chart on Vehicle Type - Market share 2025-2030 (%)
Data Table on Vehicle Type - Market share 2025-2030 (%)

10.2 Comparison by Vehicle Type

Chart on Comparison by Vehicle Type
Data Table on Comparison by Vehicle Type

10.3 ICE - Market size and forecast 2025-2030

Chart on ICE - Market size and forecast 2025-2030 ($ million)
Data Table on ICE - Market size and forecast 2025-2030 ($ million)
Chart on ICE - Year-over-year growth 2025-2030 (%)
Data Table on ICE - Year-over-year growth 2025-2030 (%)

10.4 Electric - Market size and forecast 2025-2030

Chart on Electric - Market size and forecast 2025-2030 ($ million)
Data Table on Electric - Market size and forecast 2025-2030 ($ million)
Chart on Electric - Year-over-year growth 2025-2030 (%)
Data Table on Electric - Year-over-year growth 2025-2030 (%)

10.5 Hybrid - Market size and forecast 2025-2030

Chart on Hybrid - Market size and forecast 2025-2030 ($ million)
Data Table on Hybrid - Market size and forecast 2025-2030 ($ million)
Chart on Hybrid - Year-over-year growth 2025-2030 (%)
Data Table on Hybrid - Year-over-year growth 2025-2030 (%)

10.6 Market opportunity by Vehicle Type

Market opportunity by Vehicle Type ($ million)
Data Table on Market opportunity by Vehicle Type ($ million)

11. Market Segmentation by Distribution Channel

11.1 Market segments

Chart on Distribution Channel - Market share 2025-2030 (%)
Data Table on Distribution Channel - Market share 2025-2030 (%)

11.2 Comparison by Distribution Channel

Chart on Comparison by Distribution Channel
Data Table on Comparison by Distribution Channel

11.3 Direct sales - Market size and forecast 2025-2030

Chart on Direct sales - Market size and forecast 2025-2030 ($ million)
Data Table on Direct sales - Market size and forecast 2025-2030 ($ million)
Chart on Direct sales - Year-over-year growth 2025-2030 (%)
Data Table on Direct sales - Year-over-year growth 2025-2030 (%)

11.4 Distributors - Market size and forecast 2025-2030

Chart on Distributors - Market size and forecast 2025-2030 ($ million)
Data Table on Distributors - Market size and forecast 2025-2030 ($ million)
Chart on Distributors - Year-over-year growth 2025-2030 (%)
Data Table on Distributors - Year-over-year growth 2025-2030 (%)

11.5 Online platforms - Market size and forecast 2025-2030

Chart on Online platforms - Market size and forecast 2025-2030 ($ million)
Data Table on Online platforms - Market size and forecast 2025-2030 ($ million)
Chart on Online platforms - Year-over-year growth 2025-2030 (%)
Data Table on Online platforms - Year-over-year growth 2025-2030 (%)

11.6 Market opportunity by Distribution Channel

Market opportunity by Distribution Channel ($ million)
Data Table on Market opportunity by Distribution Channel ($ million)

12. Customer Landscape

12.1 Customer landscape overview

Analysis of price sensitivity, lifecycle, customer purchase basket, adoption rates, and purchase criteria

13. Geographic Landscape

13.1 Geographic segmentation

Chart on Market share by geography 2025-2030 (%)
Data Table on Market share by geography 2025-2030 (%)

13.2 Geographic comparison

Chart on Geographic comparison
Data Table on Geographic comparison

13.3 North America - Market size and forecast 2025-2030

Chart on North America - Market size and forecast 2025-2030 ($ million)
Data Table on North America - Market size and forecast 2025-2030 ($ million)
Chart on North America - Year-over-year growth 2025-2030 (%)
Data Table on North America - Year-over-year growth 2025-2030 (%)
Chart on Regional Comparison - North America
Data Table on Regional Comparison - North America

13.3.1 US - Market size and forecast 2025-2030

Chart on US - Market size and forecast 2025-2030 ($ million)
Data Table on US - Market size and forecast 2025-2030 ($ million)
Chart on US - Year-over-year growth 2025-2030 (%)
Data Table on US - Year-over-year growth 2025-2030 (%)

13.3.2 Mexico - Market size and forecast 2025-2030

Chart on Mexico - Market size and forecast 2025-2030 ($ million)
Data Table on Mexico - Market size and forecast 2025-2030 ($ million)
Chart on Mexico - Year-over-year growth 2025-2030 (%)
Data Table on Mexico - Year-over-year growth 2025-2030 (%)

13.3.3 Canada - Market size and forecast 2025-2030

Chart on Canada - Market size and forecast 2025-2030 ($ million)
Data Table on Canada - Market size and forecast 2025-2030 ($ million)
Chart on Canada - Year-over-year growth 2025-2030 (%)
Data Table on Canada - Year-over-year growth 2025-2030 (%)

13.4 Europe - Market size and forecast 2025-2030

Chart on Europe - Market size and forecast 2025-2030 ($ million)
Data Table on Europe - Market size and forecast 2025-2030 ($ million)
Chart on Europe - Year-over-year growth 2025-2030 (%)
Data Table on Europe - Year-over-year growth 2025-2030 (%)
Chart on Regional Comparison - Europe
Data Table on Regional Comparison - Europe

13.4.1 Germany - Market size and forecast 2025-2030

Chart on Germany - Market size and forecast 2025-2030 ($ million)
Data Table on Germany - Market size and forecast 2025-2030 ($ million)
Chart on Germany - Year-over-year growth 2025-2030 (%)
Data Table on Germany - Year-over-year growth 2025-2030 (%)

13.4.2 UK - Market size and forecast 2025-2030

Chart on UK - Market size and forecast 2025-2030 ($ million)
Data Table on UK - Market size and forecast 2025-2030 ($ million)
Chart on UK - Year-over-year growth 2025-2030 (%)
Data Table on UK - Year-over-year growth 2025-2030 (%)

13.4.3 France - Market size and forecast 2025-2030

Chart on France - Market size and forecast 2025-2030 ($ million)
Data Table on France - Market size and forecast 2025-2030 ($ million)
Chart on France - Year-over-year growth 2025-2030 (%)
Data Table on France - Year-over-year growth 2025-2030 (%)

13.4.4 Russia - Market size and forecast 2025-2030

Chart on Russia - Market size and forecast 2025-2030 ($ million)
Data Table on Russia - Market size and forecast 2025-2030 ($ million)
Chart on Russia - Year-over-year growth 2025-2030 (%)
Data Table on Russia - Year-over-year growth 2025-2030 (%)

13.4.5 Italy - Market size and forecast 2025-2030

Chart on Italy - Market size and forecast 2025-2030 ($ million)
Data Table on Italy - Market size and forecast 2025-2030 ($ million)
Chart on Italy - Year-over-year growth 2025-2030 (%)
Data Table on Italy - Year-over-year growth 2025-2030 (%)

13.4.6 Spain - Market size and forecast 2025-2030

Chart on Spain - Market size and forecast 2025-2030 ($ million)
Data Table on Spain - Market size and forecast 2025-2030 ($ million)
Chart on Spain - Year-over-year growth 2025-2030 (%)
Data Table on Spain - Year-over-year growth 2025-2030 (%)

13.5 APAC - Market size and forecast 2025-2030

Chart on APAC - Market size and forecast 2025-2030 ($ million)
Data Table on APAC - Market size and forecast 2025-2030 ($ million)
Chart on APAC - Year-over-year growth 2025-2030 (%)
Data Table on APAC - Year-over-year growth 2025-2030 (%)
Chart on Regional Comparison - APAC
Data Table on Regional Comparison - APAC

13.5.1 China - Market size and forecast 2025-2030

Chart on China - Market size and forecast 2025-2030 ($ million)
Data Table on China - Market size and forecast 2025-2030 ($ million)
Chart on China - Year-over-year growth 2025-2030 (%)
Data Table on China - Year-over-year growth 2025-2030 (%)

13.5.2 India - Market size and forecast 2025-2030

Chart on India - Market size and forecast 2025-2030 ($ million)
Data Table on India - Market size and forecast 2025-2030 ($ million)
Chart on India - Year-over-year growth 2025-2030 (%)
Data Table on India - Year-over-year growth 2025-2030 (%)

13.5.3 Japan - Market size and forecast 2025-2030

Chart on Japan - Market size and forecast 2025-2030 ($ million)
Data Table on Japan - Market size and forecast 2025-2030 ($ million)
Chart on Japan - Year-over-year growth 2025-2030 (%)
Data Table on Japan - Year-over-year growth 2025-2030 (%)

13.5.4 South Korea - Market size and forecast 2025-2030

Chart on South Korea - Market size and forecast 2025-2030 ($ million)
Data Table on South Korea - Market size and forecast 2025-2030 ($ million)
Chart on South Korea - Year-over-year growth 2025-2030 (%)
Data Table on South Korea - Year-over-year growth 2025-2030 (%)

13.5.5 Australia - Market size and forecast 2025-2030

Chart on Australia - Market size and forecast 2025-2030 ($ million)
Data Table on Australia - Market size and forecast 2025-2030 ($ million)
Chart on Australia - Year-over-year growth 2025-2030 (%)
Data Table on Australia - Year-over-year growth 2025-2030 (%)

13.5.6 Indonesia - Market size and forecast 2025-2030

Chart on Indonesia - Market size and forecast 2025-2030 ($ million)
Data Table on Indonesia - Market size and forecast 2025-2030 ($ million)
Chart on Indonesia - Year-over-year growth 2025-2030 (%)
Data Table on Indonesia - Year-over-year growth 2025-2030 (%)

13.6 South America - Market size and forecast 2025-2030

Chart on South America - Market size and forecast 2025-2030 ($ million)
Data Table on South America - Market size and forecast 2025-2030 ($ million)
Chart on South America - Year-over-year growth 2025-2030 (%)
Data Table on South America - Year-over-year growth 2025-2030 (%)
Chart on Regional Comparison - South America
Data Table on Regional Comparison - South America

13.6.1 Brazil - Market size and forecast 2025-2030

Chart on Brazil - Market size and forecast 2025-2030 ($ million)
Data Table on Brazil - Market size and forecast 2025-2030 ($ million)
Chart on Brazil - Year-over-year growth 2025-2030 (%)
Data Table on Brazil - Year-over-year growth 2025-2030 (%)

13.6.2 Chile - Market size and forecast 2025-2030

Chart on Chile - Market size and forecast 2025-2030 ($ million)
Data Table on Chile - Market size and forecast 2025-2030 ($ million)
Chart on Chile - Year-over-year growth 2025-2030 (%)
Data Table on Chile - Year-over-year growth 2025-2030 (%)

13.6.3 Colombia - Market size and forecast 2025-2030

Chart on Colombia - Market size and forecast 2025-2030 ($ million)
Data Table on Colombia - Market size and forecast 2025-2030 ($ million)
Chart on Colombia - Year-over-year growth 2025-2030 (%)
Data Table on Colombia - Year-over-year growth 2025-2030 (%)

13.7 Middle East and Africa - Market size and forecast 2025-2030

Chart on Middle East and Africa - Market size and forecast 2025-2030 ($ million)
Data Table on Middle East and Africa - Market size and forecast 2025-2030 ($ million)
Chart on Middle East and Africa - Year-over-year growth 2025-2030 (%)
Data Table on Middle East and Africa - Year-over-year growth 2025-2030 (%)
Chart on Regional Comparison - Middle East and Africa
Data Table on Regional Comparison - Middle East and Africa

13.7.1 UAE - Market size and forecast 2025-2030

Chart on UAE - Market size and forecast 2025-2030 ($ million)
Data Table on UAE - Market size and forecast 2025-2030 ($ million)
Chart on UAE - Year-over-year growth 2025-2030 (%)
Data Table on UAE - Year-over-year growth 2025-2030 (%)

13.7.2 South Africa - Market size and forecast 2025-2030

Chart on South Africa - Market size and forecast 2025-2030 ($ million)
Data Table on South Africa - Market size and forecast 2025-2030 ($ million)
Chart on South Africa - Year-over-year growth 2025-2030 (%)
Data Table on South Africa - Year-over-year growth 2025-2030 (%)

13.7.3 Saudi Arabia - Market size and forecast 2025-2030

Chart on Saudi Arabia - Market size and forecast 2025-2030 ($ million)
Data Table on Saudi Arabia - Market size and forecast 2025-2030 ($ million)
Chart on Saudi Arabia - Year-over-year growth 2025-2030 (%)
Data Table on Saudi Arabia - Year-over-year growth 2025-2030 (%)

13.7.4 Qatar - Market size and forecast 2025-2030

Chart on Qatar - Market size and forecast 2025-2030 ($ million)
Data Table on Qatar - Market size and forecast 2025-2030 ($ million)
Chart on Qatar - Year-over-year growth 2025-2030 (%)
Data Table on Qatar - Year-over-year growth 2025-2030 (%)

13.7.5 Turkey - Market size and forecast 2025-2030

Chart on Turkey - Market size and forecast 2025-2030 ($ million)
Data Table on Turkey - Market size and forecast 2025-2030 ($ million)
Chart on Turkey - Year-over-year growth 2025-2030 (%)
Data Table on Turkey - Year-over-year growth 2025-2030 (%)

13.8 Market opportunity by geography

Market opportunity by geography ($ million)
Data Tables on Market opportunity by geography ($ million)

14. Drivers, Challenges, and Opportunity

14.1 Market drivers

Increasing global security threats and personal risk perception
Innovations in lightweight materials and discreet armoring
Broadening customer demographics and customization demand

14.2 Market challenges

Prohibitive costs and manufacturing complexity
Balancing protection with vehicle performance
Evolving threat landscape and technological integration

14.3 Impact of drivers and challenges

Impact of drivers and challenges in 2025 and 2030

14.4 Market opportunities

Integration of advanced electronics and network-centric capabilities
Rise of electric and hybrid-electric drivetrains
Emphasis on discreet aesthetics and low-profile protection

15. Competitive Landscape

15.1 Overview

15.2

Overview on criticality of inputs and factors of differentiation

15.3 Landscape disruption

Overview on factors of disruption

15.4 Industry risks

Impact of key risks on business

16. Competitive Analysis

16.1 Companies profiled

Companies covered

16.2 Company ranking index

16.3 Market positioning of companies

Matrix on companies position and classification

16.4 Alpine Armoring Inc.

Alpine Armoring Inc. - Overview
Alpine Armoring Inc. - Product / Service
Alpine Armoring Inc. - Key offerings
SWOT

16.5 Artan Armored Vehicles

Artan Armored Vehicles - Overview
Artan Armored Vehicles - Product / Service
Artan Armored Vehicles - Key offerings
SWOT

16.6 Aurum Security GmbH

Aurum Security GmbH - Overview
Aurum Security GmbH - Product / Service
Aurum Security GmbH - Key offerings
SWOT

16.7 Bayerische Motoren Werke AG

Bayerische Motoren Werke AG - Overview
Bayerische Motoren Werke AG - Business segments
Bayerische Motoren Werke AG - Key offerings
Bayerische Motoren Werke AG - Segment focus
SWOT

16.8 Harrow Armored Vehicles

Harrow Armored Vehicles - Overview
Harrow Armored Vehicles - Product / Service
Harrow Armored Vehicles - Key offerings
SWOT

16.9 INKAS Armored Vehicle Mft.

INKAS Armored Vehicle Mft. - Overview
INKAS Armored Vehicle Mft. - Product / Service
INKAS Armored Vehicle Mft. - Key offerings
SWOT

16.10 International Armored Group

International Armored Group - Overview
International Armored Group - Product / Service
International Armored Group - Key offerings
SWOT

16.11 International Armoring Corp.

International Armoring Corp. - Overview
International Armoring Corp. - Product / Service
International Armoring Corp. - Key offerings
SWOT

16.12 Jankel Tactical Systems

Jankel Tactical Systems - Overview
Jankel Tactical Systems - Product / Service
Jankel Tactical Systems - Key offerings
SWOT

16.13 JCBL Armouring Solutions

JCBL Armouring Solutions - Overview
JCBL Armouring Solutions - Product / Service
JCBL Armouring Solutions - Key offerings
SWOT

16.14 Lenco Industries Inc.

Lenco Industries Inc. - Overview
Lenco Industries Inc. - Product / Service
Lenco Industries Inc. - Key offerings
SWOT

16.15 Mercedes Benz Group AG

Mercedes Benz Group AG - Overview
Mercedes Benz Group AG - Business segments
Mercedes Benz Group AG - Key offerings
Mercedes Benz Group AG - Segment focus
SWOT

16.16 MEVA LLC

MEVA LLC - Overview
MEVA LLC - Product / Service
MEVA LLC - Key offerings
SWOT

16.17 Roshel Inc.

Roshel Inc. - Overview
Roshel Inc. - Product / Service
Roshel Inc. - Key offerings
SWOT

16.18 Ultimate Armour Works

Ultimate Armour Works - Overview
Ultimate Armour Works - Product / Service
Ultimate Armour Works - Key offerings
SWOT

17. Appendix

17.1 Scope of the report

Market definition
Objectives
Notes and caveats

17.2 Inclusions and exclusions checklist

Inclusions checklist
Exclusions checklist

17.3 Currency conversion rates for US$

17.4 Research methodology

17.5 Data procurement

Information sources

17.6 Data validation

17.7 Validation techniques employed for market sizing

17.8 Data synthesis

17.9 360 degree market analysis

17.10 List of abbreviations

Research Methodology

Technavio presents a detailed picture of the market by way of study, synthesis, and summation of data from multiple sources. The analysts have presented the various facets of the market with a particular focus on identifying the key industry influencers. The data thus presented is comprehensive, reliable, and the result of extensive research, both primary and secondary.

INFORMATION SOURCES

Primary sources

  • Manufacturers and suppliers
  • Channel partners
  • Industry experts
  • Strategic decision makers

Secondary sources

  • Industry journals and periodicals
  • Government data
  • Financial reports of key industry players
  • Historical data
  • Press releases

DATA ANALYSIS

Data Synthesis

  • Collation of data
  • Estimation of key figures
  • Analysis of derived insights

Data Validation

  • Triangulation with data models
  • Reference against proprietary databases
  • Corroboration with industry experts

REPORT WRITING

Qualitative

  • Market drivers
  • Market challenges
  • Market trends
  • Five forces analysis

Quantitative

  • Market size and forecast
  • Market segmentation
  • Geographical insights
  • Competitive landscape

Interested in this report?

Get your sample now to see our research methodology and insights!

Download Now

Frequently Asked Questions

Armored Civilian Vehicles market growth will increase by USD 718.2 million during 2026-2030.

The Armored Civilian Vehicles market is expected to grow at a CAGR of 7.1% during 2026-2030.

Armored Civilian Vehicles market is segmented by Type (SUV, Sedan, Others) End-user (Government, Civilian) Vehicle type (ICE, Electric, Hybrid) Distribution channel (Direct sales, Distributors, Online platforms)

Alpine Armoring Inc., Artan Armored Vehicles, Aurum Security GmbH, Bayerische Motoren Werke AG, Harrow Armored Vehicles, INKAS Armored Vehicle Mft., International Armored Group, International Armoring Corp., Jankel Tactical Systems, JCBL Armouring Solutions, Lenco Industries Inc., Mercedes Benz Group AG, MEVA LLC, Rezvani Motors, Roshel Inc., Schutzcarr Global, STREIT Group, TAC Armored Vehicles LLC, The Armored Group LLC, Ultimate Armour Works are a few of the key vendors in the Armored Civilian Vehicles market.

North America will register the highest growth rate of 28.4% among the other regions. Therefore, the Armored Civilian Vehicles market in North America is expected to garner significant business opportunities for the vendors during the forecast period.

US, Mexico, Canada, Germany, UK, France, Russia, Italy, Spain, China, India, Japan, South Korea, Australia, Indonesia, Brazil, Chile, Colombia, UAE, South Africa, Saudi Arabia, Qatar, Turkey

  • Increasing global security threats and personal risk perception is the driving factor this market.

The Armored Civilian Vehicles market vendors should focus on grabbing business opportunities from the Type segment as it accounted for the largest market share in the base year.
RIA - Research AI Assistant
Ask RIA