Automotive Powertrain Testing Services Market Size 2025-2029
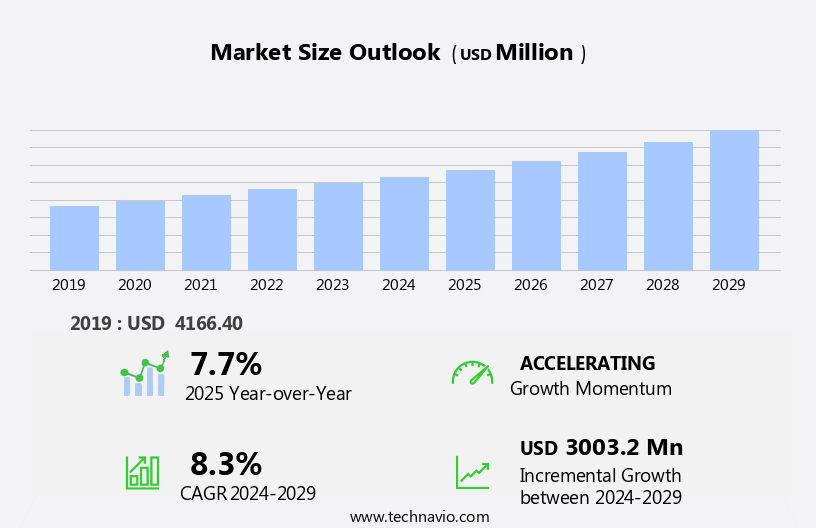
The automotive powertrain testing services market size is forecast to increase by USD 3 billion, at a CAGR of 8.3% between 2024 and 2029.
- The market is experiencing significant growth due to the increasing demand from consumers and regulatory bodies for vehicles that adhere to stringent emission norms. This trend is driving the development of advanced powertrain testing services to ensure compliance with these regulations. Another key driver is the adoption of computer and IT-enabled powertrain testing systems, which offer enhanced accuracy, efficiency, and data analysis capabilities. However, the market faces challenges, including the capital-intensive nature of testing facilities and equipment. Hydrogen fuel and fuel cell testing are gaining traction as alternative fuels, while cybersecurity testing ensures the protection of connected vehicles from cyber threats. This can limit entry for new players and create barriers to market penetration.
- Furthermore, the continuous evolution of powertrain technologies necessitates ongoing investment in research and development to stay competitive. Companies specializing in powertrain testing, such as AVL List GmbH, Siemens AG, and AB Dynamics, must navigate these challenges while capitalizing on opportunities presented by the growing demand for advanced testing services and regulatory compliance. The market is experiencing significant advancements driven by the integration of technology in the automotive industry.
What will be the Size of the Automotive Powertrain Testing Services Market during the forecast period?
Explore in-depth regional segment analysis with market size data - historical 2019-2023 and forecasts 2025-2029 - in the full report.
Request Free Sample
- ADAS testing plays a crucial role in ensuring the safety and reliability of advanced driver-assistance systems. Cloud computing enables remote testing and analysis, reducing costs and increasing efficiency. Additive manufacturing and advanced materials, such as carbon fiber, are revolutionizing powertrain design, leading to lighter and more powerful components. Electric powertrains, including batteries and electric motors, are undergoing extensive testing to optimize performance and extend range.
- Machine learning and AI are used for predictive maintenance and optimization of battery management systems and control systems. CAE software and simulation tools facilitate virtual testing and analysis, while big data and data analytics provide valuable insights for improving powertrain performance and reducing emissions. Hybrid powertrains and alternative fuels continue to evolve, with 3D printing and advanced manufacturing playing a key role in prototyping and production. Power electronics and IoT enable real-time monitoring and optimization of powertrain systems, enhancing overall vehicle performance.
How is this Automotive Powertrain Testing Services Industry segmented?
The automotive powertrain testing services industry research report provides comprehensive data (region-wise segment analysis), with forecasts and estimates in "USD million" for the period 2025-2029, as well as historical data from 2019-2023 for the following segments.
- Type
- ICE powertrain
- Hybrid and electric powertrain
- Vehicle Type
- Passenger vehicle
- Commercial vehicle
- Service
- System testing
- Component testing
- Geography
- North America
- US
- Canada
- Europe
- Germany
- UK
- APAC
- Australia
- China
- India
- Japan
- South Korea
- South America
- Brazil
- Rest of World (ROW)
- North America
By Type Insights
The ICE powertrain segment is estimated to witness significant growth during the forecast period. In the automotive industry, the demand for powertrain testing services is on the rise due to increasing regulatory requirements for reducing greenhouse gas emissions and improving fuel efficiency. OEMs and tier 1 suppliers are continuously innovating and developing advanced powertrain systems to meet these stringent regulations. This includes the implementation of technologies such as variable valve timing, variable valve lifting, engine downsizing, and turbochargers. The complexity of modern ICE powertrains has increased, leading to a greater need for comprehensive testing services. Quality assurance is a critical aspect of powertrain testing, ensuring that the systems meet the required performance standards.
Drivetrain and powertrain testing, powertrain calibration, static testing, and test management are essential services in this regard. Engineering services, transmission testing, test automation, and test cells are also crucial for the development and validation of powertrain systems. Data acquisition systems, dynamic testing, and NVH testing are essential components of powertrain testing, providing valuable insights into the performance of the systems under various conditions. Test reporting and analysis are also vital for identifying issues and optimizing the powertrain design. Testing centers and facilities adhere to SAE and ISO standards to ensure consistent and reliable testing results. Durability testing, reliability testing, fuel economy testing, consulting services, simulation testing, and performance testing are all essential services offered by testing facilities to help OEMs and suppliers validate their powertrain systems.
Emission testing is another critical aspect of powertrain testing, with testing standards continually evolving to meet regulatory requirements. Testing equipment and data analysis are essential tools for ensuring that powertrain systems meet these standards while maintaining optimal performance. As electric vehicle charging infrastructure expands, rigorous validation processes are crucial for optimizing performance.
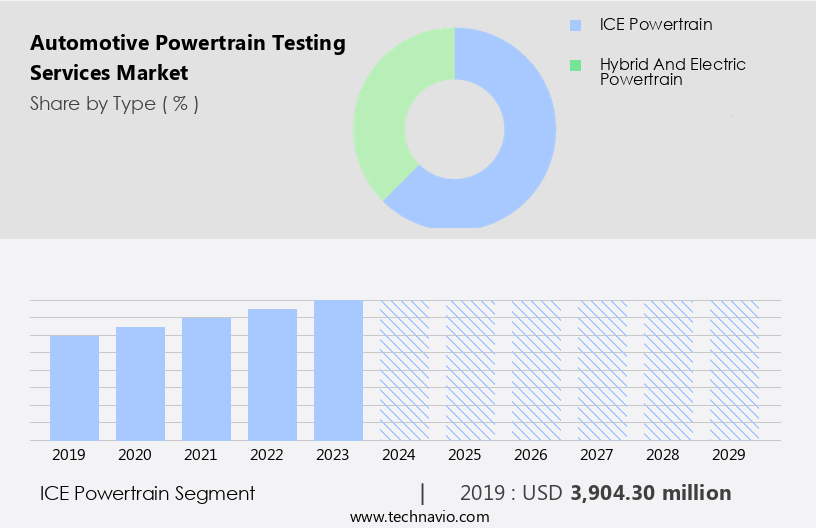
The ICE powertrain segment was valued at USD 3.9 billion in 2019 and showed a gradual increase during the forecast period.
The Automotive Powertrain Testing Services Market is rapidly evolving, driven by advancements in hybrid powertrain technology and the increasing adoption of autonomous vehicles. Comprehensive battery testing and electric motor testing have become essential to ensure efficiency and reliability in modern powertrains. The use of lightweight materials enhances vehicle efficiency, reducing energy consumption. Artificial intelligence and the Internet of Things revolutionize powertrain diagnostics, enabling predictive maintenance. Cutting-edge simulation software plays a pivotal role in optimizing vehicle powertrains before physical testing.
Regional Analysis
APAC is estimated to contribute 63% to the growth of the global market during the forecast period. Technavio's analysts have elaborately explained the regional trends and drivers that shape the market during the forecast period.
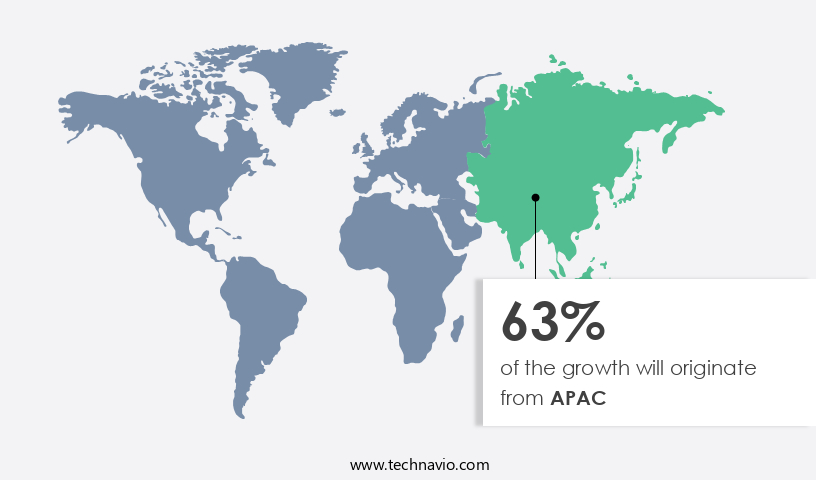
The automotive industry's economic growth in emerging markets, particularly China and India, is driving an increase in passenger car production and sales. This trend is attracting global automobile manufacturers to expand their presence in these regions, leading to a growing demand for advanced powertrain technologies. In response, market players are investing heavily in research and development, focusing on engine and powertrain innovations. Additionally, they are expanding production facilities and establishing new testing centers to meet the increasing demand for automotive powertrain testing services. Key countries in the Asia Pacific region, including China, India, Japan, and South Korea, are at the forefront of this market.
These nations' governments are implementing stringent quality assurance standards, such as SAE and ISO, which require extensive powertrain testing, including static and dynamic testing, engine calibration, transmission testing, and NVH testing. Test management, data acquisition systems, and test automation are also essential components of these testing processes. Tier 1 suppliers play a crucial role in providing testing equipment, consulting services, and data analysis to meet the evolving needs of automotive OEMs. Overall, the market is experiencing significant growth due to the increasing demand for fuel economy testing, durability testing, reliability testing, and emission testing.
Market Dynamics
Our researchers analyzed the data with 2024 as the base year, along with the key drivers, trends, and challenges. A holistic analysis of drivers will help companies refine their marketing strategies to gain a competitive advantage.
What are the Automotive Powertrain Testing Services market drivers leading to the rise in the adoption of Industry?
- The increasing consumer demand for reduced emissions and stringent enforcement by governments for upgrading to newer emission norms serve as the primary market drivers. The automotive industry's competitive pricing landscape and stringent emission norms enforced by governments have led Original Equipment Manufacturers (OEMs) to experiment with powertrain technologies. This experimentation is driven by the increasing demand for more power output from engines or the installation of go-fast parts by customers. Powertrain testing plays a crucial role in ensuring the optimal performance and compliance of these systems. ISO standards and emission testing are integral components of powertrain testing. Engine testing is essential to evaluate fuel efficiency, power output, and emissions. Advanced testing equipment enables data analysis to identify areas for improvement and ensure regulatory compliance.
- Government regulations mandating upgrades to emission-compliant vehicles or the introduction of newer versions also contribute to the growth of the automotive powertrain testing market. OEMs must invest in testing services to stay competitive and meet evolving consumer demands and regulatory requirements. Powertrain testing is an essential process in the automotive industry, ensuring engine efficiency, power output, and emission compliance. The market for automotive powertrain testing is expected to grow due to the increasing demand for advanced technologies, stringent regulations, and the need for improved vehicle performance.
What are the Automotive Powertrain Testing Services market trends shaping the Industry?
- The development of advanced computer and IT-enabled powertrain testing systems is a significant market trend. This innovation facilitates more efficient and accurate testing processes in the automotive industry. Powertrain testing plays a crucial role in ensuring quality assurance in the automotive industry. Advanced testing solutions, such as drivetrain testing and powertrain calibration, are essential for optimizing engine performance and reducing emissions. Static testing and test management are integral parts of powertrain testing, enabling test automation and engineering services to streamline the testing process.
- This system offers the ability to examine test parameters, modify test conditions, monitor results, and investigate problems from a virtual environment, providing a more efficient and cost-effective testing solution. Powertrain testing continues to evolve, with a focus on improving test accuracy and reducing development time, making it an essential aspect of the automotive industry's ongoing innovation. One innovative development in powertrain testing is Ricardo Global Test Environment (GTE), which leverages secure networking and Internet-based technologies to create a remote access system for test and development engineers.
How does Automotive Powertrain Testing Services market face challenges during its growth?
- The capital-intensive nature of powertrain testing, which requires significant investments in facilities and equipment, poses a significant challenge to the growth of the industry. The market demands substantial investment due to the high cost of test cells, engine calibration equipment, test reporting systems, data acquisition systems, and NVH (Noise, Vibration, and Harshness) testing facilities. A single powertrain testing machine can cost between USD 500,000 and USD 1,000,000, and setting up a testing center adds to the overall expense. Given the expensive nature of this equipment, the market growth may be restrained.
- Dynamic testing, which involves testing the entire vehicle on a chassis dynamometer, is crucial for validating vehicle performance. Despite the challenges, the market offers significant opportunities for growth as the automotive industry continues to innovate and develop more efficient and environmentally friendly powertrains. Modern powertrain systems' complexity necessitates advanced instrumentation and test systems. Tier 1 suppliers and OEMs (Original Equipment Manufacturers) require these services to ensure their products meet SAE (Society of Automotive Engineers) standards and regulatory requirements, including emission norms and power efficiency mandates.
Exclusive Customer Landscape
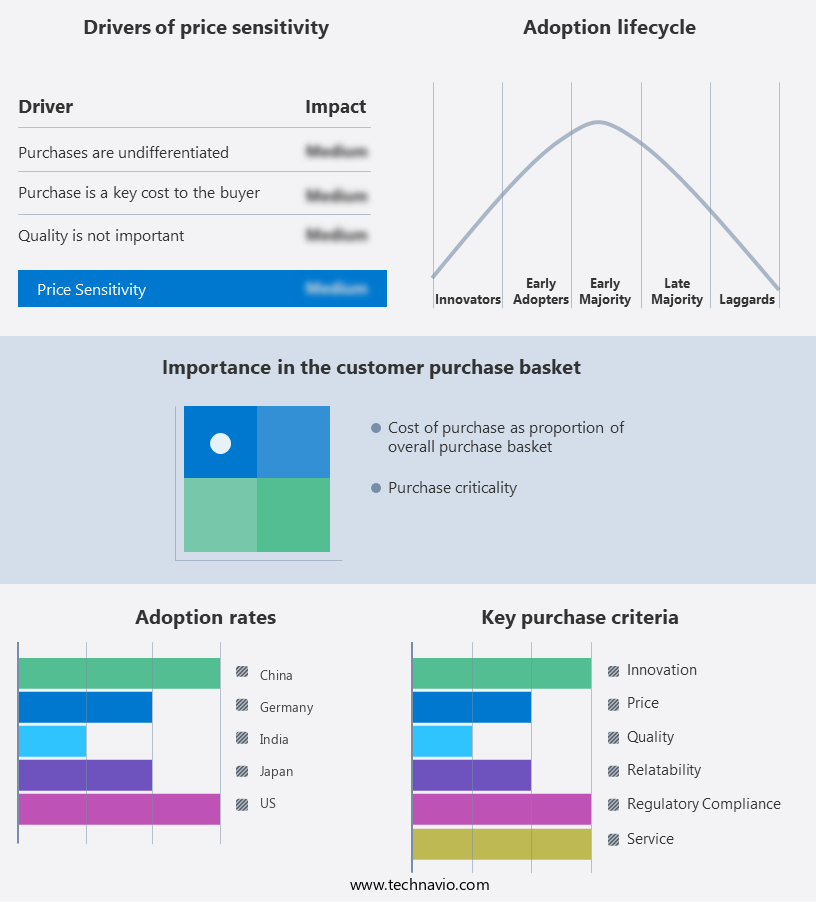
The automotive powertrain testing services market forecasting report includes the adoption lifecycle of the market, covering from the innovator's stage to the laggard's stage. It focuses on adoption rates in different regions based on penetration. Furthermore, the automotive powertrain testing services market report also includes key purchase criteria and drivers of price sensitivity to help companies evaluate and develop their market growth analysis strategies.
Customer Landscape
Key Companies & Market Insights
Companies are implementing various strategies, such as strategic alliances, automotive powertrain testing services market forecast, partnerships, mergers and acquisitions, geographical expansion, and product/service launches, to enhance their presence in the industry.
A and D HOLON Holdings Co. Ltd. - The company specializes in automotive powertrain testing services, utilizing advanced systems such as the AD-5435.
The industry research and growth report includes detailed analyses of the competitive landscape of the market and information about key companies, including:
- A and D HOLON Holdings Co. Ltd.
- Akkodis
- ATS Automation Tooling Systems Inc.
- AVL List GmbH
- Cambustion Ltd.
- Cosworth Group Holdings Ltd.
- FEV Group GmbH
- HORIBA Ltd.
- IAV GmbH
- Industrieanlagen Betriebsgesellschaft mbH
- Intertek Group Plc
- IPG Automotive GmbH
- MAHLE GmbH
- Mtech UK Associates Ltd.
- Mustang Advanced Engineering
- Ricardo Plc
- SGS SA
- TEOS Powertrain Engineering
- thyssenkrupp AG
Qualitative and quantitative analysis of companies has been conducted to help clients understand the wider business environment as well as the strengths and weaknesses of key industry players. Data is qualitatively analyzed to categorize companies as pure play, category-focused, industry-focused, and diversified; it is quantitatively analyzed to categorize companies as dominant, leading, strong, tentative, and weak.
Recent Development and News in Automotive Powertrain Testing Services Market
- In March 2024, Bosch Rexroth, a leading technology company, introduced its new modular test bench system for electric powertrains, enabling automakers to test various vehicle configurations and battery types in a single setup. This innovation significantly reduces the time and cost required for powertrain testing.
- In July 2024, AVL List GmbH, a global leader in powertrain technology, entered into a strategic partnership with Siemens Energy to jointly develop and commercialize advanced testing solutions for electrified powertrains. This collaboration combines AVL's expertise in powertrain testing and Siemens Energy's strengths in digitalization and automation, aiming to accelerate the transition to electric vehicles.
- In January 2025, Capco, a technology and consulting firm, announced a major investment in its automotive testing services division to expand its capabilities in digital testing, simulation, and validation for powertrains. This investment will help Capco better serve its clients by offering more comprehensive and advanced testing solutions.
- In March 2025, the European Union introduced new regulations requiring stricter emission standards for heavy-duty vehicles, including buses and trucks. These regulations will significantly increase the demand for advanced powertrain testing services to ensure compliance. This development represents a significant opportunity for market players to expand their offerings and grow their businesses.
Research Analyst Overview
The market is characterized by continuous evolution and dynamic market activities. Quality assurance plays a pivotal role in ensuring the reliability and efficiency of powertrains, with drivetrain testing and powertrain calibration being essential components. Static testing, test management, and engineering services are integral to the testing process, enabling the optimization of test cells and test facilities. Test automation, data acquisition systems, and test reporting facilitate efficient and accurate testing, while test analysis and road load simulation enable the assessment of powertrain performance under various conditions. Tier 1 suppliers and automotive OEMs rely on these services to meet stringent SAE and ISO standards for durability, reliability, fuel economy, and emission compliance.
Engine calibration and NVH testing are critical aspects of powertrain testing, ensuring optimal engine performance and reducing unwanted noise and vibration. Testing equipment and simulation testing enable the evaluation of powertrain components and systems under various conditions, providing valuable insights for design improvements. Consulting services offer expert guidance and support throughout the testing process, ensuring the highest standards of quality and compliance.
Dive into Technavio's strong research methodology, blending expert interviews, extensive data synthesis, and validated models for unparalleled Automotive Powertrain Testing Services Market insights. See full methodology.
|
Market Scope |
|
|
Report Coverage |
Details |
|
Page number |
214 |
|
Base year |
2024 |
|
Historic period |
2019-2023 |
|
Forecast period |
2025-2029 |
|
Growth momentum & CAGR |
Accelerate at a CAGR of 8.3% |
|
Market growth 2025-2029 |
USD 3 billion |
|
Market structure |
Fragmented |
|
YoY growth 2024-2025(%) |
7.7 |
|
Key countries |
China, US, Japan, India, South Korea, Canada, Australia, Germany, UK, and Brazil |
|
Competitive landscape |
Leading Companies, Market Positioning of Companies, Competitive Strategies, and Industry Risks |
What are the Key Data Covered in this Automotive Powertrain Testing Services Market Research and Growth Report?
- CAGR of the Automotive Powertrain Testing Services industry during the forecast period
- Detailed information on factors that will drive the growth and forecasting between 2025 and 2029
- Precise estimation of the size of the market and its contribution of the industry in focus to the parent market
- Accurate predictions about upcoming growth and trends and changes in consumer behaviour
- Growth of the market across APAC, North America, Europe, South America, and Middle East and Africa
- Thorough analysis of the market's competitive landscape and detailed information about companies
- Comprehensive analysis of factors that will challenge the automotive powertrain testing services market growth of industry companies
We can help! Our analysts can customize this automotive powertrain testing services market research report to meet your requirements.
 RIA -
RIA - 
