
Threat Detection Systems Market Size 2025-2029
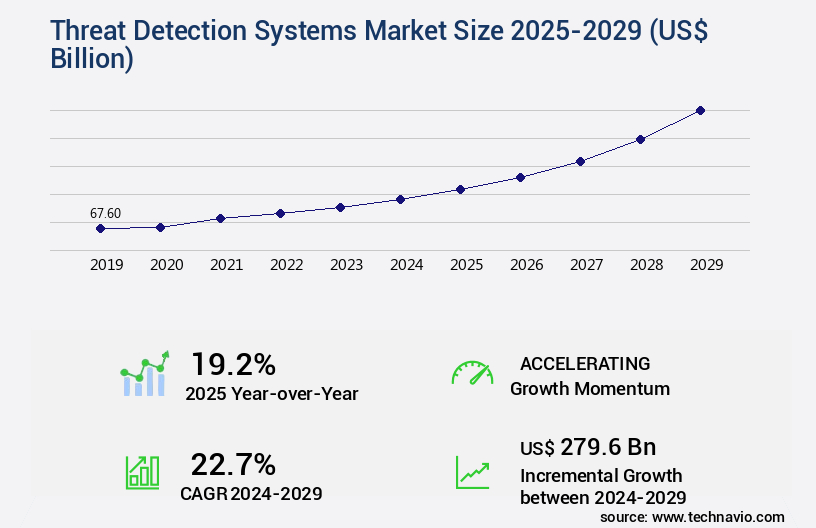
The threat detection systems market size is valued to increase USD 279.6 billion, at a CAGR of 22.7% from 2024 to 2029. Increasing number of terrorist activities will drive the threat detection systems market.
Major Market Trends & Insights
- Europe dominated the market and accounted for a 38% growth during the forecast period.
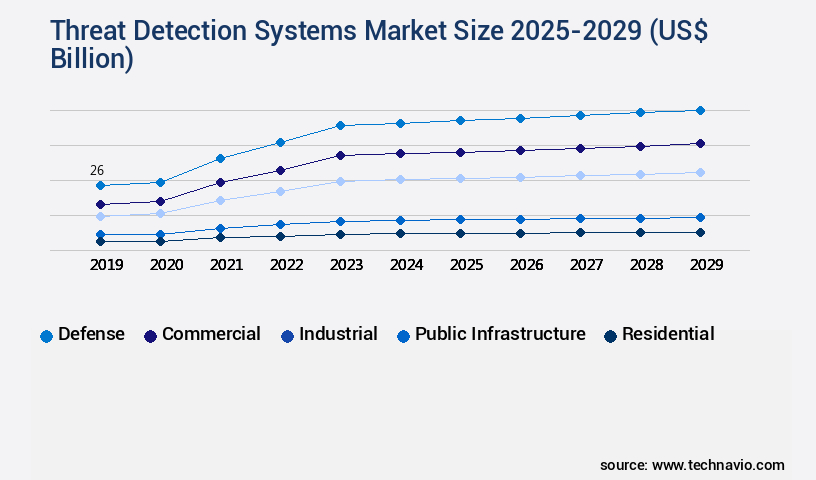
- By Application - Defense segment was valued at USD 26.00 billion in 2023
- By Type - Hardware segment accounted for the largest market revenue share in 2023
Market Size & Forecast
- Market Opportunities: USD 546.15 billion
- Market Future Opportunities: USD 279.60 billion
- CAGR from 2024 to 2029 : 22.7%
Market Summary
- The market witnesses continuous expansion due to the escalating number of security threats, particularly in the digital realm. Advanced technologies, such as artificial intelligence (AI) and machine learning, are increasingly adopted to enhance system efficiency and accuracy. These solutions analyze vast amounts of data in real-time, enabling early threat identification and mitigation. However, the high cost of implementing and maintaining these systems poses a significant challenge for organizations, particularly smaller ones. According to a recent report, The market is projected to reach a value of USD42.6 billion by 2026, underpinned by the growing demand for advanced security solutions.
- Despite this growth, market players must address concerns around data privacy and the potential for false positives, which can lead to unnecessary alerts and wasted resources. The integration of AI and machine learning algorithms is expected to mitigate these issues, offering more accurate and targeted threat detection. Ultimately, the market's future direction lies in the ability to provide comprehensive, real-time threat intelligence while ensuring user privacy and minimizing false positives.
What will be the Size of the Threat Detection Systems Market during the forecast period?
Get Key Insights on Market Forecast (PDF) Request Free Sample
How is the Threat Detection Systems Market Segmented ?
The threat detection systems industry research report provides comprehensive data (region-wise segment analysis), with forecasts and estimates in "USD billion" for the period 2025-2029, as well as historical data from 2019-2023 for the following segments.
- Application
- Defense
- Commercial
- Industrial
- Public infrastructure
- Residential
- Type
- Hardware
- Software
- Services
- Technology
- X-ray screening
- Metal detection
- Explosive detection
- Biometric systems
- Others
- Geography
- North America
- US
- Canada
- Europe
- France
- Germany
- Italy
- The Netherlands
- UK
- APAC
- China
- India
- Japan
- Rest of World (ROW)
- North America
By Application Insights
The defense segment is estimated to witness significant growth during the forecast period.
In the ever-evolving landscape of cybersecurity, the market plays a pivotal role in safeguarding critical infrastructure and organizations against malicious threats. With the increasing prevalence of malware, machine learning and artificial intelligence have emerged as key technologies in security monitoring, anomaly detection, and intrusion prevention. Security teams employ these advanced methods to analyze patterns, recognize threats, and respond effectively to incidents. Access control, cloud security, log management, and security auditing are essential components of a comprehensive threat detection strategy. Artificial intelligence and statistical modeling enable the identification of potential threats through behavior analysis, threat intelligence, and data governance.
Meanwhile, endpoint security, red teaming, penetration testing, and vulnerability management ensure the protection of critical data and systems. The importance of threat detection systems is underscored by the fact that 60% of organizations experienced a data breach in the past year, according to a recent study. As cyber threats continue to evolve, defense forces and high-security installations must remain vigilant, utilizing the latest technologies and best practices to maintain a strong security posture. Compliance standards, incident response, and event management are crucial elements of this ongoing effort. In the face of evolving threats, the market will continue to grow and adapt, ensuring the protection of critical assets and maintaining peace of mind for organizations and governments alike.
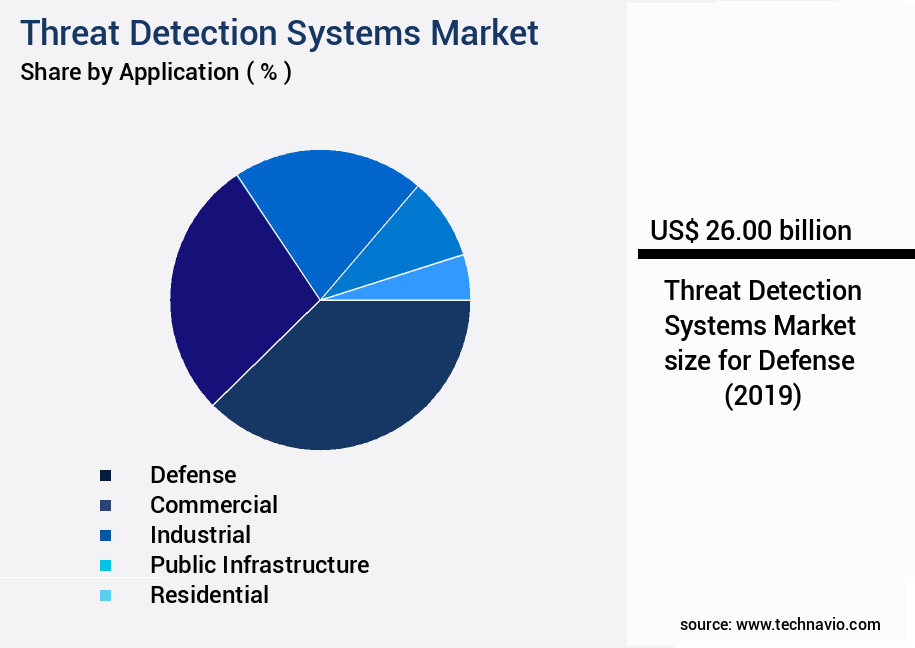
The Defense segment was valued at USD 26.00 billion in 2019 and showed a gradual increase during the forecast period.
Regional Analysis
Europe is estimated to contribute 38% to the growth of the global market during the forecast period.Technavio’s analysts have elaborately explained the regional trends and drivers that shape the market during the forecast period.
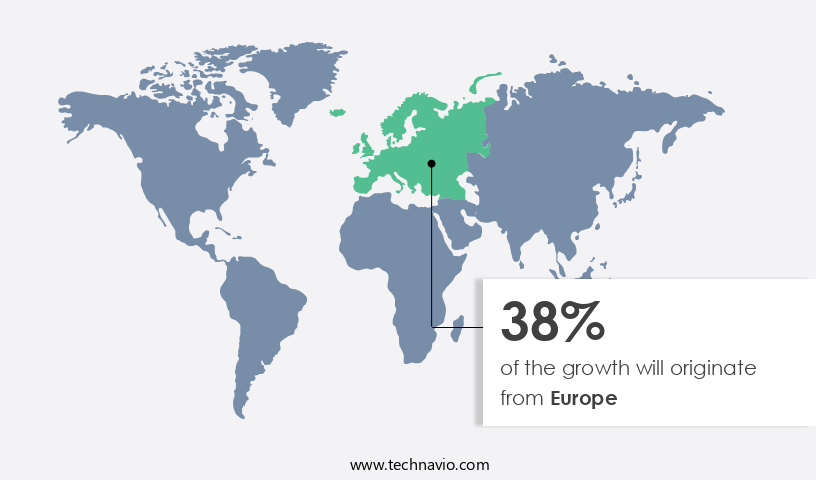
See How Threat Detection Systems Market Demand is Rising in Europe Request Free Sample
The North American the market is experiencing significant growth, driven by the region's technological advancements and the presence of numerous well-established companies. With a high adoption rate of emerging technologies and increasing investment in research and development, this market is poised for continued expansion. Major players in the North American market include RAE Systems, FLIR Systems, ChemImage Corp., and Vectra AI Inc. These companies, along with a focus on innovation, particularly in high-energy laser systems, will enhance the reliability and efficiency of threat detection systems, further fueling demand.
Market Dynamics
Our researchers analyzed the data with 2024 as the base year, along with the key drivers, trends, and challenges. A holistic analysis of drivers will help companies refine their marketing strategies to gain a competitive advantage.
The market is witnessing significant growth as organizations increasingly prioritize securing their digital assets against advanced persistent threats (APTs) and network intrusions. Deployment of network intrusion detection systems (NIDS) and endpoint detection response (EDR) systems is becoming standard practice, with many companies integrating advanced security information event management (SIEM) systems to enhance their threat detection capabilities. Machine learning algorithms are at the forefront of threat detection, enabling the identification of anomalous behavior and malware through behavior analysis techniques and pattern recognition methods. Security awareness training programs and authentication authorization frameworks are essential components of a robust threat detection strategy.
Integration of threat intelligence platforms further bolsters these efforts, providing real-time insights into emerging threats and vulnerabilities. The vulnerability assessment remediation lifecycle plays a crucial role in minimizing risk, ensuring that organizations are proactive in addressing potential weaknesses. Cloud security posture management best practices, such as zero trust architecture design implementation, are gaining popularity as businesses increasingly adopt cloud services. In fact, more than 60% of organizations are expected to have adopted a zero trust model by 2023, compared to just 13% in 2018. This represents a significant shift in security priorities, as companies recognize the importance of securing their digital assets from both internal and external threats.
The performance metrics of anomaly detection algorithms and statistical modeling techniques in cyber threat analysis are crucial indicators of a system's effectiveness. Penetration testing methodologies are also essential for assessing risk and ensuring compliance with various regulatory frameworks. Forensic analysis techniques, which enable the collection and interpretation of digital evidence, are increasingly important for incident response plan development and execution, as well as data loss prevention policy enforcement. In conclusion, the market is experiencing rapid growth as organizations invest in advanced technologies and strategies to protect their digital assets from a diverse range of threats.
The integration of machine learning algorithms, threat intelligence platforms, and security awareness training programs, among other solutions, is essential for maintaining a strong security posture in today's complex threat landscape.
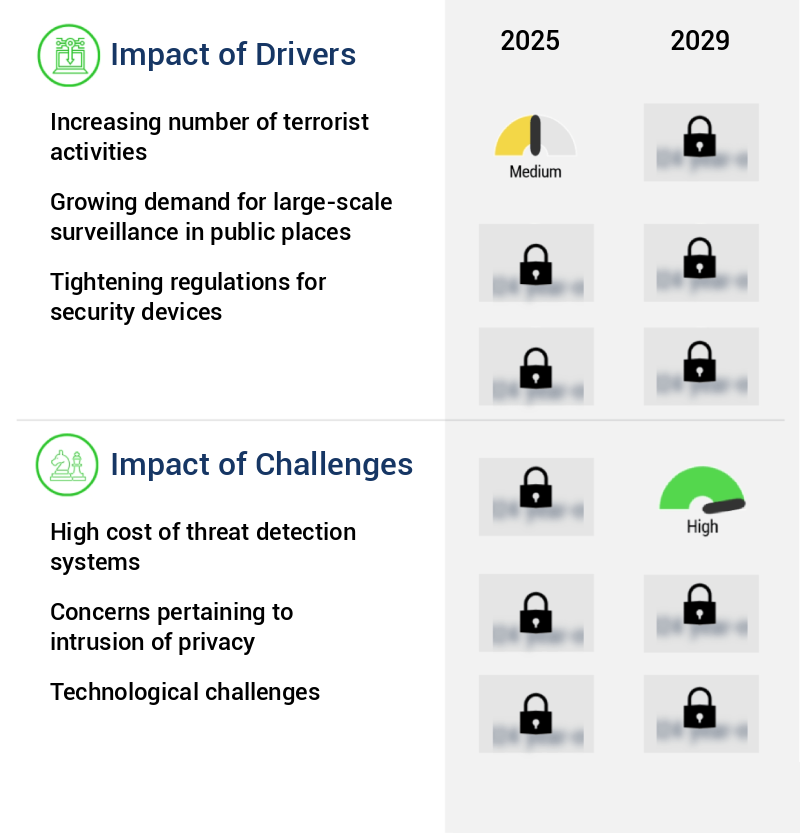
What are the key market drivers leading to the rise in the adoption of Threat Detection Systems Industry?
- The surge in terrorist activities serves as the primary catalyst for market instability and growth in the security industry.
- The global threat detection market is experiencing significant growth due to escalating geopolitical instability and the increasing number of terrorist activities. This trend is observed across various territories, necessitating advanced security solutions. Threat detection systems have become indispensable in preventing potential incidents, as they can identify weapons or suspicious objects. For instance, metal detectors are commonly used to screen for bombs or firearms in public areas, while advanced radar systems can detect aerial threats.
- The importance of these systems is underscored by the rising number of terrorist attacks worldwide, which underscores the need for enhanced security measures. This dynamic market continues to evolve, with ongoing research and development leading to more sophisticated threat detection technologies.
What are the market trends shaping the Threat Detection Systems Industry?
- The use of emerging technologies is becoming mandatory for increasing efficiency in the market trend. Emerging technologies are essential for enhancing market efficiency.
- In today's dynamic business landscape, technologies continue to reshape various industries, enhancing productivity and efficiency. Threat detection systems, a crucial component in ensuring security, are witnessing significant advancements. With the proliferation of wireless technology, an increasing number of devices and systems are being interconnected, necessitating flexible, adaptive security solutions. The evolving threat landscape poses severe challenges for manufacturers, driving the development of sophisticated threat detection techniques. These systems play a pivotal role in safeguarding against potential risks, making them indispensable across numerous sectors.
- The integration of machine learning and artificial intelligence algorithms enables threat detection systems to analyze vast amounts of data and identify anomalous patterns, enhancing their accuracy and effectiveness. The adoption of these systems is on the rise, as businesses recognize the importance of proactively addressing potential threats to maintain operational continuity and protect their assets.
What challenges does the Threat Detection Systems Industry face during its growth?
- The escalating costs of implementing and maintaining threat detection systems pose a significant challenge to the industry's growth trajectory.
- The market faces a significant challenge due to the high implementation costs. This expense hinders companies from integrating new technologies for threat detection. The cost of deploying these systems depends on several factors, including the degree of integration, essential functionalities, and the number of devices to be connected. A high level of integration is necessary for seamless threat detection, which increases costs further. Hardware costs are a considerable portion of the total implementation expense. They encompass the price of sensors, switches, and other physical components.
- Despite the challenges, the market for threat detection systems continues to evolve, with ongoing activities and emerging patterns. Companies are investing in advanced technologies like artificial intelligence, machine learning, and the Internet of Things (IoT) to enhance their threat detection capabilities. These innovations aim to reduce costs and improve efficiency, making threat detection systems more accessible to businesses of all sizes.
Exclusive Technavio Analysis on Customer Landscape
The threat detection systems market forecasting report includes the adoption lifecycle of the market, covering from the innovator’s stage to the laggard’s stage. It focuses on adoption rates in different regions based on penetration. Furthermore, the threat detection systems market report also includes key purchase criteria and drivers of price sensitivity to help companies evaluate and develop their market growth analysis strategies.
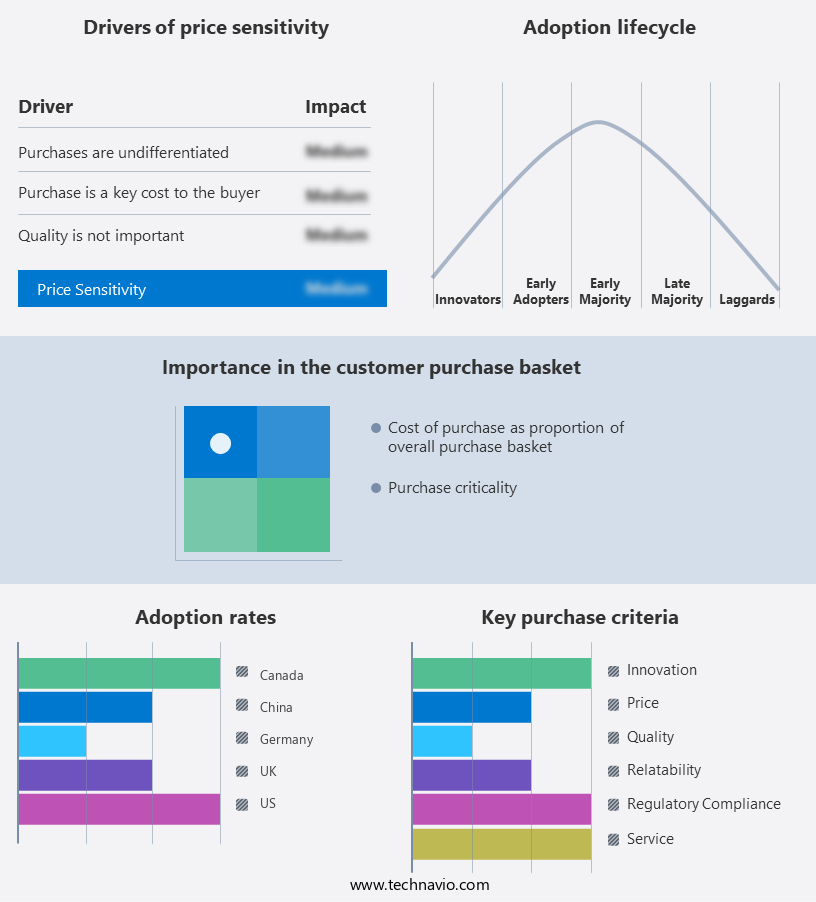
Customer Landscape of Threat Detection Systems Industry
Competitive Landscape
Companies are implementing various strategies, such as strategic alliances, threat detection systems market forecast, partnerships, mergers and acquisitions, geographical expansion, and product/service launches, to enhance their presence in the industry.
Alert Logic Inc. - The company provides advanced threat detection systems, including Amazon GuardDuty and AWS Security Hub, enhancing security posture for businesses by continuously monitoring and analyzing data to identify and respond to potential security threats.
The industry research and growth report includes detailed analyses of the competitive landscape of the market and information about key companies, including:
- Alert Logic Inc.
- Amazon.com Inc.
- Axis Communications AB
- ChemImage Corp.
- Corptz
- Fortra LLC
- Group IB Service Ltd
- Honeywell International Inc.
- LogRhythm Inc.
- Mirion Technologies Inc.
- OSI Systems Inc.
- PerimeterX Inc.
- Safran SA
- Smiths Group Plc
- Stellar Cyber
- Synapse Technology Corp.
- Teledyne Technologies Inc.
- Thales Group
- Vectra AI Inc.
Qualitative and quantitative analysis of companies has been conducted to help clients understand the wider business environment as well as the strengths and weaknesses of key industry players. Data is qualitatively analyzed to categorize companies as pure play, category-focused, industry-focused, and diversified; it is quantitatively analyzed to categorize companies as dominant, leading, strong, tentative, and weak.
Recent Development and News in Threat Detection Systems Market
- In January 2024, Palo Alto Networks, a leading cybersecurity company, announced the launch of its new cloud-based threat detection system, Cortex XDR, designed to detect, investigate, and respond to advanced threats across multiple vectors (Palo Alto Networks Press Release, 2024). In March 2024, IBM Security and Microsoft announced a strategic partnership to integrate IBM's QRadar threat detection platform with Microsoft's Azure Sentinel, enhancing their joint offerings and expanding their market reach (IBM Security Press Release, 2024). In April 2025, CrowdStrike Holdings raised USD1.1 billion in an initial public offering (IPO), marking a significant milestone in the market and increasing the company's market capitalization (Reuters, 2025). In May 2025, the European Union's General Data Protection Regulation (GDPR) was updated to include mandatory breach reporting for IoT devices, driving increased demand for advanced threat detection systems in the European market (European Commission, 2025).
Dive into Technavio’s robust research methodology, blending expert interviews, extensive data synthesis, and validated models for unparalleled Threat Detection Systems Market insights. See full methodology.
|
Market Scope |
|
|
Report Coverage |
Details |
|
Page number |
238 |
|
Base year |
2024 |
|
Historic period |
2019-2023 |
|
Forecast period |
2025-2029 |
|
Growth momentum & CAGR |
Accelerate at a CAGR of 22.7% |
|
Market growth 2025-2029 |
USD 279.6 billion |
|
Market structure |
Fragmented |
|
YoY growth 2024-2025(%) |
19.2 |
|
Key countries |
US, Germany, Canada, China, UK, France, Japan, India, The Netherlands, and Italy |
|
Competitive landscape |
Leading Companies, Market Positioning of Companies, Competitive Strategies, and Industry Risks |
Research Analyst Overview
- Amidst the ever-evolving digital landscape, the market continues to gain significance as businesses strive to fortify their cybersecurity posture. This domain encompasses a diverse range of solutions, including malware analysis, machine learning, security monitoring, anomaly detection, access control, and more. Machine learning plays a pivotal role in enhancing threat detection capabilities by enabling systems to learn from historical data and identify patterns indicative of potential threats. Security monitoring, meanwhile, offers real-time visibility into network activities, helping organizations proactively address emerging risks. Anomaly detection, powered by artificial intelligence and statistical modeling, is another critical component, capable of identifying unusual behavior that deviates from established norms.
- Furthermore, cloud security, log management, and security auditing are essential elements that fortify an organization's security infrastructure. The integration of threat intelligence and security information further bolsters these systems, providing valuable context and insights to enable more informed decision-making. Endpoint security, red teaming, and penetration testing are additional measures designed to safeguard against advanced threats. Data loss prevention, threat modeling, vulnerability management, and security awareness training are also crucial aspects of a robust threat detection strategy. As the market continues to evolve, the integration of advanced technologies like deep learning, behavior analysis, and data governance will further refine threat detection systems, ensuring organizations remain protected against an increasingly complex threat landscape.
- Notably, machine learning algorithms are projected to account for over 20% of the total the market share by 2025, underscoring their growing importance in the cybersecurity ecosystem.
What are the Key Data Covered in this Threat Detection Systems Market Research and Growth Report?
-
What is the expected growth of the Threat Detection Systems Market between 2025 and 2029?
-
USD 279.6 billion, at a CAGR of 22.7%
-
-
What segmentation does the market report cover?
-
The report is segmented by Application (Defense, Commercial, Industrial, Public infrastructure, and Residential), Type (Hardware, Software, and Services), Technology (X-ray screening, Metal detection, Explosive detection, Biometric systems, and Others), and Geography (North America, Europe, APAC, Middle East and Africa, and South America)
-
-
Which regions are analyzed in the report?
-
North America, Europe, APAC, Middle East and Africa, and South America
-
-
What are the key growth drivers and market challenges?
-
Increasing number of terrorist activities, High cost of threat detection systems
-
-
Who are the major players in the Threat Detection Systems Market?
-
Alert Logic Inc., Amazon.com Inc., Axis Communications AB, ChemImage Corp., Corptz, Fortra LLC, Group IB Service Ltd, Honeywell International Inc., LogRhythm Inc., Mirion Technologies Inc., OSI Systems Inc., PerimeterX Inc., Safran SA, Smiths Group Plc, Stellar Cyber, Synapse Technology Corp., Teledyne Technologies Inc., Thales Group, and Vectra AI Inc.
-
Market Research Insights
- The market is a critical component of modern security architecture, with organizations continually investing in advanced solutions to enhance their security posture. Real-time monitoring and risk scoring are essential features, enabling swift mitigation strategies against potential threats. According to industry estimates, the market for threat detection systems is projected to reach USD30 billion by 2025, representing a significant growth from the current USD15 billion. Heuristic analysis, signature detection, and user behavior are among the primary techniques used in threat detection. Heuristic analysis employs machine learning algorithms to identify anomalous behavior, while signature detection relies on known attack patterns.
- User behavior analysis monitors user activity to detect unauthorized access or suspicious behavior. A well-designed threat detection system can achieve a detection accuracy of up to 98%, significantly reducing false positive rates. Effective threat detection systems employ a combination of techniques, including system logs, access logs, network traffic analysis, and sandboxing techniques. Threat actors continually evolve their attack vectors, necessitating the use of multiple detection methods and continuous updates to authorization policies and authentication protocols. Rapid response time, incident tracking, and data masking are also crucial elements of a robust security architecture. Vulnerability patching and key management are ongoing tasks to maintain a strong security posture.
We can help! Our analysts can customize this threat detection systems market research report to meet your requirements.
 RIA -
RIA - 
