Aronia Berries Market Analysis, Size, and Forecast 2024-2028: North America (Canada), Europe (France, Germany, Italy, and UK), Middle East and Africa (Egypt, KSA, Oman, and UAE), APAC (China, India, and Japan), South America (Argentina and Brazil), and Rest of World (ROW)

Aronia Berries Market Analysis, Size, and Forecast 2024-2028:
North America (Canada), Europe (France, Germany, Italy, and UK), Middle East and Africa (Egypt, KSA, Oman, and UAE), APAC (China, India, and Japan), South America (Argentina and Brazil), and Rest of World (ROW)

Published: May 2024 158 Pages SKU: IRTNTR46696

Market Overview at a Glance

$501.5 Mn
Market Opportunity
9.64%
CAGR
8.57
YoY growth 2023-2024(%)

Aronia Berries Market Size 2024-2028

The aronia berries market size is forecast to increase by USD 501.5 million, at a CAGR of 9.64% between 2023 and 2028.

  • Aronia berries, renowned for their potent health benefits, are gaining significant attention in the global food and beverage industry. These berries are rich in antioxidants, vitamin C, and anthocyanins, making them an ideal addition to various food and beverage products. A key market trend driving the growth of the market is the increasing demand for plant-based beverages. However, the high ownership cost of aronia berries poses a significant challenge for market expansion. Producers must address this obstacle through innovative farming techniques, bulk production, and price negotiation to ensure competitiveness. Companies seeking to capitalize on this market opportunity should focus on developing value-added products, such as functional foods and beverages, to cater to the health-conscious consumer base.
  • Navigating the challenges and leveraging the trends will be crucial for businesses aiming to establish a strong presence in the market.

What will be the Size of the Aronia Berries Market during the forecast period?

Aronia Berries Market Size

Explore in-depth regional segment analysis with market size data - historical 2018-2022 and forecasts 2024-2028 - in the full report.  
Request Free Sample

Aronia berries, also known as chokeberries, have gained significant attention in the global market due to their numerous health benefits and versatile applications. The market dynamics of aronia berries continue to evolve, driven by ongoing research and development in various sectors. Supply chain efficiency is a critical factor in the aronia berry market. From cultivation to processing, various strategies are employed to optimize the supply chain. Irrigation scheduling and sustainable farming practices ensure optimal crop yield and quality. Plant breeding programs focus on developing new varieties with improved nutritional composition and functional food ingredient properties. Antioxidant capacity assay is a crucial aspect of aronia berry processing, as it determines the berries' health benefits.

Economic viability assessments help farmers and processors make informed decisions regarding crop rotation benefits, fertilizer optimization, and weed management strategies. Distribution channels are expanding, with value-added products such as juices, jams, and supplements gaining popularity. Functional food ingredients derived from aronia berries are used in various industries, including food and beverage, pharmaceuticals, and cosmetics. Market demand forecasting is essential to understanding the evolving market trends. Climate change adaptation strategies are being explored to mitigate the impact on aronia berry cultivation. Quality preservation methods, including packaging technologies and post-harvest handling, are crucial to maintaining the berries' nutritional value and functional properties.

Food safety regulations and quality control standards are increasingly important in the aronia berry market. Fruit ripening stages and anthocyanin concentration are closely monitored to ensure consistent product quality. Berry polyphenol extraction techniques are being refined to maximize the health benefits of aronia berries. In the realm of aronia berry cultivation, soil nutrient management and climate change adaptation are essential to maintaining optimal growing conditions. Quality control standards and fruit ripening stages are closely monitored to ensure consistent product quality. The ongoing research and development in these areas continue to drive the evolving aronia berry market.

How is this Aronia Berries Industry segmented?

The aronia berries industry research report provides comprehensive data (region-wise segment analysis), with forecasts and estimates in "USD million" for the period 2024-2028, as well as historical data from 2018-2022 for the following segments.

  • Source
    • Conventional
    • Organic
  • Distribution Channel
    • Offline
    • Online
  • Product Type
    • Fresh Berries
    • Dried Berries
    • Juice
    • Powder
    • Extracts
  • Application
    • Food & Beverages
    • Dietary Supplements
    • Cosmetics
    • Pharmaceuticals
  • Geography
    • North America
      • US
      • Canada
    • Europe
      • France
      • Germany
      • Italy
      • UK
    • Middle East and Africa
      • Egypt
      • KSA
      • Oman
      • UAE
    • APAC
      • China
      • India
      • Japan
    • South America
      • Argentina
      • Brazil
    • Rest of World (ROW)

By Source Insights

The conventional segment is estimated to witness significant growth during the forecast period.

Aronia berries, also known as chokeberries, are grown using both conventional and sustainable farming practices. Conventional farming involves the use of synthetic fertilizers, pesticides, and herbicides, while sustainable farming focuses on natural methods for soil nutrient management and weed control. Sustainable farming practices are gaining popularity due to consumer preference for healthier and more environmentally-friendly food options. Health benefits research continues to drive market demand for aronia berries, with studies highlighting their high antioxidant capacity and nutritional value. Plant breeding programs are also focused on improving aronia berry genetics to increase yield and enhance functional food ingredient properties.

Food safety regulations are a crucial consideration in aronia berry processing, with strict quality control standards in place to ensure consumer safety. Harvesting techniques and post-harvest handling methods are also important to maintain product shelf life and preserve quality. Fertilizer optimization and climate change adaptation are key areas of focus for aronia berry cultivation, with farmers implementing crop rotation and soil nutrient management strategies to improve yield and reduce environmental impact. Market demand forecasting and supply chain efficiency are also essential for economic viability assessment. Food processing technology plays a significant role in aronia berry processing, with advanced techniques used for berry polyphenol extraction and packaging technologies to extend product shelf life.

Antioxidant capacity assays are used to assess the quality of aronia berries and ensure consistent product standards. Weed management strategies and fruit ripening stages are critical factors in aronia berry cultivation, with farmers using natural methods to control weeds and optimize crop growth. Quality preservation methods and distribution channels are also important considerations for value-added products and consumer preference analysis. In conclusion, the market is characterized by a focus on sustainable farming practices, health benefits research, and consumer preference analysis. Food safety regulations, food processing technology, and market demand forecasting are also crucial factors driving market growth.

Farmers are implementing fertilizer optimization, climate change adaptation, and crop rotation benefits to improve yield and reduce environmental impact. Quality preservation methods, value-added products, and distribution channels are essential for maintaining product quality and meeting consumer demand.

Aronia Berries Market Size

Request Free Sample

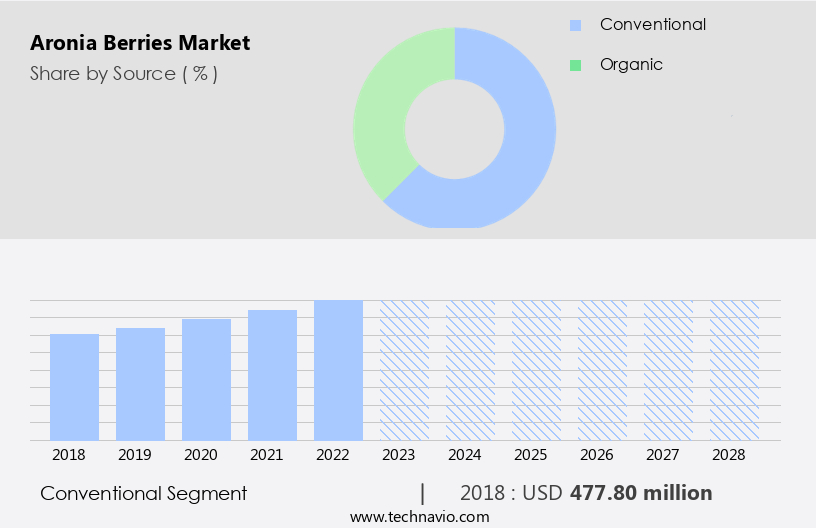
The Conventional segment was valued at USD 477.80 million in 2018 and showed a gradual increase during the forecast period.

Regional Analysis

Europe is estimated to contribute 33% to the growth of the global market during the forecast period.Technavio's analysts have elaborately explained the regional trends and drivers that shape the market during the forecast period.

Aronia Berries Market Share by Geography

 Request Free Sample

The European market is experiencing notable growth due to escalating consumer preference for healthy, organic food, particularly among the vegan population. In countries like Germany, France, the UK, and the Netherlands, veganism is gaining popularity, leading to increased demand for aronia berries in various forms, including juices and concentrates. The superfood trend is another significant driver, as aronia berries are rich in nutrients. Sustainable farming practices and genetics play a crucial role in aronia berry cultivation. Irrigation scheduling and soil nutrient management ensure optimal yield. Plant breeding programs and fertilizer optimization contribute to higher aronia berry yields.

Food safety regulations and quality control standards ensure the production of safe and high-quality aronia berries. Harvesting techniques and post-harvest handling methods preserve the berries' nutritional value and extend their shelf life. Food processing technology, such as berry polyphenol extraction and packaging technologies, enhance the market's value-added products. Climate change adaptation strategies and crop rotation benefits ensure the long-term economic viability of the aronia berry market. Market demand forecasting and supply chain efficiency help maintain a consistent supply of aronia berries. Consumer preference analysis and health benefits research continue to fuel the market's growth. Weed management strategies and quality preservation methods ensure the berries' optimal ripening stages.

Antioxidant capacity assay and nutritional composition analysis further highlight aronia berries' functional food ingredient potential.

Market Dynamics

The Global Aronia Berries Market is growing steadily, with aronia berries, particularly black chokeberry and aronia melanocarpa, gaining popularity for their health benefits. Organic aronia berries, aronia berry powder, and aronia berry juice are key products driving global aronia berry demand. Aronia berry supplements, aronia berry in functional foods, and aronia berry in nutraceuticals cater to wellness-focused consumers. Aronia berry market trends highlight aronia berries in online retail growth, supported by aronia berry clean label preferences. Aronia berry health benefits for immunity boost appeal, while sustainable aronia berry farming practices align with eco-conscious trends. Long-tail trends like organic aronia berries trends and aronia berry supplements market growth underscore the market's potential in health-focused applications.

Our researchers analyzed the data with 2023 as the base year, along with the key drivers, trends, and challenges. A holistic analysis of drivers will help companies refine their marketing strategies to gain a competitive advantage.

What are the key market drivers leading to the rise in the adoption of Aronia Berries Industry?

  • The health benefits associated with aronia berries serve as the primary driver for the market's growth. 
  • Aronia berries, renowned for their rich nutritional profile and numerous health benefits, are gaining popularity in the global market. These berries, brimming with essential nutrients, offer significant antioxidant properties and higher levels of polyphenols and anthocyanins than other berries. Sustainable farming practices, including irrigation scheduling, ensure the optimal growth of aronia berries. Research into the health benefits of aronia berries continues to expand, fueling consumer preference. The berries' potential to improve blood circulation, prevent free radical formation, and aid in wound healing are just a few of their health advantages. Food safety regulations are stringently enforced during aronia berry processing and harvesting techniques to maintain the highest standards.
  • The market for aronia berries is driven by the increasing awareness of their health benefits and the growing demand for natural and organic food products. As a result, aronia berry processing companies are investing in advanced technology and research to cater to this growing market. The focus on sustainable farming practices and adherence to food safety regulations further strengthen the market's growth potential.

What are the market trends shaping the Aronia Berries Industry?

  • The increasing popularity of plant-based beverages represents a significant market trend. This growing demand stems from consumers' increasing awareness of health and sustainability concerns.
  • Aronia berries, a popular ingredient in plant-based beverages, experience growing market demand due to the global shift towards healthier alternatives to traditional sugary and aerated drinks. This trend is driven by an increasing number of health-conscious consumers and a rise in the population adhering to vegan diets. Aronia berry cultivation has gained significance due to its nutritional benefits and potential use in food processing technology. Weed management strategies and fertilizer optimization are crucial for maximizing aronia berry yield. Product shelf life is another essential factor that food processing companies focus on to ensure the quality and freshness of aronia berry juices and concentrates.
  • Plant breeding programs are underway to develop new aronia berry varieties with improved yield, disease resistance, and desirable taste and color profiles. Market demand forecasting is essential to help businesses plan their production and inventory levels, ensuring they meet consumer demand while minimizing waste.

What challenges does the Aronia Berries Industry face during its growth?

  • The high ownership cost is a significant challenge impeding the growth of the aronia berry industry. 
  • Aronia berries, a potent source of antioxidants, present an intriguing opportunity for the market, despite their higher cost compared to other berries. The average cost of aronia berries, approximately USD7.50 per pound, is influenced by their high production costs, low yield, and limited cultivation area. The antioxidant capacity assay of aronia berries is a significant factor driving their demand as a functional food ingredient. Efficient supply chain management is crucial to maintaining their value in the market. Crop rotation benefits, including improved soil health and reduced pest infestation, contribute to the long-term economic viability assessment of aronia berry farming.
  • The nutritional composition of aronia berries, rich in polyphenols and anthocyanins, makes them an attractive addition to value-added products in the food and beverage industry. Effective distribution channels are essential to ensure the availability and accessibility of aronia berries to consumers, further enhancing their market potential.

Exclusive Customer Landscape

The aronia berries market forecasting report includes the adoption lifecycle of the market, covering from the innovator's stage to the laggard's stage. It focuses on adoption rates in different regions based on penetration. Furthermore, the aronia berries market report also includes key purchase criteria and drivers of price sensitivity to help companies evaluate and develop their market growth analysis strategies.

Aronia Berries Market Share by Geography

 Customer Landscape

Key Companies & Market Insights

Companies are implementing various strategies, such as strategic alliances, aronia berries market forecast, partnerships, mergers and acquisitions, geographical expansion, and product/service launches, to enhance their presence in the industry.

 Aronia for life - This company specializes in the development and distribution of innovative sports products, catering to various markets and customer needs. 

The industry research and growth report includes detailed analyses of the competitive landscape of the market and information about key companies, including:

  •  Aronia for life
  • Akron Apple and Aronia Inc.
  • Akronia Valley LLC
  • ArmedinaUSA
  • Aronia Ireland Ltd.
  • Bio Poland sp. z o.o.
  • BioActor BV
  • Brownwood Acres
  • Erbology
  • GreenField Sp zoo Spk
  • J and J Aronia BC
  • Maes Health and Wellness LLC
  • Microstructure sp z oo
  • OPG Medic
  • PowerfulBerry.com
  • PPHU Bio Juice Piotr Michalak
  • Rabenhorst
  • Sawmill Hollow
  • Schade Vineyard and Winery
  • TECOFOOD sp

Qualitative and quantitative analysis of companies has been conducted to help clients understand the wider business environment as well as the strengths and weaknesses of key industry players. Data is qualitatively analyzed to categorize companies as pure play, category-focused, industry-focused, and diversified; it is quantitatively analyzed to categorize companies as dominant, leading, strong, tentative, and weak.

Recent Development and News in Aronia Berries Market

  • In January 2024, Aronomex, a leading aronia berry processor, announced the launch of its new line of organic aronia berry juice concentrates, targeting the growing demand for organic and functional food products (Aronomex Press Release).
  • In March 2024, AroniaCare, a major aronia berry supplier, entered into a strategic partnership with a leading European supermarket chain, expanding its market reach and increasing sales volume (AroniaCare Press Release).
  • In April 2025, Aronia Bioactives, a key player in the aronia berry extract market, secured a USD10 million Series B funding round, which will be used to expand production capacity and accelerate research and development efforts (Crunchbase).
  • In May 2025, the European Food Safety Authority (EFSA) granted a health claim for aronia berries, stating that their regular consumption contributes to the reduction of oxidative stress and the maintenance of normal blood cholesterol levels, further boosting market growth (EFSA Press Release).

Research Analyst Overview

  • Aronia berries, a popular superfruit, are gaining traction in the global market due to their high proanthocyanidin levels and various health benefits. The market for aronia berries is driven by increasing consumer demand for natural, functional foods and beverages. Growth habit analysis and fruit size distribution are crucial factors influencing the cultivation of different aronia berry varieties. Water usage efficiency and maturity indices are essential considerations for farmers to optimize planting density and minimize environmental impact. Packaging optimization, energy consumption, and shelf-life extension are critical aspects of the aronia berry supply chain. Producers are focusing on reducing carbon footprint by implementing sustainable practices, such as waste valorization through powder production and by-product utilization.
  • Environmental impact and storage conditions significantly affect the cost of production and profitability margins. Economic analysis and sensory evaluation are essential tools for assessing the market competitiveness of different aronia berry products. Juice extraction methods, extract standardization, and bioactive compound stability are key factors influencing the quality and market value of aronia berry products. The use of freeze-drying techniques and total phenolic content quantification are essential for maintaining the stability of these bioactive compounds during processing and storage. Sustainability metrics, such as carbon footprint reduction and energy consumption efficiency, are increasingly important for aronia berry producers to meet consumer demands for eco-friendly and sustainable products.
  • By addressing these market trends and challenges, the aronia berry industry is poised for continued growth and innovation.

Dive into Technavio's robust research methodology, blending expert interviews, extensive data synthesis, and validated models for unparalleled Aronia Berries Market insights. See full methodology.

Market Scope

Report Coverage

Details

Page number

158

Base year

2023

Historic period

2018-2022

Forecast period

2024-2028

Growth momentum & CAGR

Accelerate at a CAGR of 9.64%

Market growth 2024-2028

USD 501.5 million

Market structure

Fragmented

YoY growth 2023-2024(%)

8.57

Key countries

US, Canada, Germany, UK, Italy, France, China, India, Japan, Brazil, Egypt, UAE, Oman, Argentina, KSA, UAE, Brazil, and Rest of World (ROW)

Competitive landscape

Leading Companies, Market Positioning of Companies, Competitive Strategies, and Industry Risks

Request Free Sample

What are the Key Data Covered in this Aronia Berries Market Research and Growth Report?

  • CAGR of the Aronia Berries industry during the forecast period
  • Detailed information on factors that will drive the growth and forecasting between 2024 and 2028
  • Precise estimation of the size of the market and its contribution of the industry in focus to the parent market
  • Accurate predictions about upcoming growth and trends and changes in consumer behaviour
  • Growth of the market across Europe, North America, APAC, South America, and Middle East and Africa
  • Thorough analysis of the market's competitive landscape and detailed information about companies
  • Comprehensive analysis of factors that will challenge the aronia berries market growth of industry companies

We can help! Our analysts can customize this aronia berries market research report to meet your requirements.

Get in touch

1 Executive Summary

  • 1.1 Market overview
    • Executive Summary - Chart on Market Overview
    • Executive Summary - Data Table on Market Overview
    • Executive Summary - Chart on Global Market Characteristics
    • Executive Summary - Chart on Market by Geography
    • Executive Summary - Chart on Market Segmentation by Source
    • Executive Summary - Chart on Market Segmentation by Distribution Channel
    • Executive Summary - Chart on Incremental Growth
    • Executive Summary - Data Table on Incremental Growth
    • Executive Summary - Chart on Company Market Positioning

2 Market Landscape

  • 2.1 Market ecosystem
    • Parent Market
    • Data Table on - Parent Market
  • 2.2 Market characteristics
    • Market characteristics analysis
  • 2.3 Value chain analysis
    • Value Chain Analysis

3 Market Sizing

  • 3.1 Market definition
    • Offerings of companies included in the market definition
  • 3.2 Market segment analysis
    • Market segments
  • 3.3 Market size 2023
    • 3.4 Market outlook: Forecast for 2023-2028
      • Chart on Global - Market size and forecast 2023-2028 ($ million)
      • Data Table on Global - Market size and forecast 2023-2028 ($ million)
      • Chart on Global Market: Year-over-year growth 2023-2028 (%)
      • Data Table on Global Market: Year-over-year growth 2023-2028 (%)

    4 Historic Market Size

    • 4.1 Global Aronia Berries Market 2018 - 2022
      • Historic Market Size - Data Table on Global Aronia Berries Market 2018 - 2022 ($ million)
    • 4.2 Source segment analysis 2018 - 2022
      • Historic Market Size - Source Segment 2018 - 2022 ($ million)
    • 4.3 Distribution Channel segment analysis 2018 - 2022
      • Historic Market Size - Distribution Channel Segment 2018 - 2022 ($ million)
    • 4.4 Geography segment analysis 2018 - 2022
      • Historic Market Size - Geography Segment 2018 - 2022 ($ million)
    • 4.5 Country segment analysis 2018 - 2022
      • Historic Market Size - Country Segment 2018 - 2022 ($ million)

    5 Five Forces Analysis

    • 5.1 Five forces summary
      • Five forces analysis - Comparison between 2023 and 2028
    • 5.2 Bargaining power of buyers
      • Bargaining power of buyers - Impact of key factors 2023 and 2028
    • 5.3 Bargaining power of suppliers
      • Bargaining power of suppliers - Impact of key factors in 2023 and 2028
    • 5.4 Threat of new entrants
      • Threat of new entrants - Impact of key factors in 2023 and 2028
    • 5.5 Threat of substitutes
      • Threat of substitutes - Impact of key factors in 2023 and 2028
    • 5.6 Threat of rivalry
      • Threat of rivalry - Impact of key factors in 2023 and 2028
    • 5.7 Market condition
      • Chart on Market condition - Five forces 2023 and 2028

    6 Market Segmentation by Source

    • 6.1 Market segments
      • Chart on Source - Market share (2023-2028) (%)
      • Data Table on Source - Market share (2023-2028) (%)
    • 6.2 Comparison by Source
      • Chart on Comparison by Source
      • Data Table on Comparison by Source
    • 6.3 Conventional - Market size and forecast (2023-2028)
      • Chart on Conventional - Market size and forecast (2023-2028) ($ million)
      • Data Table on Conventional - Market size and forecast (2023-2028) ($ million)
      • Chart on Conventional - Year-over-year growth (2023-2028) (%)
      • Data Table on Conventional - Year-over-year growth (2023-2028) (%)
    • 6.4 Organic - Market size and forecast (2023-2028)
      • Chart on Organic - Market size and forecast (2023-2028) ($ million)
      • Data Table on Organic - Market size and forecast (2023-2028) ($ million)
      • Chart on Organic - Year-over-year growth (2023-2028) (%)
      • Data Table on Organic - Year-over-year growth (2023-2028) (%)
    • 6.5 Market opportunity by Source
      • Market opportunity by Source ($ million)
      • Data Table on Market opportunity by Source ($ million)

    7 Market Segmentation by Distribution Channel

    • 7.1 Market segments
      • Chart on Distribution Channel - Market share (2023-2028) (%)
      • Data Table on Distribution Channel - Market share (2023-2028) (%)
    • 7.2 Comparison by Distribution Channel
      • Chart on Comparison by Distribution Channel
      • Data Table on Comparison by Distribution Channel
    • 7.3 Offline - Market size and forecast (2023-2028)
      • Chart on Offline - Market size and forecast (2023-2028) ($ million)
      • Data Table on Offline - Market size and forecast (2023-2028) ($ million)
      • Chart on Offline - Year-over-year growth (2023-2028) (%)
      • Data Table on Offline - Year-over-year growth (2023-2028) (%)
    • 7.4 Online - Market size and forecast (2023-2028)
      • Chart on Online - Market size and forecast (2023-2028) ($ million)
      • Data Table on Online - Market size and forecast (2023-2028) ($ million)
      • Chart on Online - Year-over-year growth (2023-2028) (%)
      • Data Table on Online - Year-over-year growth (2023-2028) (%)
    • 7.5 Market opportunity by Distribution Channel
      • Market opportunity by Distribution Channel ($ million)
      • Data Table on Market opportunity by Distribution Channel ($ million)

    8 Market Segmentation by Product Type

    • 8.1 Market segments
      • Chart on Product Type - Market share (2023-2028) (%)
      • Data Table on Product Type - Market share (2023-2028) (%)
    • 8.2 Comparison by Product Type
      • Chart on Comparison by Product Type
      • Data Table on Comparison by Product Type
    • 8.3 Fresh Berries - Market size and forecast (2023-2028)
      • Chart on Fresh Berries - Market size and forecast (2023-2028) ($ million)
      • Data Table on Fresh Berries - Market size and forecast (2023-2028) ($ million)
      • Chart on Fresh Berries - Year-over-year growth (2023-2028) (%)
      • Data Table on Fresh Berries - Year-over-year growth (2023-2028) (%)
    • 8.4 Dried Berries - Market size and forecast (2023-2028)
      • Chart on Dried Berries - Market size and forecast (2023-2028) ($ million)
      • Data Table on Dried Berries - Market size and forecast (2023-2028) ($ million)
      • Chart on Dried Berries - Year-over-year growth (2023-2028) (%)
      • Data Table on Dried Berries - Year-over-year growth (2023-2028) (%)
    • 8.5 Juice - Market size and forecast (2023-2028)
      • Chart on Juice - Market size and forecast (2023-2028) ($ million)
      • Data Table on Juice - Market size and forecast (2023-2028) ($ million)
      • Chart on Juice - Year-over-year growth (2023-2028) (%)
      • Data Table on Juice - Year-over-year growth (2023-2028) (%)
    • 8.6 Powder - Market size and forecast (2023-2028)
      • Chart on Powder - Market size and forecast (2023-2028) ($ million)
      • Data Table on Powder - Market size and forecast (2023-2028) ($ million)
      • Chart on Powder - Year-over-year growth (2023-2028) (%)
      • Data Table on Powder - Year-over-year growth (2023-2028) (%)
    • 8.7 Extracts - Market size and forecast (2023-2028)
      • Chart on Extracts - Market size and forecast (2023-2028) ($ million)
      • Data Table on Extracts - Market size and forecast (2023-2028) ($ million)
      • Chart on Extracts - Year-over-year growth (2023-2028) (%)
      • Data Table on Extracts - Year-over-year growth (2023-2028) (%)
    • 8.8 Market opportunity by Product Type
      • Market opportunity by Product Type ($ million)
      • Data Table on Market opportunity by Product Type ($ million)

    9 Market Segmentation by Application

    • 9.1 Market segments
      • Chart on Application - Market share (2023-2028) (%)
      • Data Table on Application - Market share (2023-2028) (%)
    • 9.2 Comparison by Application
      • Chart on Comparison by Application
      • Data Table on Comparison by Application
    • 9.3 Food & Beverages - Market size and forecast (2023-2028)
      • Chart on Food & Beverages - Market size and forecast (2023-2028) ($ million)
      • Data Table on Food & Beverages - Market size and forecast (2023-2028) ($ million)
      • Chart on Food & Beverages - Year-over-year growth (2023-2028) (%)
      • Data Table on Food & Beverages - Year-over-year growth (2023-2028) (%)
    • 9.4 Dietary Supplements - Market size and forecast (2023-2028)
      • Chart on Dietary Supplements - Market size and forecast (2023-2028) ($ million)
      • Data Table on Dietary Supplements - Market size and forecast (2023-2028) ($ million)
      • Chart on Dietary Supplements - Year-over-year growth (2023-2028) (%)
      • Data Table on Dietary Supplements - Year-over-year growth (2023-2028) (%)
    • 9.5 Cosmetics - Market size and forecast (2023-2028)
      • Chart on Cosmetics - Market size and forecast (2023-2028) ($ million)
      • Data Table on Cosmetics - Market size and forecast (2023-2028) ($ million)
      • Chart on Cosmetics - Year-over-year growth (2023-2028) (%)
      • Data Table on Cosmetics - Year-over-year growth (2023-2028) (%)
    • 9.6 Pharmaceuticals - Market size and forecast (2023-2028)
      • Chart on Pharmaceuticals - Market size and forecast (2023-2028) ($ million)
      • Data Table on Pharmaceuticals - Market size and forecast (2023-2028) ($ million)
      • Chart on Pharmaceuticals - Year-over-year growth (2023-2028) (%)
      • Data Table on Pharmaceuticals - Year-over-year growth (2023-2028) (%)
    • 9.7 Market opportunity by Application
      • Market opportunity by Application ($ million)
      • Data Table on Market opportunity by Application ($ million)

    10 Customer Landscape

    • 10.1 Customer landscape overview
      • Analysis of price sensitivity, lifecycle, customer purchase basket, adoption rates, and purchase criteria

    11 Geographic Landscape

    • 11.1 Geographic segmentation
      • Chart on Market share by geography 2023-2028 (%)
      • Data Table on Market share by geography 2023-2028 (%)
    • 11.2 Geographic comparison
      • Chart on Geographic comparison
      • Data Table on Geographic comparison
    • 11.3 Europe - Market size and forecast 2023-2028
      • Chart on Europe - Market size and forecast 2023-2028 ($ million)
      • Data Table on Europe - Market size and forecast 2023-2028 ($ million)
      • Chart on Europe - Year-over-year growth 2023-2028 (%)
      • Data Table on Europe - Year-over-year growth 2023-2028 (%)
    • 11.4 North America - Market size and forecast 2023-2028
      • Chart on North America - Market size and forecast 2023-2028 ($ million)
      • Data Table on North America - Market size and forecast 2023-2028 ($ million)
      • Chart on North America - Year-over-year growth 2023-2028 (%)
      • Data Table on North America - Year-over-year growth 2023-2028 (%)
    • 11.5 APAC - Market size and forecast 2023-2028
      • Chart on APAC - Market size and forecast 2023-2028 ($ million)
      • Data Table on APAC - Market size and forecast 2023-2028 ($ million)
      • Chart on APAC - Year-over-year growth 2023-2028 (%)
      • Data Table on APAC - Year-over-year growth 2023-2028 (%)
    • 11.6 South America - Market size and forecast 2023-2028
      • Chart on South America - Market size and forecast 2023-2028 ($ million)
      • Data Table on South America - Market size and forecast 2023-2028 ($ million)
      • Chart on South America - Year-over-year growth 2023-2028 (%)
      • Data Table on South America - Year-over-year growth 2023-2028 (%)
    • 11.7 Middle East and Africa - Market size and forecast 2023-2028
      • Chart on Middle East and Africa - Market size and forecast 2023-2028 ($ million)
      • Data Table on Middle East and Africa - Market size and forecast 2023-2028 ($ million)
      • Chart on Middle East and Africa - Year-over-year growth 2023-2028 (%)
      • Data Table on Middle East and Africa - Year-over-year growth 2023-2028 (%)
    • 11.8 US - Market size and forecast 2023-2028
      • Chart on US - Market size and forecast 2023-2028 ($ million)
      • Data Table on US - Market size and forecast 2023-2028 ($ million)
      • Chart on US - Year-over-year growth 2023-2028 (%)
      • Data Table on US - Year-over-year growth 2023-2028 (%)
    • 11.9 UK - Market size and forecast 2023-2028
      • Chart on UK - Market size and forecast 2023-2028 ($ million)
      • Data Table on UK - Market size and forecast 2023-2028 ($ million)
      • Chart on UK - Year-over-year growth 2023-2028 (%)
      • Data Table on UK - Year-over-year growth 2023-2028 (%)
    • 11.10 Germany - Market size and forecast 2023-2028
      • Chart on Germany - Market size and forecast 2023-2028 ($ million)
      • Data Table on Germany - Market size and forecast 2023-2028 ($ million)
      • Chart on Germany - Year-over-year growth 2023-2028 (%)
      • Data Table on Germany - Year-over-year growth 2023-2028 (%)
    • 11.11 China - Market size and forecast 2023-2028
      • Chart on China - Market size and forecast 2023-2028 ($ million)
      • Data Table on China - Market size and forecast 2023-2028 ($ million)
      • Chart on China - Year-over-year growth 2023-2028 (%)
      • Data Table on China - Year-over-year growth 2023-2028 (%)
    • 11.12 Japan - Market size and forecast 2023-2028
      • Chart on Japan - Market size and forecast 2023-2028 ($ million)
      • Data Table on Japan - Market size and forecast 2023-2028 ($ million)
      • Chart on Japan - Year-over-year growth 2023-2028 (%)
      • Data Table on Japan - Year-over-year growth 2023-2028 (%)
    • 11.13 Market opportunity by geography
      • Market opportunity by geography ($ million)
      • Data Tables on Market opportunity by geography ($ million)
    • 11.14 US - Market size and forecast (2023-2028)
      • Chart on US - Market size and forecast (2023-2028) ($ million)
      • Data Table on US - Market size and forecast (2023-2028) ($ million)
      • Chart on US - Year-over-year growth (2023-2028) (%)
      • Data Table on US - Year-over-year growth (2023-2028) (%)
    • 11.15 Canada - Market size and forecast (2023-2028)
      • Chart on Canada - Market size and forecast (2023-2028) ($ million)
      • Data Table on Canada - Market size and forecast (2023-2028) ($ million)
      • Chart on Canada - Year-over-year growth (2023-2028) (%)
      • Data Table on Canada - Year-over-year growth (2023-2028) (%)
    • 11.16 Italy - Market size and forecast (2023-2028)
      • Chart on Italy - Market size and forecast (2023-2028) ($ million)
      • Data Table on Italy - Market size and forecast (2023-2028) ($ million)
      • Chart on Italy - Year-over-year growth (2023-2028) (%)
      • Data Table on Italy - Year-over-year growth (2023-2028) (%)
    • 11.17 France - Market size and forecast (2023-2028)
      • Chart on France - Market size and forecast (2023-2028) ($ million)
      • Data Table on France - Market size and forecast (2023-2028) ($ million)
      • Chart on France - Year-over-year growth (2023-2028) (%)
      • Data Table on France - Year-over-year growth (2023-2028) (%)
    • 11.18 India - Market size and forecast (2023-2028)
      • Chart on India - Market size and forecast (2023-2028) ($ million)
      • Data Table on India - Market size and forecast (2023-2028) ($ million)
      • Chart on India - Year-over-year growth (2023-2028) (%)
      • Data Table on India - Year-over-year growth (2023-2028) (%)
    • 11.19 Brazil - Market size and forecast (2023-2028)
      • Chart on Brazil - Market size and forecast (2023-2028) ($ million)
      • Data Table on Brazil - Market size and forecast (2023-2028) ($ million)
      • Chart on Brazil - Year-over-year growth (2023-2028) (%)
      • Data Table on Brazil - Year-over-year growth (2023-2028) (%)
    • 11.20 Egypt - Market size and forecast (2023-2028)
      • Chart on Egypt - Market size and forecast (2023-2028) ($ million)
      • Data Table on Egypt - Market size and forecast (2023-2028) ($ million)
      • Chart on Egypt - Year-over-year growth (2023-2028) (%)
      • Data Table on Egypt - Year-over-year growth (2023-2028) (%)
    • 11.21 UAE - Market size and forecast (2023-2028)
      • Chart on UAE - Market size and forecast (2023-2028) ($ million)
      • Data Table on UAE - Market size and forecast (2023-2028) ($ million)
      • Chart on UAE - Year-over-year growth (2023-2028) (%)
      • Data Table on UAE - Year-over-year growth (2023-2028) (%)
    • 11.22 Oman - Market size and forecast (2023-2028)
      • Chart on Oman - Market size and forecast (2023-2028) ($ million)
      • Data Table on Oman - Market size and forecast (2023-2028) ($ million)
      • Chart on Oman - Year-over-year growth (2023-2028) (%)
      • Data Table on Oman - Year-over-year growth (2023-2028) (%)
    • 11.23 Argentina - Market size and forecast (2023-2028)
      • Chart on Argentina - Market size and forecast (2023-2028) ($ million)
      • Data Table on Argentina - Market size and forecast (2023-2028) ($ million)
      • Chart on Argentina - Year-over-year growth (2023-2028) (%)
      • Data Table on Argentina - Year-over-year growth (2023-2028) (%)
    • 11.24 KSA - Market size and forecast (2023-2028)
      • Chart on KSA - Market size and forecast (2023-2028) ($ million)
      • Data Table on KSA - Market size and forecast (2023-2028) ($ million)
      • Chart on KSA - Year-over-year growth (2023-2028) (%)
      • Data Table on KSA - Year-over-year growth (2023-2028) (%)
    • 11.25 Rest of World (ROW) - Market size and forecast (2023-2028)
      • Chart on Rest of World (ROW) - Market size and forecast (2023-2028) ($ million)
      • Data Table on Rest of World (ROW) - Market size and forecast (2023-2028) ($ million)
      • Chart on Rest of World (ROW) - Year-over-year growth (2023-2028) (%)
      • Data Table on Rest of World (ROW) - Year-over-year growth (2023-2028) (%)

    12 Drivers, Challenges, and Opportunity/Restraints

    • 12.1 Market drivers
      • 12.2 Market challenges
        • 12.3 Impact of drivers and challenges
          • Impact of drivers and challenges in 2023 and 2028
        • 12.4 Market opportunities/restraints

          13 Competitive Landscape

          • 13.1 Overview
            • 13.2 Competitive Landscape
              • Overview on criticality of inputs and factors of differentiation
            • 13.3 Landscape disruption
              • Overview on factors of disruption
            • 13.4 Industry risks
              • Impact of key risks on business

            14 Competitive Analysis

            • 14.1 Companies profiled
              • Companies covered
            • 14.2 Market positioning of companies
              • Matrix on companies position and classification
            • 14.3 ArmedinaUSA
              • ArmedinaUSA - Overview
              • ArmedinaUSA - Product / Service
              • ArmedinaUSA - Key offerings
            • 14.4 Bio Poland sp. z o.o.
              • Bio Poland sp. z o.o. - Overview
              • Bio Poland sp. z o.o. - Product / Service
              • Bio Poland sp. z o.o. - Key offerings
            • 14.5 BioActor BV
              • BioActor BV - Overview
              • BioActor BV - Product / Service
              • BioActor BV - Key offerings
            • 14.6 Brownwood Acres
              • Brownwood Acres - Overview
              • Brownwood Acres - Product / Service
              • Brownwood Acres - Key offerings
            • 14.7 Erbology
              • Erbology - Overview
              • Erbology - Product / Service
              • Erbology - Key offerings
            • 14.8 GreenField Sp zoo Spk
              • GreenField Sp zoo Spk - Overview
              • GreenField Sp zoo Spk - Product / Service
              • GreenField Sp zoo Spk - Key offerings
            • 14.9 J and J Aronia BC
              • J and J Aronia BC - Overview
              • J and J Aronia BC - Product / Service
              • J and J Aronia BC - Key offerings
            • 14.10 Maes Health and Wellness LLC
              • Maes Health and Wellness LLC - Overview
              • Maes Health and Wellness LLC - Product / Service
              • Maes Health and Wellness LLC - Key offerings
            • 14.11 Microstructure sp z oo
              • Microstructure sp z oo - Overview
              • Microstructure sp z oo - Product / Service
              • Microstructure sp z oo - Key offerings
            • 14.12 OPG Medic
              • OPG Medic - Overview
              • OPG Medic - Product / Service
              • OPG Medic - Key offerings
            • 14.13 PowerfulBerry.com
              • PowerfulBerry.com - Overview
              • PowerfulBerry.com - Product / Service
              • PowerfulBerry.com - Key offerings
            • 14.14 PPHU Bio Juice Piotr Michalak
              • PPHU Bio Juice Piotr Michalak - Overview
              • PPHU Bio Juice Piotr Michalak - Product / Service
              • PPHU Bio Juice Piotr Michalak - Key offerings
            • 14.15 Sawmill Hollow
              • Sawmill Hollow - Overview
              • Sawmill Hollow - Product / Service
              • Sawmill Hollow - Key offerings
            • 14.16 Schade Vineyard and Winery
              • Schade Vineyard and Winery - Overview
              • Schade Vineyard and Winery - Product / Service
              • Schade Vineyard and Winery - Key offerings
            • 14.17 TECOFOOD sp
              • TECOFOOD sp - Overview
              • TECOFOOD sp - Product / Service
              • TECOFOOD sp - Key offerings

            15 Appendix

            • 15.1 Scope of the report
              • 15.2 Inclusions and exclusions checklist
                • Inclusions checklist
                • Exclusions checklist
              • 15.3 Currency conversion rates for US$
                • Currency conversion rates for US$
              • 15.4 Research methodology
                • Research methodology
              • 15.5 Data procurement
                • Information sources
              • 15.6 Data validation
                • Data validation
              • 15.7 Validation techniques employed for market sizing
                • Validation techniques employed for market sizing
              • 15.8 Data synthesis
                • Data synthesis
              • 15.9 360 degree market analysis
                • 360 degree market analysis
              • 15.10 List of abbreviations
                • List of abbreviations

              Research Methodology

              Technavio presents a detailed picture of the market by way of study, synthesis, and summation of data from multiple sources. The analysts have presented the various facets of the market with a particular focus on identifying the key industry influencers. The data thus presented is comprehensive, reliable, and the result of extensive research, both primary and secondary.

              INFORMATION SOURCES

              Primary sources

              • Manufacturers and suppliers
              • Channel partners
              • Industry experts
              • Strategic decision makers

              Secondary sources

              • Industry journals and periodicals
              • Government data
              • Financial reports of key industry players
              • Historical data
              • Press releases

              DATA ANALYSIS

              Data Synthesis

              • Collation of data
              • Estimation of key figures
              • Analysis of derived insights

              Data Validation

              • Triangulation with data models
              • Reference against proprietary databases
              • Corroboration with industry experts

              REPORT WRITING

              Qualitative

              • Market drivers
              • Market challenges
              • Market trends
              • Five forces analysis

              Quantitative

              • Market size and forecast
              • Market segmentation
              • Geographical insights
              • Competitive landscape

              Interested in this report?

              Get your sample now to see our research methodology and insights!

              Download Now

              Frequently Asked Questions

              Aronia Berries market growth will increase by $ 501.5 mn during 2024-2028 .

              The Aronia Berries market is expected to grow at a CAGR of 9.64% during 2024-2028 .

              Aronia Berries market is segmented by Source( Conventional, Organic) Distribution Channel( Offline, Online, APAC, South America, MEA)

               Aronia for life, Akron Apple and Aronia Inc., Akronia Valley LLC, ArmedinaUSA, Aronia Ireland Ltd., Bio Poland sp. z o.o., BioActor BV, Brownwood Acres, Erbology, GreenField Sp zoo Spk, J and J Aronia BC, Maes Health and Wellness LLC, Microstructure sp z oo, OPG Medic, PowerfulBerry.com, PPHU Bio Juice Piotr Michalak, Rabenhorst, Sawmill Hollow, Schade Vineyard and Winery, TECOFOOD sp are a few of the key vendors in the Aronia Berries market.

              Europe will register the highest growth rate of 33% among the other regions. Therefore, the Aronia Berries market in Europe is expected to garner significant business opportunities for the vendors during the forecast period.

              US, Canada, Germany, UK, Italy, France, China, India, Japan, Brazil, Egypt, UAE, Oman, Argentina, KSA, UAE, Brazil, Rest of World (ROW)

              • Health benefits of aronia berriesGrowing awareness about the multiple health benefits of aronia berries has increased the consumption of these berries as concentrate is the driving factor this market.
              • fruit is the driving factor this market.
              • and juice. Aronia berries are rich in various nutrients that are essential for the proper functioning of the body. They are powerful antioxidants and have higher levels of polyphenols and anthocyanins than other berry types is the driving factor this market.
              • such as cranberries is the driving factor this market.
              • blueberries is the driving factor this market.
              • and grapes. They have high nutritional value and offer several health benefits. They help improve the circulation of blood and prevent the formation of free radicals that cause diabetes and cardiovascular diseases. The high concentration of phenols in aronia berries helps in the effective healing of wounds and the removal of toxic substances from the body. They are excellent anti-carcinogenic agents. The consumption of aronia berries is proven to be beneficial for individuals affected by breast cancer.  The numerous health benefits of aronia berries have increased the demand for these berries across the world. These berries is the driving factor this market.
              • in their various forms is the driving factor this market.
              • are increasingly becoming a part of diets worldwide. As a result is the driving factor this market.
              • aronia berries are increasingly being used in the production of various processed food and beverages such as muffins is the driving factor this market.
              • pies is the driving factor this market.
              • cookies is the driving factor this market.
              • wine is the driving factor this market.
              • jam is the driving factor this market.
              • tea is the driving factor this market.
              • and juices. Vendors operating in the global aronia berries market offer several aronia berry-based products. For instance is the driving factor this market.
              • the popular offerings of Croatia-based OPG Medic is the driving factor this market.
              • a vendor operating in the market is the driving factor this market.
              • include Aronia 100% fruit juice is the driving factor this market.
              • Aronia homemade jam is the driving factor this market.
              • and Aronia homemade sweet. Therefore is the driving factor this market.
              • the abovementioned factors will significantly contribute to the growth of the global aronia berries market during the forecast period. is the driving factor this market.

              The Aronia Berries market vendors should focus on grabbing business opportunities from the Conventional segment as it accounted for the largest market share in the base year.