Plant-Based Beverages Processing Equipment Market Analysis, Size, and Forecast 2024-2028: North America (US, Canada, and Mexico), Europe (France, Germany, Italy, Spain, and UK), Middle East and Africa (UAE), APAC (China, India, Japan, and South Korea), South America (Brazil), and Rest of World (ROW)

Plant-Based Beverages Processing Equipment Market Analysis, Size, and Forecast 2024-2028:
North America (US, Canada, and Mexico), Europe (France, Germany, Italy, Spain, and UK), Middle East and Africa (UAE), APAC (China, India, Japan, and South Korea), South America (Brazil), and Rest of World (ROW)

Published: Jul 2024 182 Pages SKU: IRTNTR74895

Market Overview at a Glance

$1.53 B
Market Opportunity
9.45%
CAGR
8.42
YoY growth 2023-2024(%)

Plant-Based Beverages Processing Equipment Market Size 2024-2028

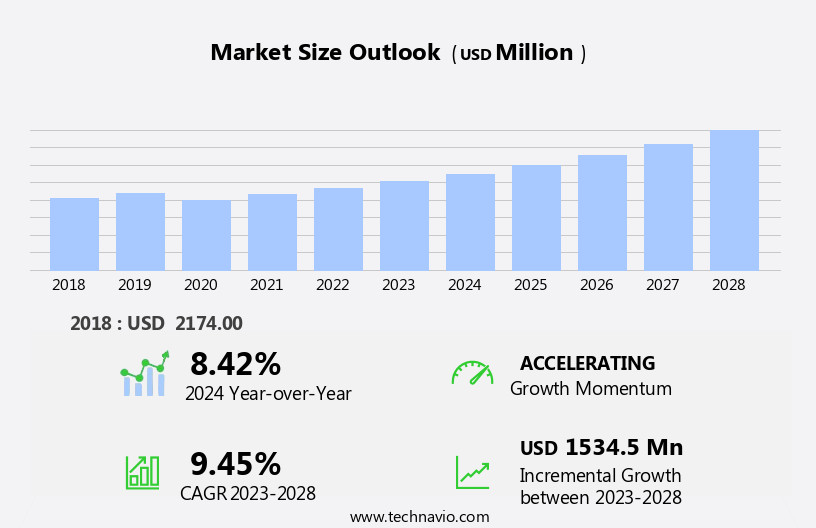
The plant-based beverages processing equipment market size is forecast to increase by USD 1.53 billion at a CAGR of 9.45% between 2023 and 2028.

  • The market is witnessing significant growth, driven by the increasing demand for single-serve and multi-packs of plant-based beverages, as consumers seek convenience and portability. Additionally, the rising trend of health consciousness is fueling market growth, as plant-based beverages are perceived as healthier dailry alternatives to traditional dairy , yoghurt and sugar-laden beverages. However, the market faces challenges, including the rising energy costs, which can increase operational expenses for manufacturers. These costs may lead to higher prices for consumers, potentially impacting demand.
  • To capitalize on market opportunities, companies must focus on energy efficiency and cost reduction strategies, while also addressing consumer preferences for sustainable packaging solutions. By staying attuned to these market dynamics, businesses can effectively navigate challenges and capitalize on the growing demand for plant-based beverages.

What will be the Size of the Plant-Based Beverages Processing Equipment Market during the forecast period?

Plant-Based Beverages Processing Equipment Market Size

 Request Free Sample

How is this Plant-Based Beverages Processing Equipment Industry segmented?

The plant-based beverages processing equipment industry research report provides comprehensive data (region-wise segment analysis), with forecasts and estimates in "USD million" for the period 2024-2028, as well as historical data from 2018-2022 for the following segments.

  • Product Type
    • Homogenizer
    • Filtration
    • Heat exchangers
    • Filling and packaging systems
    • Others
  • Type
    • Soy
    • Almond
    • Oat
    • Others
  • End-User
    • Large-Scale Manufacturers
    • SMEs
    • Contract Manufacturers
  • Technology
    • Automated Systems
    • Manual Systems
    • Hybrid Systems
  • Distribution Channel
    • Direct Sales
    • Equipment Distributors
    • Online Platforms
  • Geography
    • North America
      • US
      • Canada
      • Mexico
    • Europe
      • France
      • Germany
      • Italy
      • Spain
      • UK
    • Middle East and Africa
      • UAE
    • APAC
      • China
      • India
      • Japan
      • South Korea
    • South America
      • Brazil
    • Rest of World (ROW)

By Product Type Insights

The homogenizer segment is estimated to witness significant growth during the forecast period.

In the realm of plant-based beverages, continuous processing plays a crucial role in ensuring consistency and efficiency in beverage production. This method integrates various systems such as mixing, homogenizing, and cooling, enabling the seamless transition between processes. Plant-based milk alternatives, including pea milk, soy milk, almond milk, rice milk, walnut milk, cashew milk, coconut milk, oat milk, hemp milk, and others, undergo homogenization for improved texture and shelf life. Homogenizers, which utilize high-pressure pumps and homogenizing valves, facilitate the disintegration of fat molecules through cavitation and turbulence. Food safety is paramount in beverage processing, and aseptic processing, a critical component of continuous production, ensures the elimination of microorganisms.

High-pressure processing (HPP) is another technology that enhances food safety by applying high pressure to the product, thereby inactivating harmful bacteria. Blending systems enable the creation of functional foods and alternative milk blends, while line integration streamlines production and reduces costs. Heating systems, such as plate heat exchangers, are essential for pasteurization and sterilization. Control systems and quality control measures ensure the production of clean-label, high-quality plant-based beverages. Process optimization and conveying systems further enhance production efficiency. Plant-based yogurt, cream, cheese, and ice cream also benefit from these processing technologies. Ultrasonic processing is an emerging trend in plant-based beverage production, offering advantages such as reduced processing time, improved nutrient retention, and enhanced product quality. Overall, the plant-based beverage market is witnessing significant growth, driven by the health and wellness trend, consumer preference for dairy food, and the increasing popularity of plant-based diets.

Plant-Based Beverages Processing Equipment Market Size

Request Free Sample

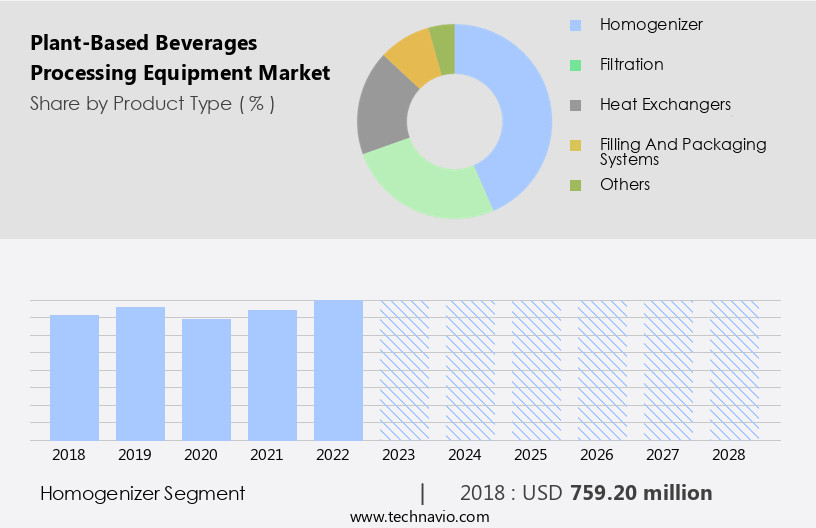
The Homogenizer segment was valued at USD 759.20 billion in 2018 and showed a gradual increase during the forecast period.

Regional Analysis

APAC is estimated to contribute 64% to the growth of the global market during the forecast period.Technavio's analysts have elaborately explained the regional trends and drivers that shape the market during the forecast period.

Plant-Based Beverages Processing Equipment Market Share by Geography

 Request Free Sample

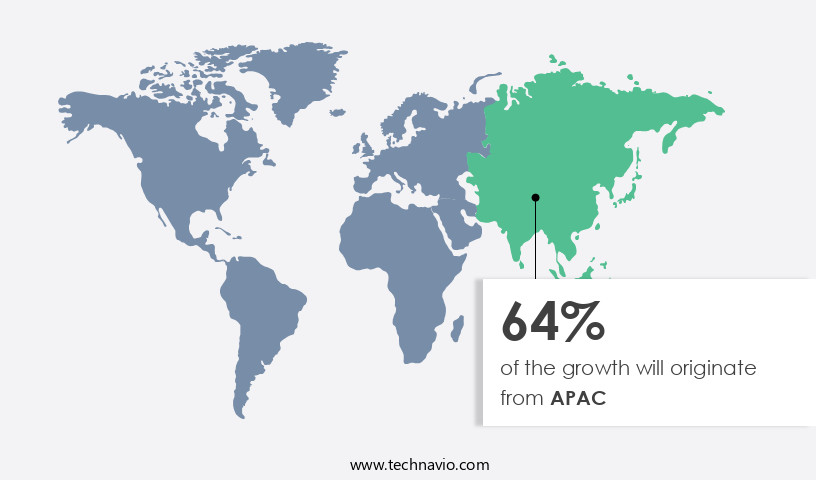
The market is witnessing significant growth, particularly in the Asia Pacific (APAC) region. This expansion is driven by several factors, including the entry of global brands, strategic partnerships between suppliers, retailers, and global brands, government initiatives promoting plant-based food consumption, and increasing awareness about the health benefits of plant-based beverages. The vegan population is also on the rise in vegan food, contributing to the market's growth. China, Japan, and Australia are the major contributors to the APAC market. In China, concerns over meat quality and health issues associated with meat products have fueled the demand for plant-based beverages. Food safety, process optimization, and line integration are crucial considerations in the manufacturing of plant-based yogurt, milk alternatives like pea milk, soy milk, almond milk, rice milk, cashew milk, coconut milk, oat milk, hemp milk, and plant-based cream.

Aseptic processing, high-pressure processing (HPP), blending systems, conveying systems, cooling systems, and heating systems are essential equipment for producing these beverages. Additionally, functional foods and beverage, plant-based cheese, and plant-based ice cream are gaining popularity, necessitating advanced processing equipment. Quality control, clean label, and control systems are essential to meet consumer demands for health and wellness. Ultrasonic processing is also used in the production of plant-based beverages for improved texture and taste.

Market Dynamics

Our researchers analyzed the data with 2023 as the base year, along with the key drivers, trends, and challenges. A holistic analysis of drivers will help companies refine their marketing strategies to gain a competitive advantage.

The Plant-Based Beverages Processing Equipment Market is expanding with rising demand for plant-based milk processing equipment for oat milk and aseptic processing systems for almond milk production. Manufacturers are investing in high-pressure processing equipment for soy milk and energy-efficient pasteurizers for plant-based beverages to ensure safety and sustainability. Advanced filtration systems for coconut milk manufacturing and UHT processing equipment for dairy-free beverages improve shelf life and product quality. Automation trends include automated filling machines for plant-based milk and homogenizers for cashew milk production. The market also emphasizes sustainable processing equipment for hemp milk and scalable modular plant-based beverage production lines.

The plant-based beverages processing market continues to evolve, driven by the growing demand for dairy alternatives and functional foods. Beverage processing companies invest in advanced technologies such as continuous processing, aseptic processing, and high-pressure processing (HPP) to meet consumer preferences for clean label, safe, and high-quality plant-based milk and yogurt alternatives. Functional foods, including plant-based beverages made from almond, rice, soy, pea, cashew milk, hemp, oat, and coconut milk, are integrated into various food processing lines. Blending systems and cooling systems play a crucial role in ensuring optimal process conditions and product consistency. Line integration and batch processing enable efficient production, while process optimization and quality control systems ensure food safety and regulatory compliance.

What are the key market drivers leading to the rise in the adoption of Plant-Based Beverages Processing Equipment Industry?

  • The market is propelled forward by the growing demand for single-serve and multi-pack offerings, as well as the increasing preference for sustainable packaging solutions. The growing number of single-person households is fueling demand for convenient single-serve beverage packs, particularly in European countries like Denmark, Finland, and Germany.
  • Consumers also seek space-efficient options, while retailers are stocking more multi-packs and variety packs to encourage trial. Simultaneously, a strong preference for sustainable packaging, exemplified by Tetra Pak's paper straws, is emerging as buyers aim to reduce their environmental impact. The increased consumption of single-serve and multi-packs will boost packaging material production, driving revenue for plant-based beverage processing equipment vendors. Furthermore, the rising demand for sustainable packaging will be a key growth driver for this global market in the forecast period.

What are the market trends shaping the Plant-Based Beverages Processing Equipment Industry?

  • Market trends indicate a growing emphasis on health consciousness. This increasing awareness represents a significant shift in consumer behavior and preferences.One of the positive trends which can influence the growth of the global plant-based beverages processing equipment market during the forecast period is the increasing health consciousness among consumers. The increasing instances of obesity and related diseases are making consumers more health conscious. 
  • They demand natural food and beverage products that are natural and low in fat and calories. Players have started coming up with new plant-based products that have lower fat and calorie content to cater to the changing consumer demands. The health and wellness trends are gaining popularity among consumers, especially young consumers, in the age group of 18-32 years. Many consumers are also ready to pay a premium price for healthy products that offer various functional benefits. The increasing demand for healthy food and beverage products will help grow the global plant-based beverages processing equipment market during the forecast period.

What challenges does the Plant-Based Beverages Processing Equipment Industry face during its growth?

  • The escalating energy costs pose a significant challenge to the expansion and growth of various industries. Since plant-based beverages processing equipment uses a significant amount of electrical energy, increasing energy costs is one of the major concerns among end-users of this equipment, which mostly comprise players operating in the food and beverage industry. 
  • The energy consumption of plant-based beverages processing equipment depends on the type of products being filled into different containers. For instance, the power consumption for filling high-viscosity products or products with large particulates is high. This is because the rotor inside the fillers faces higher stress while filling high-viscosity food products, consuming more power to fill the products accurately. Filling appliances such as vacuum and pressure fillers have high energy consumption rates, using vacuum and pressure for filling operations. The increase in energy consumption leads to additional costs for food processing manufacturers as their operational costs increase. This will result in reduced profit margins for such end-users (food processing manufacturers), which might discourage them from purchasing plant-based beverages processing equipment, negatively impacting market growth during the forecast period.

Exclusive Customer Landscape

The plant-based beverages processing equipment market forecasting report includes the adoption lifecycle of the market, covering from the innovator's stage to the laggard's stage. It focuses on adoption rates in different regions based on penetration. Furthermore, the plant-based beverages processing equipment market report also includes key purchase criteria and drivers of price sensitivity to help companies evaluate and develop their market growth analysis strategies.
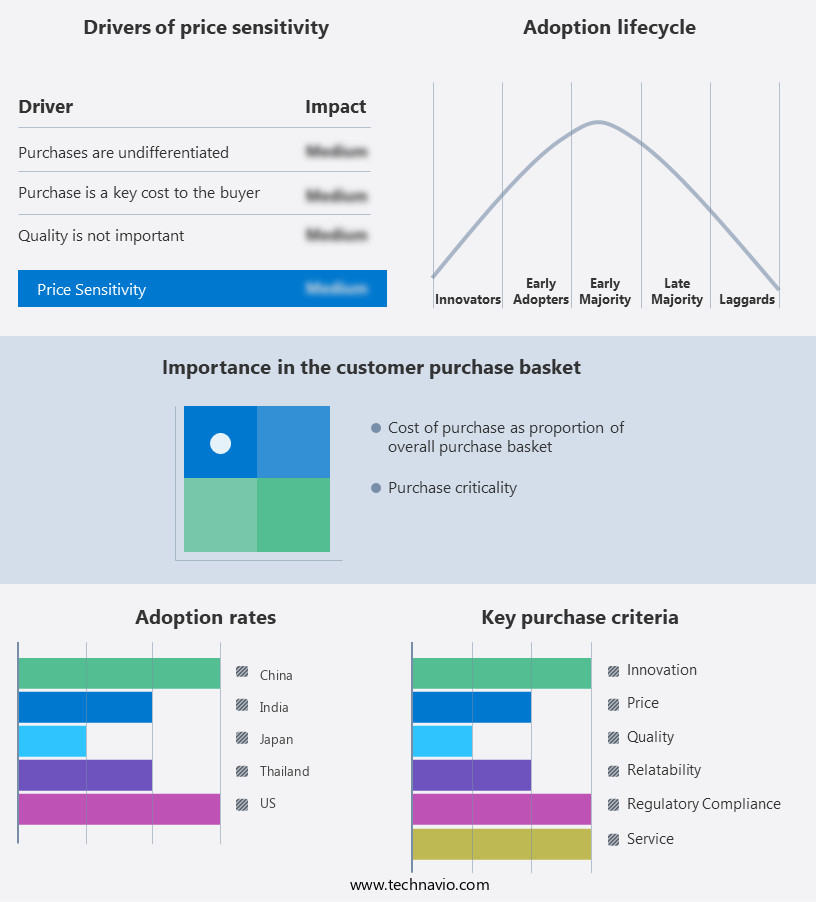
Plant-Based Beverages Processing Equipment Market Share by Geography

 Customer Landscape

Key Companies & Market Insights

Companies are implementing various strategies, such as strategic alliances, plant-based beverages processing equipment market forecast, partnerships, mergers and acquisitions, geographical expansion, and product/service launches, to enhance their presence in the industry.

Tetra Pak International S.A.  - This company specializes in providing advanced plant-based beverage processing equipment and associated solutions, including the TY Rap system in a buoyant polypropylene configuration, ideal for various liquid processing applications. Our offerings cater to the growing demand for sustainable and innovative beverage technologies. The TY Rap system's versatility and durability make it a preferred choice for businesses seeking efficient and eco-friendly processing solutions. With a commitment to innovation and quality, we deliver equipment that enhances productivity and contributes to the creation of unique, high-quality plant-based beverages.

The industry research and growth report includes detailed analyses of the competitive landscape of the market and information about key companies, including:

  • Tetra Pak International S.A.
  • Alfa Laval AB
  • GEA Group AG
  • SPX FLOW Inc.
  • Buhler AG
  • Krones AG
  • JBT Corporation
  • Feldmeier Equipment Inc.
  • HRS Process Systems Ltd.
  • MicroThermics Inc.
  • Shanghai Jimei Food Machinery Co., Ltd.
  • ProXES GmbH
  • Scherjon Dairy Equipment Holland
  • Stephan Machinery GmbH
  • Techno Process Equipment
  • Della Toffola SpA
  • Anderson Dahlen Inc.
  • Secomak Ltd.
  • Idaho Milk Products
  • Clextral S.A.S.

Qualitative and quantitative analysis of companies has been conducted to help clients understand the wider business environment as well as the strengths and weaknesses of key industry players. Data is qualitatively analyzed to categorize companies as pure play, category-focused, industry-focused, and diversified; it is quantitatively analyzed to categorize companies as dominant, leading, strong, tentative, and weak.

Recent Development and News in Plant-Based Beverages Processing Equipment Market

  • In February 2023, Tetra Pak, a leading food processing and packaging solutions company, introduced its new plant-based beverage processing line, the Tetra Evero Aseptic, designed specifically for plant-based beverages. This innovation enables producers to process and package various plant-based beverages, including almond, soy, and oat milk, with enhanced efficiency and sustainability (Tetra Pak Press Release, 2023).
  • In July 2024, Danish dairy cooperative Arla Foods entered into a strategic partnership with Danish engineering firm, FLSmidth, to develop and construct a new plant-based beverage production facility in Denmark. This collaboration is expected to significantly expand Arla's plant-based beverage offerings and strengthen its position in the global market (Arla Foods Press Release, 2024).
  • In October 2024, leading plant-based beverage company, Ripple Foods, raised a USD200 million Series E funding round, bringing its total funding to over USD500 million. This substantial investment will support the company's continued growth and expansion into new markets and product categories (Business Wire, 2024).
  • In March 2025, the European Union (EU) approved new regulations for plant-based beverage labeling, requiring plant-based milk alternatives to carry a label stating "plant-based" instead of using dairy terms such as "milk" or "cream." This policy change aims to prevent consumer confusion and promote transparency in the market (European Commission Press Release, 2025).

Research Analyst Overview

The plant-based beverages processing industry is experiencing significant activity and trends, driven by shifting consumer preferences towards healthier, sustainable options. Precision agriculture and ingredient sourcing play crucial roles in ensuring high-quality raw materials. Sustainability practices, such as waste reduction and energy efficiency, are essential for competitive advantage. Trade shows provide platforms for showcasing innovation hubs, including precision fermentation and sensory analysis, which enable product differentiation and development. Cell-based milk and fiber extraction are emerging areas of interest, offering extended shelf life and novel textures.

The Plant-Based Beverages Processing Equipment Market is advancing through innovations like energy-saving processing systems and scalable modular processing lines. Manufacturers are adopting zero-waste extraction technologies and IoT-enabled equipment monitoring for improved efficiency and sustainability. Demand for high-capacity aseptic systems is rising to meet large-scale production needs, while sustainable packaging solutions reduce environmental impact. Intelligent automation through AI-driven process optimization enhances product consistency. Techniques like low-temperature processing help retain nutrients, and compact homogenization units support space-efficient operations. Additionally, the use of recyclable equipment components reflects the industry's commitment to eco-friendly and responsible manufacturing practices.

The market's dynamic nature is further reflected in the emergence of plant-based dairy alternatives like plant-based cream, cheese, and Ice Cream, as well as the increasing popularity of alternative milk varieties like pea milk and pea protein processing and reverse osmosis-processed rice milk. The health and wellness trend continues to fuel market growth, with consumers seeking nutrient-rich, plant-based beverages that cater to diverse dietary needs, including plant-based diets and specific health conditions. Companies continue to innovate and adapt to meet these evolving consumer demands, ensuring the plant-based beverages processing market remains a vibrant and dynamic sector.

Industry associations foster collaboration and knowledge sharing, while packaging design caters to health trends and consumer demand. Flavor encapsulation and ingredient optimization contribute to product development, ensuring optimal taste and nutrition. Water conservation remains a priority in processing, as the industry strives to minimize its environmental footprint. Overall, these trends and practices shape the dynamic landscape of the plant-based beverages processing market.

Dive into Technavio's robust research methodology, blending expert interviews, extensive data synthesis, and validated models for unparalleled Plant-Based Beverages Processing Equipment Market insights. See full methodology.

Market Scope

Report Coverage

Details

Page number

182

Base year

2023

Historic period

2018-2022

Forecast period

2024-2028

Growth momentum & CAGR

Accelerate at a CAGR of 9.45%

Market growth 2024-2028

USD 1534.5 million

Market structure

Fragmented

YoY growth 2023-2024(%)

8.42

Key countries

US, China, Germany, Canada, India, South Korea, France, Japan, Italy, Brazil, UAE, UK, Spain, and Mexico

Competitive landscape

Leading Companies, Market Positioning of Companies, Competitive Strategies, and Industry Risks

Request Free Sample

What are the Key Data Covered in this Plant-Based Beverages Processing Equipment Market Research and Growth Report?

  • CAGR of the Plant-Based Beverages Processing Equipment industry during the forecast period
  • Detailed information on factors that will drive the growth and forecasting between 2024 and 2028
  • Precise estimation of the size of the market and its contribution of the industry in focus to the parent market
  • Accurate predictions about upcoming growth and trends and changes in consumer behaviour
  • Growth of the market across APAC, North America, Europe, South America, and Middle East and Africa
  • Thorough analysis of the market's competitive landscape and detailed information about companies
  • Comprehensive analysis of factors that will challenge the plant-based beverages processing equipment market growth of industry companies

We can help! Our analysts can customize this plant-based beverages processing equipment market research report to meet your requirements.

Get in touch

1 Executive Summary

  • 1.1 Market overview
    • Executive Summary - Chart on Market Overview
    • Executive Summary - Data Table on Market Overview
    • Executive Summary - Chart on Global Market Characteristics
    • Executive Summary - Chart on Market by Geography
    • Executive Summary - Chart on Market Segmentation by Product Type
    • Executive Summary - Chart on Market Segmentation by Type
    • Executive Summary - Chart on Incremental Growth
    • Executive Summary - Data Table on Incremental Growth
    • Executive Summary - Chart on Company Market Positioning

2 Market Landscape

  • 2.1 Market ecosystem
    • Parent Market
    • Data Table on - Parent Market
  • 2.2 Market characteristics
    • Market characteristics analysis
  • 2.3 Value chain analysis
    • Value Chain Analysis

3 Market Sizing

  • 3.1 Market definition
    • Offerings of companies included in the market definition
  • 3.2 Market segment analysis
    • Market segments
  • 3.3 Market size 2023
    • 3.4 Market outlook: Forecast for 2023-2028
      • Chart on Global - Market size and forecast 2023-2028 ($ million)
      • Data Table on Global - Market size and forecast 2023-2028 ($ million)
      • Chart on Global Market: Year-over-year growth 2023-2028 (%)
      • Data Table on Global Market: Year-over-year growth 2023-2028 (%)

    4 Historic Market Size

    • 4.1 Global Plant-Based Beverages Processing Equipment Market 2018 - 2022
      • Historic Market Size - Data Table on Global Plant-Based Beverages Processing Equipment Market 2018 - 2022 ($ million)
    • 4.2 Product Type segment analysis 2018 - 2022
      • Historic Market Size - Product Type Segment 2018 - 2022 ($ million)
    • 4.3 Type segment analysis 2018 - 2022
      • Historic Market Size - Type Segment 2018 - 2022 ($ million)
    • 4.4 Geography segment analysis 2018 - 2022
      • Historic Market Size - Geography Segment 2018 - 2022 ($ million)
    • 4.5 Country segment analysis 2018 - 2022
      • Historic Market Size - Country Segment 2018 - 2022 ($ million)

    5 Five Forces Analysis

    • 5.1 Five forces summary
      • Five forces analysis - Comparison between 2023 and 2028
    • 5.2 Bargaining power of buyers
      • Bargaining power of buyers - Impact of key factors 2023 and 2028
    • 5.3 Bargaining power of suppliers
      • Bargaining power of suppliers - Impact of key factors in 2023 and 2028
    • 5.4 Threat of new entrants
      • Threat of new entrants - Impact of key factors in 2023 and 2028
    • 5.5 Threat of substitutes
      • Threat of substitutes - Impact of key factors in 2023 and 2028
    • 5.6 Threat of rivalry
      • Threat of rivalry - Impact of key factors in 2023 and 2028
    • 5.7 Market condition
      • Chart on Market condition - Five forces 2023 and 2028

    6 Market Segmentation by Product Type

    • 6.1 Market segments
      • Chart on Product Type - Market share (2023-2028) (%)
      • Data Table on Product Type - Market share (2023-2028) (%)
    • 6.2 Comparison by Product Type
      • Chart on Comparison by Product Type
      • Data Table on Comparison by Product Type
    • 6.3 Homogenizer - Market size and forecast (2023-2028)
      • Chart on Homogenizer - Market size and forecast (2023-2028) ($ million)
      • Data Table on Homogenizer - Market size and forecast (2023-2028) ($ million)
      • Chart on Homogenizer - Year-over-year growth (2023-2028) (%)
      • Data Table on Homogenizer - Year-over-year growth (2023-2028) (%)
    • 6.4 Filtration - Market size and forecast (2023-2028)
      • Chart on Filtration - Market size and forecast (2023-2028) ($ million)
      • Data Table on Filtration - Market size and forecast (2023-2028) ($ million)
      • Chart on Filtration - Year-over-year growth (2023-2028) (%)
      • Data Table on Filtration - Year-over-year growth (2023-2028) (%)
    • 6.5 Heat exchangers - Market size and forecast (2023-2028)
      • Chart on Heat exchangers - Market size and forecast (2023-2028) ($ million)
      • Data Table on Heat exchangers - Market size and forecast (2023-2028) ($ million)
      • Chart on Heat exchangers - Year-over-year growth (2023-2028) (%)
      • Data Table on Heat exchangers - Year-over-year growth (2023-2028) (%)
    • 6.6 Filling and packaging systems - Market size and forecast (2023-2028)
      • Chart on Filling and packaging systems - Market size and forecast (2023-2028) ($ million)
      • Data Table on Filling and packaging systems - Market size and forecast (2023-2028) ($ million)
      • Chart on Filling and packaging systems - Year-over-year growth (2023-2028) (%)
      • Data Table on Filling and packaging systems - Year-over-year growth (2023-2028) (%)
    • 6.7 Others - Market size and forecast (2023-2028)
      • Chart on Others - Market size and forecast (2023-2028) ($ million)
      • Data Table on Others - Market size and forecast (2023-2028) ($ million)
      • Chart on Others - Year-over-year growth (2023-2028) (%)
      • Data Table on Others - Year-over-year growth (2023-2028) (%)
    • 6.8 Market opportunity by Product Type
      • Market opportunity by Product Type ($ million)
      • Data Table on Market opportunity by Product Type ($ million)

    7 Market Segmentation by Type

    • 7.1 Market segments
      • Chart on Type - Market share (2023-2028) (%)
      • Data Table on Type - Market share (2023-2028) (%)
    • 7.2 Comparison by Type
      • Chart on Comparison by Type
      • Data Table on Comparison by Type
    • 7.3 Soy - Market size and forecast (2023-2028)
      • Chart on Soy - Market size and forecast (2023-2028) ($ million)
      • Data Table on Soy - Market size and forecast (2023-2028) ($ million)
      • Chart on Soy - Year-over-year growth (2023-2028) (%)
      • Data Table on Soy - Year-over-year growth (2023-2028) (%)
    • 7.4 Almond - Market size and forecast (2023-2028)
      • Chart on Almond - Market size and forecast (2023-2028) ($ million)
      • Data Table on Almond - Market size and forecast (2023-2028) ($ million)
      • Chart on Almond - Year-over-year growth (2023-2028) (%)
      • Data Table on Almond - Year-over-year growth (2023-2028) (%)
    • 7.5 Oat - Market size and forecast (2023-2028)
      • Chart on Oat - Market size and forecast (2023-2028) ($ million)
      • Data Table on Oat - Market size and forecast (2023-2028) ($ million)
      • Chart on Oat - Year-over-year growth (2023-2028) (%)
      • Data Table on Oat - Year-over-year growth (2023-2028) (%)
    • 7.6 Others - Market size and forecast (2023-2028)
      • Chart on Others - Market size and forecast (2023-2028) ($ million)
      • Data Table on Others - Market size and forecast (2023-2028) ($ million)
      • Chart on Others - Year-over-year growth (2023-2028) (%)
      • Data Table on Others - Year-over-year growth (2023-2028) (%)
    • 7.7 Market opportunity by Type
      • Market opportunity by Type ($ million)
      • Data Table on Market opportunity by Type ($ million)

    8 Market Segmentation by End-User

    • 8.1 Market segments
      • Chart on End-User - Market share (2023-2028) (%)
      • Data Table on End-User - Market share (2023-2028) (%)
    • 8.2 Comparison by End-User
      • Chart on Comparison by End-User
      • Data Table on Comparison by End-User
    • 8.3 Large-Scale Manufacturers - Market size and forecast (2023-2028)
      • Chart on Large-Scale Manufacturers - Market size and forecast (2023-2028) ($ million)
      • Data Table on Large-Scale Manufacturers - Market size and forecast (2023-2028) ($ million)
      • Chart on Large-Scale Manufacturers - Year-over-year growth (2023-2028) (%)
      • Data Table on Large-Scale Manufacturers - Year-over-year growth (2023-2028) (%)
    • 8.4 SMEs - Market size and forecast (2023-2028)
      • Chart on SMEs - Market size and forecast (2023-2028) ($ million)
      • Data Table on SMEs - Market size and forecast (2023-2028) ($ million)
      • Chart on SMEs - Year-over-year growth (2023-2028) (%)
      • Data Table on SMEs - Year-over-year growth (2023-2028) (%)
    • 8.5 Contract Manufacturers - Market size and forecast (2023-2028)
      • Chart on Contract Manufacturers - Market size and forecast (2023-2028) ($ million)
      • Data Table on Contract Manufacturers - Market size and forecast (2023-2028) ($ million)
      • Chart on Contract Manufacturers - Year-over-year growth (2023-2028) (%)
      • Data Table on Contract Manufacturers - Year-over-year growth (2023-2028) (%)
    • 8.6 Market opportunity by End-User
      • Market opportunity by End-User ($ million)
      • Data Table on Market opportunity by End-User ($ million)

    9 Market Segmentation by Technology

    • 9.1 Market segments
      • Chart on Technology - Market share (2023-2028) (%)
      • Data Table on Technology - Market share (2023-2028) (%)
    • 9.2 Comparison by Technology
      • Chart on Comparison by Technology
      • Data Table on Comparison by Technology
    • 9.3 Automated Systems - Market size and forecast (2023-2028)
      • Chart on Automated Systems - Market size and forecast (2023-2028) ($ million)
      • Data Table on Automated Systems - Market size and forecast (2023-2028) ($ million)
      • Chart on Automated Systems - Year-over-year growth (2023-2028) (%)
      • Data Table on Automated Systems - Year-over-year growth (2023-2028) (%)
    • 9.4 Manual Systems - Market size and forecast (2023-2028)
      • Chart on Manual Systems - Market size and forecast (2023-2028) ($ million)
      • Data Table on Manual Systems - Market size and forecast (2023-2028) ($ million)
      • Chart on Manual Systems - Year-over-year growth (2023-2028) (%)
      • Data Table on Manual Systems - Year-over-year growth (2023-2028) (%)
    • 9.5 Hybrid Systems - Market size and forecast (2023-2028)
      • Chart on Hybrid Systems - Market size and forecast (2023-2028) ($ million)
      • Data Table on Hybrid Systems - Market size and forecast (2023-2028) ($ million)
      • Chart on Hybrid Systems - Year-over-year growth (2023-2028) (%)
      • Data Table on Hybrid Systems - Year-over-year growth (2023-2028) (%)
    • 9.6 Market opportunity by Technology
      • Market opportunity by Technology ($ million)
      • Data Table on Market opportunity by Technology ($ million)

    10 Market Segmentation by Distribution Channel

    • 10.1 Market segments
      • Chart on Distribution Channel - Market share (2023-2028) (%)
      • Data Table on Distribution Channel - Market share (2023-2028) (%)
    • 10.2 Comparison by Distribution Channel
      • Chart on Comparison by Distribution Channel
      • Data Table on Comparison by Distribution Channel
    • 10.3 Direct Sales - Market size and forecast (2023-2028)
      • Chart on Direct Sales - Market size and forecast (2023-2028) ($ million)
      • Data Table on Direct Sales - Market size and forecast (2023-2028) ($ million)
      • Chart on Direct Sales - Year-over-year growth (2023-2028) (%)
      • Data Table on Direct Sales - Year-over-year growth (2023-2028) (%)
    • 10.4 Equipment Distributors - Market size and forecast (2023-2028)
      • Chart on Equipment Distributors - Market size and forecast (2023-2028) ($ million)
      • Data Table on Equipment Distributors - Market size and forecast (2023-2028) ($ million)
      • Chart on Equipment Distributors - Year-over-year growth (2023-2028) (%)
      • Data Table on Equipment Distributors - Year-over-year growth (2023-2028) (%)
    • 10.5 Online Platforms - Market size and forecast (2023-2028)
      • Chart on Online Platforms - Market size and forecast (2023-2028) ($ million)
      • Data Table on Online Platforms - Market size and forecast (2023-2028) ($ million)
      • Chart on Online Platforms - Year-over-year growth (2023-2028) (%)
      • Data Table on Online Platforms - Year-over-year growth (2023-2028) (%)
    • 10.6 Market opportunity by Distribution Channel
      • Market opportunity by Distribution Channel ($ million)
      • Data Table on Market opportunity by Distribution Channel ($ million)

    11 Customer Landscape

    • 11.1 Customer landscape overview
      • Analysis of price sensitivity, lifecycle, customer purchase basket, adoption rates, and purchase criteria

    12 Geographic Landscape

    • 12.1 Geographic segmentation
      • Chart on Market share by geography 2023-2028 (%)
      • Data Table on Market share by geography 2023-2028 (%)
    • 12.2 Geographic comparison
      • Chart on Geographic comparison
      • Data Table on Geographic comparison
    • 12.3 APAC - Market size and forecast 2023-2028
      • Chart on APAC - Market size and forecast 2023-2028 ($ million)
      • Data Table on APAC - Market size and forecast 2023-2028 ($ million)
      • Chart on APAC - Year-over-year growth 2023-2028 (%)
      • Data Table on APAC - Year-over-year growth 2023-2028 (%)
    • 12.4 North America - Market size and forecast 2023-2028
      • Chart on North America - Market size and forecast 2023-2028 ($ million)
      • Data Table on North America - Market size and forecast 2023-2028 ($ million)
      • Chart on North America - Year-over-year growth 2023-2028 (%)
      • Data Table on North America - Year-over-year growth 2023-2028 (%)
    • 12.5 Europe - Market size and forecast 2023-2028
      • Chart on Europe - Market size and forecast 2023-2028 ($ million)
      • Data Table on Europe - Market size and forecast 2023-2028 ($ million)
      • Chart on Europe - Year-over-year growth 2023-2028 (%)
      • Data Table on Europe - Year-over-year growth 2023-2028 (%)
    • 12.6 South America - Market size and forecast 2023-2028
      • Chart on South America - Market size and forecast 2023-2028 ($ million)
      • Data Table on South America - Market size and forecast 2023-2028 ($ million)
      • Chart on South America - Year-over-year growth 2023-2028 (%)
      • Data Table on South America - Year-over-year growth 2023-2028 (%)
    • 12.7 Middle East and Africa - Market size and forecast 2023-2028
      • Chart on Middle East and Africa - Market size and forecast 2023-2028 ($ million)
      • Data Table on Middle East and Africa - Market size and forecast 2023-2028 ($ million)
      • Chart on Middle East and Africa - Year-over-year growth 2023-2028 (%)
      • Data Table on Middle East and Africa - Year-over-year growth 2023-2028 (%)
    • 12.8 China - Market size and forecast 2023-2028
      • Chart on China - Market size and forecast 2023-2028 ($ million)
      • Data Table on China - Market size and forecast 2023-2028 ($ million)
      • Chart on China - Year-over-year growth 2023-2028 (%)
      • Data Table on China - Year-over-year growth 2023-2028 (%)
    • 12.9 US - Market size and forecast 2023-2028
      • Chart on US - Market size and forecast 2023-2028 ($ million)
      • Data Table on US - Market size and forecast 2023-2028 ($ million)
      • Chart on US - Year-over-year growth 2023-2028 (%)
      • Data Table on US - Year-over-year growth 2023-2028 (%)
    • 12.10 India - Market size and forecast 2023-2028
      • Chart on India - Market size and forecast 2023-2028 ($ million)
      • Data Table on India - Market size and forecast 2023-2028 ($ million)
      • Chart on India - Year-over-year growth 2023-2028 (%)
      • Data Table on India - Year-over-year growth 2023-2028 (%)
    • 12.11 Japan - Market size and forecast 2023-2028
      • Chart on Japan - Market size and forecast 2023-2028 ($ million)
      • Data Table on Japan - Market size and forecast 2023-2028 ($ million)
      • Chart on Japan - Year-over-year growth 2023-2028 (%)
      • Data Table on Japan - Year-over-year growth 2023-2028 (%)
    • 12.12 Thailand - Market size and forecast 2023-2028
      • Chart on Thailand - Market size and forecast 2023-2028 ($ million)
      • Data Table on Thailand - Market size and forecast 2023-2028 ($ million)
      • Chart on Thailand - Year-over-year growth 2023-2028 (%)
      • Data Table on Thailand - Year-over-year growth 2023-2028 (%)
    • 12.13 Market opportunity by geography
      • Market opportunity by geography ($ million)
      • Data Tables on Market opportunity by geography ($ million)
    • 12.14 Germany - Market size and forecast (2023-2028)
      • Chart on Germany - Market size and forecast (2023-2028) ($ million)
      • Data Table on Germany - Market size and forecast (2023-2028) ($ million)
      • Chart on Germany - Year-over-year growth (2023-2028) (%)
      • Data Table on Germany - Year-over-year growth (2023-2028) (%)
    • 12.15 Canada - Market size and forecast (2023-2028)
      • Chart on Canada - Market size and forecast (2023-2028) ($ million)
      • Data Table on Canada - Market size and forecast (2023-2028) ($ million)
      • Chart on Canada - Year-over-year growth (2023-2028) (%)
      • Data Table on Canada - Year-over-year growth (2023-2028) (%)
    • 12.16 South Korea - Market size and forecast (2023-2028)
      • Chart on South Korea - Market size and forecast (2023-2028) ($ million)
      • Data Table on South Korea - Market size and forecast (2023-2028) ($ million)
      • Chart on South Korea - Year-over-year growth (2023-2028) (%)
      • Data Table on South Korea - Year-over-year growth (2023-2028) (%)
    • 12.17 France - Market size and forecast (2023-2028)
      • Chart on France - Market size and forecast (2023-2028) ($ million)
      • Data Table on France - Market size and forecast (2023-2028) ($ million)
      • Chart on France - Year-over-year growth (2023-2028) (%)
      • Data Table on France - Year-over-year growth (2023-2028) (%)
    • 12.18 Italy - Market size and forecast (2023-2028)
      • Chart on Italy - Market size and forecast (2023-2028) ($ million)
      • Data Table on Italy - Market size and forecast (2023-2028) ($ million)
      • Chart on Italy - Year-over-year growth (2023-2028) (%)
      • Data Table on Italy - Year-over-year growth (2023-2028) (%)
    • 12.19 Brazil - Market size and forecast (2023-2028)
      • Chart on Brazil - Market size and forecast (2023-2028) ($ million)
      • Data Table on Brazil - Market size and forecast (2023-2028) ($ million)
      • Chart on Brazil - Year-over-year growth (2023-2028) (%)
      • Data Table on Brazil - Year-over-year growth (2023-2028) (%)
    • 12.20 UAE - Market size and forecast (2023-2028)
      • Chart on UAE - Market size and forecast (2023-2028) ($ million)
      • Data Table on UAE - Market size and forecast (2023-2028) ($ million)
      • Chart on UAE - Year-over-year growth (2023-2028) (%)
      • Data Table on UAE - Year-over-year growth (2023-2028) (%)
    • 12.21 UK - Market size and forecast (2023-2028)
      • Chart on UK - Market size and forecast (2023-2028) ($ million)
      • Data Table on UK - Market size and forecast (2023-2028) ($ million)
      • Chart on UK - Year-over-year growth (2023-2028) (%)
      • Data Table on UK - Year-over-year growth (2023-2028) (%)
    • 12.22 Spain - Market size and forecast (2023-2028)
      • Chart on Spain - Market size and forecast (2023-2028) ($ million)
      • Data Table on Spain - Market size and forecast (2023-2028) ($ million)
      • Chart on Spain - Year-over-year growth (2023-2028) (%)
      • Data Table on Spain - Year-over-year growth (2023-2028) (%)
    • 12.23 Mexico - Market size and forecast (2023-2028)
      • Chart on Mexico - Market size and forecast (2023-2028) ($ million)
      • Data Table on Mexico - Market size and forecast (2023-2028) ($ million)
      • Chart on Mexico - Year-over-year growth (2023-2028) (%)
      • Data Table on Mexico - Year-over-year growth (2023-2028) (%)
    • 12.24 Rest of World (ROW) - Market size and forecast (2023-2028)
      • Chart on Rest of World (ROW) - Market size and forecast (2023-2028) ($ million)
      • Data Table on Rest of World (ROW) - Market size and forecast (2023-2028) ($ million)
      • Chart on Rest of World (ROW) - Year-over-year growth (2023-2028) (%)
      • Data Table on Rest of World (ROW) - Year-over-year growth (2023-2028) (%)

    13 Drivers, Challenges, and Opportunity/Restraints

    • 13.1 Market drivers
      • 13.2 Market challenges
        • 13.3 Impact of drivers and challenges
          • Impact of drivers and challenges in 2023 and 2028
        • 13.4 Market opportunities/restraints

          14 Competitive Landscape

          • 14.1 Overview
            • 14.2 Competitive Landscape
              • Overview on criticality of inputs and factors of differentiation
            • 14.3 Landscape disruption
              • Overview on factors of disruption
            • 14.4 Industry risks
              • Impact of key risks on business

            15 Competitive Analysis

            • 15.1 Companies profiled
              • Companies covered
            • 15.2 Market positioning of companies
              • Matrix on companies position and classification
            • 15.3 Tetra Pak International S.A.
              • Tetra Pak International S.A. - Overview
              • Tetra Pak International S.A. - Product / Service
              • Tetra Pak International S.A. - Key offerings
            • 15.4 Alfa Laval AB
              • Alfa Laval AB - Overview
              • Alfa Laval AB - Product / Service
              • Alfa Laval AB - Key offerings
            • 15.5 GEA Group AG
              • GEA Group AG - Overview
              • GEA Group AG - Product / Service
              • GEA Group AG - Key offerings
            • 15.6 SPX FLOW Inc.
              • SPX FLOW Inc. - Overview
              • SPX FLOW Inc. - Product / Service
              • SPX FLOW Inc. - Key offerings
            • 15.7 Buhler AG
              • Buhler AG - Overview
              • Buhler AG - Product / Service
              • Buhler AG - Key offerings
            • 15.8 Krones AG
              • Krones AG - Overview
              • Krones AG - Product / Service
              • Krones AG - Key offerings
            • 15.9 JBT Corporation
              • JBT Corporation - Overview
              • JBT Corporation - Product / Service
              • JBT Corporation - Key offerings
            • 15.10 Feldmeier Equipment Inc.
              • Feldmeier Equipment Inc. - Overview
              • Feldmeier Equipment Inc. - Product / Service
              • Feldmeier Equipment Inc. - Key offerings
            • 15.11 HRS Process Systems Ltd.
              • HRS Process Systems Ltd. - Overview
              • HRS Process Systems Ltd. - Product / Service
              • HRS Process Systems Ltd. - Key offerings
            • 15.12 MicroThermics Inc.
              • MicroThermics Inc. - Overview
              • MicroThermics Inc. - Product / Service
              • MicroThermics Inc. - Key offerings
            • 15.13 Shanghai Jimei Food Machinery Co., Ltd.
              • Shanghai Jimei Food Machinery Co., Ltd. - Overview
              • Shanghai Jimei Food Machinery Co., Ltd. - Product / Service
              • Shanghai Jimei Food Machinery Co., Ltd. - Key offerings
            • 15.14 ProXES GmbH
              • ProXES GmbH - Overview
              • ProXES GmbH - Product / Service
              • ProXES GmbH - Key offerings
            • 15.15 Scherjon Dairy Equipment Holland
              • Scherjon Dairy Equipment Holland - Overview
              • Scherjon Dairy Equipment Holland - Product / Service
              • Scherjon Dairy Equipment Holland - Key offerings
            • 15.16 Stephan Machinery GmbH
              • Stephan Machinery GmbH - Overview
              • Stephan Machinery GmbH - Product / Service
              • Stephan Machinery GmbH - Key offerings
            • 15.17 Techno Process Equipment
              • Techno Process Equipment - Overview
              • Techno Process Equipment - Product / Service
              • Techno Process Equipment - Key offerings
            • 15.18 Della Toffola SpA
              • Della Toffola SpA - Overview
              • Della Toffola SpA - Product / Service
              • Della Toffola SpA - Key offerings
            • 15.19 Anderson Dahlen Inc.
              • Anderson Dahlen Inc. - Overview
              • Anderson Dahlen Inc. - Product / Service
              • Anderson Dahlen Inc. - Key offerings
            • 15.20 Secomak Ltd.
              • Secomak Ltd. - Overview
              • Secomak Ltd. - Product / Service
              • Secomak Ltd. - Key offerings
            • 15.21 Idaho Milk Products
              • Idaho Milk Products - Overview
              • Idaho Milk Products - Product / Service
              • Idaho Milk Products - Key offerings
            • 15.22 Clextral S.A.S.
              • Clextral S.A.S. - Overview
              • Clextral S.A.S. - Product / Service
              • Clextral S.A.S. - Key offerings
            • 15.23 Tetra Pak International S.A. (Switzerland)
              • Tetra Pak International S.A. (Switzerland) - Overview
              • Tetra Pak International S.A. (Switzerland) - Product / Service
              • Tetra Pak International S.A. (Switzerland) - Key offerings
            • 15.24 Alfa Laval AB (Sweden)
              • Alfa Laval AB (Sweden) - Overview
              • Alfa Laval AB (Sweden) - Product / Service
              • Alfa Laval AB (Sweden) - Key offerings
            • 15.25 GEA Group AG (Germany)
              • GEA Group AG (Germany) - Overview
              • GEA Group AG (Germany) - Product / Service
              • GEA Group AG (Germany) - Key offerings
            • 15.26 SPX FLOW Inc. (United States)
              • SPX FLOW Inc. (United States) - Overview
              • SPX FLOW Inc. (United States) - Product / Service
              • SPX FLOW Inc. (United States) - Key offerings
            • 15.27 Buhler AG (Switzerland)
              • Buhler AG (Switzerland) - Overview
              • Buhler AG (Switzerland) - Product / Service
              • Buhler AG (Switzerland) - Key offerings
            • 15.28 Krones AG (Germany)
              • Krones AG (Germany) - Overview
              • Krones AG (Germany) - Product / Service
              • Krones AG (Germany) - Key offerings
            • 15.29 JBT Corporation (United States)
              • JBT Corporation (United States) - Overview
              • JBT Corporation (United States) - Product / Service
              • JBT Corporation (United States) - Key offerings
            • 15.30 Feldmeier Equipment Inc. (United States)
              • Feldmeier Equipment Inc. (United States) - Overview
              • Feldmeier Equipment Inc. (United States) - Product / Service
              • Feldmeier Equipment Inc. (United States) - Key offerings
            • 15.31 HRS Process Systems Ltd. (India)
              • HRS Process Systems Ltd. (India) - Overview
              • HRS Process Systems Ltd. (India) - Product / Service
              • HRS Process Systems Ltd. (India) - Key offerings
            • 15.32 MicroThermics Inc. (United States)
              • MicroThermics Inc. (United States) - Overview
              • MicroThermics Inc. (United States) - Product / Service
              • MicroThermics Inc. (United States) - Key offerings
            • 15.33 Shanghai Jimei Food Machinery Co., Ltd. (China)
              • Shanghai Jimei Food Machinery Co., Ltd. (China) - Overview
              • Shanghai Jimei Food Machinery Co., Ltd. (China) - Product / Service
              • Shanghai Jimei Food Machinery Co., Ltd. (China) - Key offerings
            • 15.34 ProXES GmbH (Germany)
              • ProXES GmbH (Germany) - Overview
              • ProXES GmbH (Germany) - Product / Service
              • ProXES GmbH (Germany) - Key offerings
            • 15.35 Scherjon Dairy Equipment Holland (Netherlands)
              • Scherjon Dairy Equipment Holland (Netherlands) - Overview
              • Scherjon Dairy Equipment Holland (Netherlands) - Product / Service
              • Scherjon Dairy Equipment Holland (Netherlands) - Key offerings
            • 15.36 Stephan Machinery GmbH (Germany)
              • Stephan Machinery GmbH (Germany) - Overview
              • Stephan Machinery GmbH (Germany) - Product / Service
              • Stephan Machinery GmbH (Germany) - Key offerings
            • 15.37 Techno Process Equipment (India)
              • Techno Process Equipment (India) - Overview
              • Techno Process Equipment (India) - Product / Service
              • Techno Process Equipment (India) - Key offerings
            • 15.38 Della Toffola SpA (Italy)
              • Della Toffola SpA (Italy) - Overview
              • Della Toffola SpA (Italy) - Product / Service
              • Della Toffola SpA (Italy) - Key offerings
            • 15.39 Anderson Dahlen Inc. (United States)
              • Anderson Dahlen Inc. (United States) - Overview
              • Anderson Dahlen Inc. (United States) - Product / Service
              • Anderson Dahlen Inc. (United States) - Key offerings
            • 15.40 Secomak Ltd. (United Kingdom)
              • Secomak Ltd. (United Kingdom) - Overview
              • Secomak Ltd. (United Kingdom) - Product / Service
              • Secomak Ltd. (United Kingdom) - Key offerings
            • 15.41 Idaho Milk Products (United States)
              • Idaho Milk Products (United States) - Overview
              • Idaho Milk Products (United States) - Product / Service
              • Idaho Milk Products (United States) - Key offerings
            • 15.42 Clextral S.A.S. (France)
              • Clextral S.A.S. (France) - Overview
              • Clextral S.A.S. (France) - Product / Service
              • Clextral S.A.S. (France) - Key offerings

            16 Appendix

            • 16.1 Scope of the report
              • 16.2 Inclusions and exclusions checklist
                • Inclusions checklist
                • Exclusions checklist
              • 16.3 Currency conversion rates for US$
                • Currency conversion rates for US$
              • 16.4 Research methodology
                • Research methodology
              • 16.5 Data procurement
                • Information sources
              • 16.6 Data validation
                • Data validation
              • 16.7 Validation techniques employed for market sizing
                • Validation techniques employed for market sizing
              • 16.8 Data synthesis
                • Data synthesis
              • 16.9 360 degree market analysis
                • 360 degree market analysis
              • 16.10 List of abbreviations
                • List of abbreviations

              Research Methodology

              Technavio presents a detailed picture of the market by way of study, synthesis, and summation of data from multiple sources. The analysts have presented the various facets of the market with a particular focus on identifying the key industry influencers. The data thus presented is comprehensive, reliable, and the result of extensive research, both primary and secondary.

              INFORMATION SOURCES

              Primary sources

              • Manufacturers and suppliers
              • Channel partners
              • Industry experts
              • Strategic decision makers

              Secondary sources

              • Industry journals and periodicals
              • Government data
              • Financial reports of key industry players
              • Historical data
              • Press releases

              DATA ANALYSIS

              Data Synthesis

              • Collation of data
              • Estimation of key figures
              • Analysis of derived insights

              Data Validation

              • Triangulation with data models
              • Reference against proprietary databases
              • Corroboration with industry experts

              REPORT WRITING

              Qualitative

              • Market drivers
              • Market challenges
              • Market trends
              • Five forces analysis

              Quantitative

              • Market size and forecast
              • Market segmentation
              • Geographical insights
              • Competitive landscape

              Interested in this report?

              Get your sample now to see our research methodology and insights!

              Download Now

              Frequently Asked Questions

              Plant-Based Beverages Processing Equipment market growth will increase by $ 1534.5 mn during 2024-2028 .

              The Plant-Based Beverages Processing Equipment market is expected to grow at a CAGR of 9.45% during 2024-2028 .

              Plant-Based Beverages Processing Equipment market is segmented by Product Type( Homogenizer, Filtration, Heat exchangers, Filling and packaging systems, Others) Type( Soy, Almond, Oat, Others)

              Tetra Pak International S.A., Alfa Laval AB, GEA Group AG, SPX FLOW Inc., Buhler AG, Krones AG, JBT Corporation, Feldmeier Equipment Inc., HRS Process Systems Ltd., MicroThermics Inc., Shanghai Jimei Food Machinery Co., Ltd., ProXES GmbH, Scherjon Dairy Equipment Holland, Stephan Machinery GmbH, Techno Process Equipment, Della Toffola SpA, Anderson Dahlen Inc., Secomak Ltd., Idaho Milk Products, Clextral S.A.S. are a few of the key vendors in the Plant-Based Beverages Processing Equipment market.

              APAC will register the highest growth rate of 64% among the other regions. Therefore, the Plant-Based Beverages Processing Equipment market in APAC is expected to garner significant business opportunities for the vendors during the forecast period.

              US, China, Germany, Canada, India, South Korea, France, Japan, Italy, Brazil, UAE, UK, Spain, Mexico

              • Increasing demand for single-serve is the driving factor this market.
              • multi-packs and sustainable packagingThe number of single-person households is growing is the driving factor this market.
              • which is expected to increase the demand for single-serve packs in the beverage market. Countries in Europe is the driving factor this market.
              • such as Denmark is the driving factor this market.
              • Finland is the driving factor this market.
              • and Germany is the driving factor this market.
              • have high percentages of single-person households. Therefore is the driving factor this market.
              • there is a rise in the demand for single-serve packs. For example is the driving factor this market.
              • Smirnoff provides vodka in single-serving plastic bottles. There is an increase in the demand for single-serve packs from buyers as they are looking for options that use less shelf space. In addition is the driving factor this market.
              • buyers and retailers are seeking multi-packs and a variety of packs to attract consumers to try new products or new varieties of products launched by companies. Furthermore is the driving factor this market.
              • there is an increase in the demand for sustainable packaging as buyers are looking for ways to reduce their carbon footprint. Sustainable packaging offers advantages such as reduced packaging product weight and increased packaging materials reuse. For example is the driving factor this market.
              • in April 2018 is the driving factor this market.
              • Tetra Pak announced that it is developing a new paper-based straw is the driving factor this market.
              • which is expected to replace the small plastic straws that are usually used with small drink cartons. The growing demand for single-serve packs and multi-packs will increase the production volume of packaging material is the driving factor this market.
              • which is expected to increase the revenue of plant-based beverages processing equipment vendors. Moreover is the driving factor this market.
              • the increased demand for sustainable packaging will drive the global plant-based beverages processing equipment market. is the driving factor this market.

              The Plant-Based Beverages Processing Equipment market vendors should focus on grabbing business opportunities from the Homogenizer segment as it accounted for the largest market share in the base year.