Arsenic Triselenide Market Analysis APAC, North America, Europe, South America, Middle East and Africa - US, China, India, Germany, Japan, UK, Spain, France, Vietnam, Brazil - Size and Forecast 2024-2028

Arsenic Triselenide Market Analysis APAC, North America, Europe, South America, Middle East and Africa - US, China, India, Germany, Japan, UK, Spain, France, Vietnam, Brazil - Size and Forecast 2024-2028

Published: Nov 2024 199 Pages SKU: IRTNTR80368

Market Overview at a Glance

$181.3 Mn
Market Opportunity
5.7%
CAGR
5.5
YoY growth 2023-2024(%)

What is the Size of Arsenic Triselenide Market?

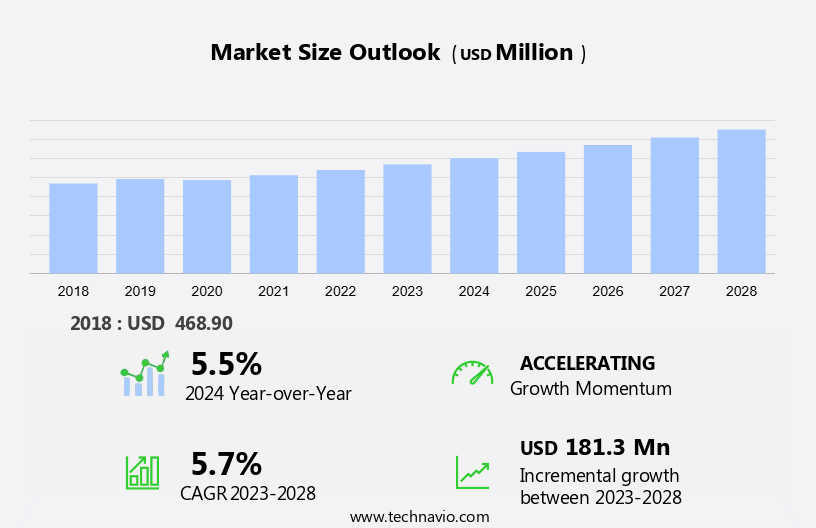
The arsenic triselenide market size is estimated to increase by USD 181.3 million, growing at a CAGR of 5.7% between 2023 and 2028. Arsenic triselenide is a nonlinear semiconductor material with significant applications in the defense industry and high-speed data transmission. The market for this compound is experiencing notable growth due to its high purity requirements and increasing demand for advanced technology. However, concerns regarding its toxicity pose a challenge to market expansion. To address this, there is a focus on improving production techniques and developing safer handling methods. The high-purity application of market in the defense sector for nonlinear optics and infrared detection is a major market driver. Additionally, the expansion of production facilities to meet the rising demand for high-speed data transmission solutions is expected to boost market growth. Despite these opportunities, the market faces challenges due to the toxic nature of this market, which necessitates stringent safety measures and regulatory compliance. In conclusion, the arsenic triselenide market is witnessing growth due to its applications in defense and high-speed data transmission, but the toxicity issues necessitate the development of safer production methods and handling techniques.

Arsenic Triselenide Market Size

Request Free Arsenic Triselenide Market Sample

Market Segment

The market research report provides comprehensive data (region-wise segment analysis), with forecasts and estimates in "USD million" for the period 2024-2028, as well as historical data from 2018 - 2022 for the following segments.

  • End-user
    • Electronics and semiconductors
    • Telecommunication
    • Others
  • Type
    • Powder
    • Crystals
    • Thin films
  • Geography
    • APAC
      • China
      • India
      • Japan
      • Vietnam
    • North America
      • US
    • Europe
      • Germany
      • UK
      • France
      • Spain
    • South America
      • Brazil
    • Middle East and Africa

Which is the Largest Segment Driving Market Growth?

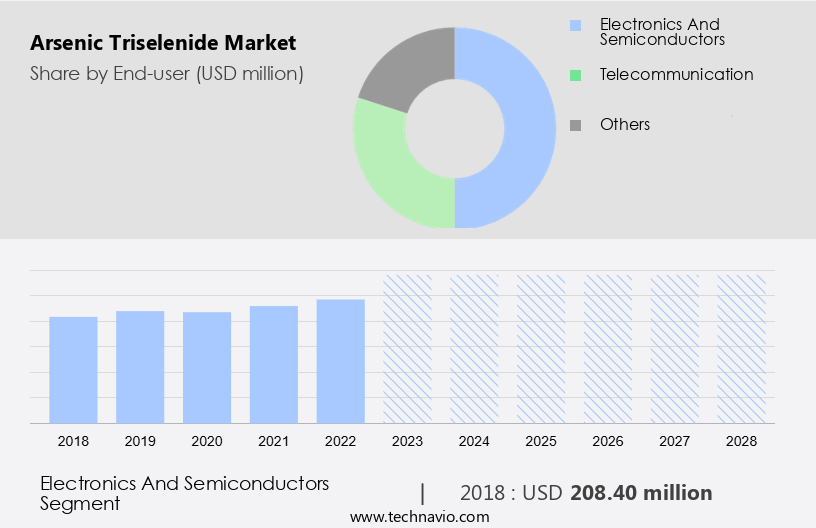
The electronics and semiconductors segment is estimated to witness significant growth during the forecast period. The market holds significant importance in the fields of infrared optics and laboratory settings due to its distinctive properties. This market's growth can be attributed to its extensive use in the electronics and semiconductor industry. A recent development that underscores this trend is the signing of a Memorandum of Understanding (MoU) between India and the European Union (EU) on November 21, 2023. This agreement aims to bolster semiconductor research, innovation, and technological advancements, thereby strengthening the semiconductor ecosystem and its supply chain. 

Arsenic Triselenide Market Size

Get a glance at the market share of various regions Download the PDF Sample

The electronics and semiconductors segment was valued at USD 208.4 million in 2018. Arsenic triselenide's unique properties, including its high refractive index and excellent optical characteristics, make it an indispensable component in the electronics and semiconductor sectors. Infrared optics, in particular, benefit significantly from arsenic triselenide's properties, as it is widely used in the production of infrared sensors. In the laboratory setting, arsenic triselenide is employed in various applications, such as catalysts, semiconductors, and pigments. Its versatility and unique properties make it a valuable addition to the research and development landscape. In summary, the market is poised for growth due to its applications in the electronics and semiconductor industry, specifically in infrared optics and laboratory settings. The recent MoU between India and the EU is a testament to the market's significance and the ongoing efforts to advance technology and innovation in this field.

Which Region is Leading the Market?

Arsenic Triselenide Market Share by Geography

For more insights on the market share of various regions Request Free Sample

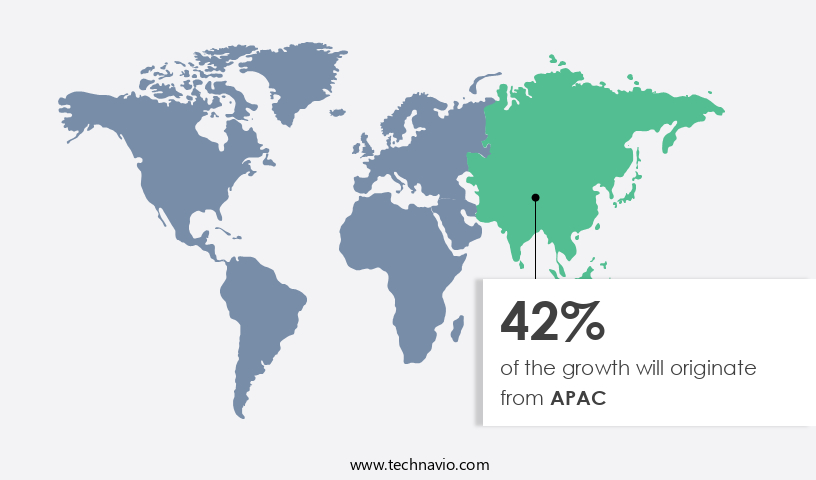
APAC is estimated to contribute 42% to the growth of the global market during the forecast period. Technavio's analysts have elaborately explained the regional trends and drivers that shape the market during the forecast period.

The Asia Pacific (APAC) region represents a significant market for arsenic triselenide due to the increasing demand for uniformity in electronics, telecommunications, and electrical products. In the financial year 2023-24, India imported approximately USD89.8 billion worth of these products, with over half coming from China and Hong Kong. China accounted for a 43.9% share of these imports, underlining the substantial reliance of India and other APAC countries on these countries for electronic components and goods. This heavy dependence on imports, particularly from China, poses a critical challenge for these countries. They must focus on enhancing economic resilience and safeguarding digital sovereignty by investing in research and development and fostering domestic production to reduce their reliance on external sources. This approach will not only ensure uniformity in the production of high refractive index materials like arsenic triselenide but also contribute to the overall growth and development of the electronics industry in the APAC region. From a business perspective, this trend presents opportunities for companies to establish a strong presence in the APAC market by providing high-quality, locally produced components and products that meet the growing demand for uniformity and advanced technology.

How do Technavio's company ranking index and market positioning come to your aid?

Companies are implementing various strategies, such as strategic alliances, partnerships, mergers and acquisitions, geographical expansion, and product/service launches, to enhance their presence in the market.

Advanced Engineering Materials Ltd. - The company offers arsenic triselenide used in semiconductor devices due to its unique electronic properties.

Technavio provides the ranking index for the top 20 companies along with insights on the market positioning of: 

  • American Elements
  • Ereztech LLC
  • ESPI Metals
  • Gelest Inc.
  • Goodfellow Cambridge Ltd.
  • Heeger Materials Inc.
  • Noah Chemicals
  • ProChem Inc.
  • Sigma Aldrich Chemicals Pvt. Ltd.
  • Stanford Advanced Materials
  • Thomas Scientific LLC
  • Vital Materials Co. Ltd.
  • XIAN FUNCTION MATERIAL GROUP CO LTD

Explore our company rankings and market positioning Request Free Sample

How can Technavio Assist you in Making Critical Decisions?

Arsenic Triselenide Market Size

What is the Market Structure and Year-over-Year growth of the Arsenic Triselenide Market?

Market structure

Concentrated

YoY growth 2023-2024

5.5

Market Dynamic

Arsenic triselenide (As2Se3) is a high-index chalcogenide material that has gained significant attention in the field of optical technology due to its unique properties. This inorganic compound is widely used in various applications, including optical design, optical fiber sensors, and optical instrumentation. This article provides an insightful analysis of the current state and future prospects of the market. Properties and Applications: Arsenic triselenide is a versatile material that exhibits excellent optical properties, such as high refractive index, low loss, and broadband absorption in the infrared region. These properties make it an ideal choice for various applications in optical technology. In the field of optical engineering, arsenic triselenide is used for the fabrication of optical components, such as lenses, mirrors, and waveguides, for use in optical systems. In the domain of material science, arsenic triselenide is extensively used in the development of optical sensors for infrared detection. These sensors find applications in various industries, including defense, healthcare, and environmental monitoring. Arsenic triselenide is also used in optical metrology for precise measurement and characterization of optical components.

Moreover, arsenic triselenide is an essential component in optical networking, where it is used for optical signal processing and fiber optic communication. Its high refractive index and low loss make it an excellent choice for the fabrication of integrated photonics devices, which are used for optical data transmission. The demand for arsenic triselenide in the optical technology market is driven by the increasing need for high-speed data transmission and the growing demand for advanced optical sensors. The development of new applications in areas such as infrared imaging and optical simulation is also expected to fuel the growth of the market. Arsenic triselenide is a vital material in the field of optical technology, with a wide range of applications in various domains, including optical design, optical fiber sensors, optical instrumentation, and optical networking. The unique properties of arsenic triselenide, such as its high refractive index and low loss, make it an indispensable component in the development of advanced optical systems and devices. The growing demand for high-speed data transmission and advanced optical sensors is expected to drive the growth of the arsenic triselenide market in the coming years. 

Our researchers analyzed the data with 2023 as the base year, along with the key drivers, trends, and challenges. A holistic analysis of drivers will help companies refine their marketing strategies to gain a competitive advantage.

What are the Primary Factors Driving the Market Growth?

The high application of arsenic triselenide is notably driving market growth. Arsenic triselenide is a vital compound with extensive applications in high-tech and industrial sectors. In the field of electronics and optics, arsenic triselenide is a crucial ingredient in the production of infrared-transmitting glass. This glass is indispensable for various optical components, such as advanced imaging systems and sensors, due to its unique properties. In the realm of pyrotechnics and pigments, arsenic triselenide is renowned for its ability to generate vibrant colors and stable compounds.

Moreover, it plays a significant role in the manufacturing of linoleum, contributing to the durability and superior quality of this popular flooring material. The global market for arsenic triselenide is thriving due to its versatility and essential role in these diverse applications. 


What are the Significant Trends being Witnessed in the Market?

Expansion of production facilities is the key trend in the market. The market is experiencing notable growth due to the expansion of production facilities in the industry. A significant development occurred in May 2022 when Ereztech, a leading company based in Saukville, Wisconsin, USA, acquired a new 30,000-square-foot facility. This modern production site will enhance capabilities, allowing for an increase in domestic production capacity and a more efficient supply chain.

Also, the expansion is particularly important for the provision of thin-film precursors, which are indispensable in chemical vapor deposition (CVD) and atomic layer deposition (ALD) processes. These techniques are crucial for manufacturing semiconductors and other advanced technologies that heavily rely on materials science. Thus, such trends will shape the growth of the market during the forecast period.


What are the Major Market Challenges?

Toxicity issues is the major challenge that affects the growth of the market. Arsenic triselenide, a compound consisting of arsenic and selenium elements, holds importance in various industries due to its unique properties. However, the market for this substance faces significant challenges due to the potential health hazards associated with its constituents. Arsenic, a toxic element, is primarily absorbed through ingestion but can also enter the body via skin contact or inhalation. Acute arsenic ingestion can lead to symptoms such as vomiting, abdominal pain, and diarrhea within half an hour. Subsequent symptoms may include numbness, tingling of extremities, muscle cramping, and, in severe cases, death.

Similarly, selenium, another component of arsenic triselenide, also poses health risks upon inhalation. These risks manifest in respiratory, gastrointestinal, and cardiovascular issues, along with skin and eye irritation. In the defense industry, high-purity arsenic triselenide is used for nonlinear optics applications, including high-speed data transmission. Despite these applications, the health concerns surrounding arsenic triselenide necessitate stringent safety measures and regulatory compliance. Hence, the above factors will impede the growth of the market during the forecast period


Exclusive Customer Landscape

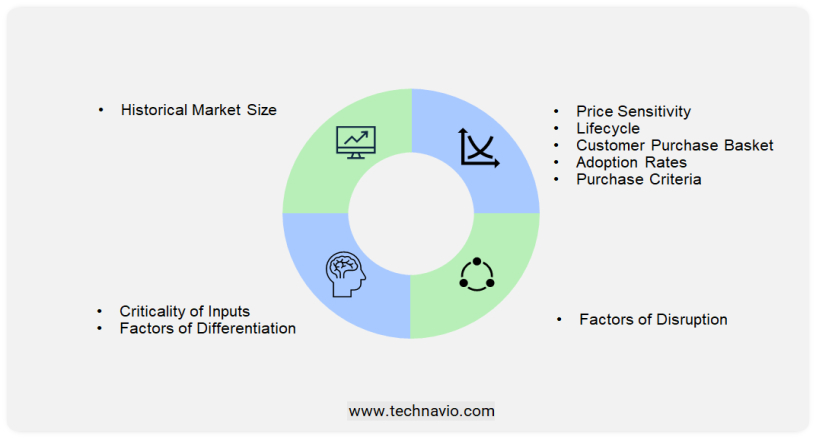
The market forecasting report includes the adoption lifecycle of the market, covering from the innovator's stage to the laggard's stage. It focuses on adoption rates in different regions based on penetration. Furthermore, the report also includes key purchase criteria and drivers of price sensitivity to help companies evaluate and develop their market growth analysis strategies.

Arsenic Triselenide Market Share by Geography

 Customer Landscape

Market Analyst Overview

Arsenic triselenide is a compound with the chemical formula As2Se3, known for its high refractive index and nonlinear optical properties. In the photonics industry, arsenic triselenide is widely used in the production of various optical components, including photonic integrated circuits, optical fibers, and waveguides. Its unique properties make it an essential material for infrared optics, targeting systems, and sensors in both laboratory settings and industrial applications. The manufacturing of arsenic triselenide involves the production of pellets or powder in high purity for use in bulk production. The compound's high uniformity and sensitivity make it suitable for detectors in telecommunications and defense industry applications, such as high-speed data transmission and surveillance systems. Arsenic triselenide's high refractive index and nonlinear optical properties also make it an ideal material for photonic devices, including infrared optics and optical devices used in the defense industry. Its granular form allows for easy integration into various optical communication systems and other photonic components. The uniformity and high purity of arsenic triselenide make it a valuable material in the production of various optical components, including sensors, detectors, and photonic devices. Its applications span across various industries, including telecommunications, defense, and industrial settings, making it a crucial component in the development of advanced optical communication systems and photonic devices.

Market Scope

Report Coverage

Details

Page number

199

Base year

2023

Historic period

2018 - 2022

Forecast period

2024-2028

Growth momentum & CAGR

Accelerate at a CAGR of 5.7%

Market growth 2024-2028

USD 181.3 million

Regional analysis

APAC, North America, Europe, South America, and Middle East and Africa

Performing market contribution

APAC at 42%

Key countries

US, China, India, Germany, Japan, UK, Spain, France, Vietnam, and Brazil

Competitive landscape

Leading Companies, Market Positioning of Companies, Competitive Strategies, and Industry Risks

Key companies profiled

Advanced Engineering Materials Ltd., American Elements, Ereztech LLC, ESPI Metals, Gelest Inc., Goodfellow Cambridge Ltd., Heeger Materials Inc., Noah Chemicals, ProChem Inc., Sigma Aldrich Chemicals Pvt. Ltd., Stanford Advanced Materials, Thomas Scientific LLC, Vital Materials Co. Ltd., and XIAN FUNCTION MATERIAL GROUP CO LTD

Market dynamics

Parent market analysis, market growth inducers and obstacles, fast-growing and slow-growing segment analysis, AI impact on market trends, COVID -19 impact and recovery analysis and future consumer dynamics, market research and growth, market condition analysis for the market forecast period

Customization purview

If our market report has not included the data that you are looking for, you can reach out to our analysts and get segments customized.

Download PDF Sample

What are the Key Data Covered in this Market Research Report?

  • CAGR of the market during the forecast period
  • Detailed information on factors that will drive the market growth and forecasting between 2024 and 2028
  • Precise estimation of the size of the market  and its contribution of the market in focus to the parent market
  • Accurate predictions about upcoming market growth and trends and changes in consumer behaviour
  • Growth of the market across APAC, North America, Europe, South America, and Middle East and Africa
  • Thorough analysis of the market's competitive landscape and detailed information about companies
  • Comprehensive analysis of factors that will challenge the growth of market companies

1 Executive Summary

  • 1.1 Market overview
    • Executive Summary - Chart on Market Overview
    • Executive Summary - Data Table on Market Overview
    • Executive Summary - Chart on Global Market Characteristics
    • Executive Summary - Chart on Market by Geography
    • Executive Summary - Chart on Market Segmentation by End-user
    • Executive Summary - Chart on Market Segmentation by Type
    • Executive Summary - Chart on Incremental Growth
    • Executive Summary - Data Table on Incremental Growth
    • Executive Summary - Chart on Company Market Positioning

2 Technavio Analysis

  • 2.1 Analysis of price sensitivity, lifecycle, customer purchase basket, adoption rates, and purchase criteria
    • Analysis of price sensitivity, lifecycle, customer purchase basket, adoption rates, and purchase criteria
  • 2.2 Criticality of inputs and Factors of differentiation
    • Overview on criticality of inputs and factors of differentiation
  • 2.3 Factors of disruption
    • Overview on factors of disruption
  • 2.4 Impact of drivers and challenges
    • Impact of drivers and challenges in 2023 and 2028

3 Market Landscape

  • 3.1 Market ecosystem
    • Parent Market
    • Data Table on - Parent Market
  • 3.2 Market characteristics
    • Market characteristics analysis
  • 3.3 Value chain analysis
    • Value Chain Analysis

4 Market Sizing

  • 4.1 Market definition
    • Offerings of companies included in the market definition
  • 4.2 Market segment analysis
    • Market segments
  • 4.3 Market size 2023
    • 4.4 Market outlook: Forecast for 2023-2028
      • Chart on Global - Market size and forecast 2023-2028 ($ million)
      • Data Table on Global - Market size and forecast 2023-2028 ($ million)
      • Chart on Global Market: Year-over-year growth 2023-2028 (%)
      • Data Table on Global Market: Year-over-year growth 2023-2028 (%)

    5 Historic Market Size

    • 5.1 Global Arsenic Triselenide Market 2018 - 2022
      • Historic Market Size - Data Table on Global Arsenic Triselenide Market 2018 - 2022 ($ million)
    • 5.2 End-user segment analysis 2018 - 2022
      • Historic Market Size - End-user Segment 2018 - 2022 ($ million)
    • 5.3 Type segment analysis 2018 - 2022
      • Historic Market Size - Type Segment 2018 - 2022 ($ million)
    • 5.4 Geography segment analysis 2018 - 2022
      • Historic Market Size - Geography Segment 2018 - 2022 ($ million)
    • 5.5 Country segment analysis 2018 - 2022
      • Historic Market Size - Country Segment 2018 - 2022 ($ million)

    6 Qualitative Analysis

    • 6.1 Impact of AI on the Global Arsenic Triselenide Market

      7 Five Forces Analysis

      • 7.1 Five forces summary
        • Five forces analysis - Comparison between 2023 and 2028
      • 7.2 Bargaining power of buyers
        • Bargaining power of buyers - Impact of key factors 2023 and 2028
      • 7.3 Bargaining power of suppliers
        • Bargaining power of suppliers - Impact of key factors in 2023 and 2028
      • 7.4 Threat of new entrants
        • Threat of new entrants - Impact of key factors in 2023 and 2028
      • 7.5 Threat of substitutes
        • Threat of substitutes - Impact of key factors in 2023 and 2028
      • 7.6 Threat of rivalry
        • Threat of rivalry - Impact of key factors in 2023 and 2028
      • 7.7 Market condition
        • Chart on Market condition - Five forces 2023 and 2028

      8 Market Segmentation by End-user

      • 8.1 Market segments
        • Chart on End-user - Market share 2023-2028 (%)
        • Data Table on End-user - Market share 2023-2028 (%)
      • 8.2 Comparison by End-user
        • Chart on Comparison by End-user
        • Data Table on Comparison by End-user
      • 8.3 Electronics and semiconductors - Market size and forecast 2023-2028
        • Chart on Electronics and semiconductors - Market size and forecast 2023-2028 ($ million)
        • Data Table on Electronics and semiconductors - Market size and forecast 2023-2028 ($ million)
        • Chart on Electronics and semiconductors - Year-over-year growth 2023-2028 (%)
        • Data Table on Electronics and semiconductors - Year-over-year growth 2023-2028 (%)
      • 8.4 Telecommunication - Market size and forecast 2023-2028
        • Chart on Telecommunication - Market size and forecast 2023-2028 ($ million)
        • Data Table on Telecommunication - Market size and forecast 2023-2028 ($ million)
        • Chart on Telecommunication - Year-over-year growth 2023-2028 (%)
        • Data Table on Telecommunication - Year-over-year growth 2023-2028 (%)
      • 8.5 Others - Market size and forecast 2023-2028
        • Chart on Others - Market size and forecast 2023-2028 ($ million)
        • Data Table on Others - Market size and forecast 2023-2028 ($ million)
        • Chart on Others - Year-over-year growth 2023-2028 (%)
        • Data Table on Others - Year-over-year growth 2023-2028 (%)
      • 8.6 Market opportunity by End-user
        • Market opportunity by End-user ($ million)
        • Data Table on Market opportunity by End-user ($ million)

      9 Market Segmentation by Type

      • 9.1 Market segments
        • Chart on Type - Market share 2023-2028 (%)
        • Data Table on Type - Market share 2023-2028 (%)
      • 9.2 Comparison by Type
        • Chart on Comparison by Type
        • Data Table on Comparison by Type
      • 9.3 Powder - Market size and forecast 2023-2028
        • Chart on Powder - Market size and forecast 2023-2028 ($ million)
        • Data Table on Powder - Market size and forecast 2023-2028 ($ million)
        • Chart on Powder - Year-over-year growth 2023-2028 (%)
        • Data Table on Powder - Year-over-year growth 2023-2028 (%)
      • 9.4 Crystals - Market size and forecast 2023-2028
        • Chart on Crystals - Market size and forecast 2023-2028 ($ million)
        • Data Table on Crystals - Market size and forecast 2023-2028 ($ million)
        • Chart on Crystals - Year-over-year growth 2023-2028 (%)
        • Data Table on Crystals - Year-over-year growth 2023-2028 (%)
      • 9.5 Thin films - Market size and forecast 2023-2028
        • Chart on Thin films - Market size and forecast 2023-2028 ($ million)
        • Data Table on Thin films - Market size and forecast 2023-2028 ($ million)
        • Chart on Thin films - Year-over-year growth 2023-2028 (%)
        • Data Table on Thin films - Year-over-year growth 2023-2028 (%)
      • 9.6 Market opportunity by Type
        • Market opportunity by Type ($ million)
        • Data Table on Market opportunity by Type ($ million)

      10 Customer Landscape

      • 10.1 Customer landscape overview
        • Analysis of price sensitivity, lifecycle, customer purchase basket, adoption rates, and purchase criteria

      11 Geographic Landscape

      • 11.1 Geographic segmentation
        • Chart on Market share by geography 2023-2028 (%)
        • Data Table on Market share by geography 2023-2028 (%)
      • 11.2 Geographic comparison
        • Chart on Geographic comparison
        • Data Table on Geographic comparison
      • 11.3 APAC - Market size and forecast 2023-2028
        • Chart on APAC - Market size and forecast 2023-2028 ($ million)
        • Data Table on APAC - Market size and forecast 2023-2028 ($ million)
        • Chart on APAC - Year-over-year growth 2023-2028 (%)
        • Data Table on APAC - Year-over-year growth 2023-2028 (%)
      • 11.4 North America - Market size and forecast 2023-2028
        • Chart on North America - Market size and forecast 2023-2028 ($ million)
        • Data Table on North America - Market size and forecast 2023-2028 ($ million)
        • Chart on North America - Year-over-year growth 2023-2028 (%)
        • Data Table on North America - Year-over-year growth 2023-2028 (%)
      • 11.5 Europe - Market size and forecast 2023-2028
        • Chart on Europe - Market size and forecast 2023-2028 ($ million)
        • Data Table on Europe - Market size and forecast 2023-2028 ($ million)
        • Chart on Europe - Year-over-year growth 2023-2028 (%)
        • Data Table on Europe - Year-over-year growth 2023-2028 (%)
      • 11.6 South America - Market size and forecast 2023-2028
        • Chart on South America - Market size and forecast 2023-2028 ($ million)
        • Data Table on South America - Market size and forecast 2023-2028 ($ million)
        • Chart on South America - Year-over-year growth 2023-2028 (%)
        • Data Table on South America - Year-over-year growth 2023-2028 (%)
      • 11.7 Middle East and Africa - Market size and forecast 2023-2028
        • Chart on Middle East and Africa - Market size and forecast 2023-2028 ($ million)
        • Data Table on Middle East and Africa - Market size and forecast 2023-2028 ($ million)
        • Chart on Middle East and Africa - Year-over-year growth 2023-2028 (%)
        • Data Table on Middle East and Africa - Year-over-year growth 2023-2028 (%)
      • 11.8 US - Market size and forecast 2023-2028
        • Chart on US - Market size and forecast 2023-2028 ($ million)
        • Data Table on US - Market size and forecast 2023-2028 ($ million)
        • Chart on US - Year-over-year growth 2023-2028 (%)
        • Data Table on US - Year-over-year growth 2023-2028 (%)
      • 11.9 China - Market size and forecast 2023-2028
        • Chart on China - Market size and forecast 2023-2028 ($ million)
        • Data Table on China - Market size and forecast 2023-2028 ($ million)
        • Chart on China - Year-over-year growth 2023-2028 (%)
        • Data Table on China - Year-over-year growth 2023-2028 (%)
      • 11.10 India - Market size and forecast 2023-2028
        • Chart on India - Market size and forecast 2023-2028 ($ million)
        • Data Table on India - Market size and forecast 2023-2028 ($ million)
        • Chart on India - Year-over-year growth 2023-2028 (%)
        • Data Table on India - Year-over-year growth 2023-2028 (%)
      • 11.11 Germany - Market size and forecast 2023-2028
        • Chart on Germany - Market size and forecast 2023-2028 ($ million)
        • Data Table on Germany - Market size and forecast 2023-2028 ($ million)
        • Chart on Germany - Year-over-year growth 2023-2028 (%)
        • Data Table on Germany - Year-over-year growth 2023-2028 (%)
      • 11.12 Japan - Market size and forecast 2023-2028
        • Chart on Japan - Market size and forecast 2023-2028 ($ million)
        • Data Table on Japan - Market size and forecast 2023-2028 ($ million)
        • Chart on Japan - Year-over-year growth 2023-2028 (%)
        • Data Table on Japan - Year-over-year growth 2023-2028 (%)
      • 11.13 UK - Market size and forecast 2023-2028
        • Chart on UK - Market size and forecast 2023-2028 ($ million)
        • Data Table on UK - Market size and forecast 2023-2028 ($ million)
        • Chart on UK - Year-over-year growth 2023-2028 (%)
        • Data Table on UK - Year-over-year growth 2023-2028 (%)
      • 11.14 Spain - Market size and forecast 2023-2028
        • Chart on Spain - Market size and forecast 2023-2028 ($ million)
        • Data Table on Spain - Market size and forecast 2023-2028 ($ million)
        • Chart on Spain - Year-over-year growth 2023-2028 (%)
        • Data Table on Spain - Year-over-year growth 2023-2028 (%)
      • 11.15 France - Market size and forecast 2023-2028
        • Chart on France - Market size and forecast 2023-2028 ($ million)
        • Data Table on France - Market size and forecast 2023-2028 ($ million)
        • Chart on France - Year-over-year growth 2023-2028 (%)
        • Data Table on France - Year-over-year growth 2023-2028 (%)
      • 11.16 Vietnam - Market size and forecast 2023-2028
        • Chart on Vietnam - Market size and forecast 2023-2028 ($ million)
        • Data Table on Vietnam - Market size and forecast 2023-2028 ($ million)
        • Chart on Vietnam - Year-over-year growth 2023-2028 (%)
        • Data Table on Vietnam - Year-over-year growth 2023-2028 (%)
      • 11.17 Brazil - Market size and forecast 2023-2028
        • Chart on Brazil - Market size and forecast 2023-2028 ($ million)
        • Data Table on Brazil - Market size and forecast 2023-2028 ($ million)
        • Chart on Brazil - Year-over-year growth 2023-2028 (%)
        • Data Table on Brazil - Year-over-year growth 2023-2028 (%)
      • 11.18 Market opportunity by geography
        • Market opportunity by geography ($ million)
        • Data Tables on Market opportunity by geography ($ million)

      12 Drivers, Challenges, and Opportunity/Restraints

      • 12.1 Market drivers
        • 12.2 Market challenges
          • 12.3 Impact of drivers and challenges
            • Impact of drivers and challenges in 2023 and 2028
          • 12.4 Market opportunities/restraints

            13 Competitive Landscape

            • 13.1 Overview
              • 13.2 Competitive Landscape
                • Overview on criticality of inputs and factors of differentiation
              • 13.3 Landscape disruption
                • Overview on factors of disruption
              • 13.4 Industry risks
                • Impact of key risks on business

              14 Competitive Analysis

              • 14.1 Companies profiled
                • Companies covered
              • 14.2 Company ranking index
                • Company ranking index
              • 14.3 Market positioning of companies
                • Matrix on companies position and classification
              • 14.4 Advanced Engineering Materials Ltd.
                • Advanced Engineering Materials Ltd. - Overview
                • Advanced Engineering Materials Ltd. - Product / Service
                • Advanced Engineering Materials Ltd. - Key offerings
                • SWOT
              • 14.5 American Elements
                • American Elements - Overview
                • American Elements - Product / Service
                • American Elements - Key offerings
                • SWOT
              • 14.6 Ereztech LLC
                • Ereztech LLC - Overview
                • Ereztech LLC - Product / Service
                • Ereztech LLC - Key offerings
                • SWOT
              • 14.7 ESPI Metals
                • ESPI Metals - Overview
                • ESPI Metals - Product / Service
                • ESPI Metals - Key offerings
                • SWOT
              • 14.8 Gelest Inc.
                • Gelest Inc. - Overview
                • Gelest Inc. - Product / Service
                • Gelest Inc. - Key offerings
                • SWOT
              • 14.9 Goodfellow Cambridge Ltd.
                • Goodfellow Cambridge Ltd. - Overview
                • Goodfellow Cambridge Ltd. - Product / Service
                • Goodfellow Cambridge Ltd. - Key offerings
                • SWOT
              • 14.10 Heeger Materials Inc.
                • Heeger Materials Inc. - Overview
                • Heeger Materials Inc. - Product / Service
                • Heeger Materials Inc. - Key offerings
                • SWOT
              • 14.11 Noah Chemicals
                • Noah Chemicals - Overview
                • Noah Chemicals - Product / Service
                • Noah Chemicals - Key offerings
                • SWOT
              • 14.12 ProChem Inc.
                • ProChem Inc. - Overview
                • ProChem Inc. - Product / Service
                • ProChem Inc. - Key offerings
                • SWOT
              • 14.13 Sigma Aldrich Chemicals Pvt. Ltd.
                • Sigma Aldrich Chemicals Pvt. Ltd. - Overview
                • Sigma Aldrich Chemicals Pvt. Ltd. - Product / Service
                • Sigma Aldrich Chemicals Pvt. Ltd. - Key offerings
                • SWOT
              • 14.14 Stanford Advanced Materials
                • Stanford Advanced Materials - Overview
                • Stanford Advanced Materials - Product / Service
                • Stanford Advanced Materials - Key offerings
                • SWOT
              • 14.15 Thomas Scientific LLC
                • Thomas Scientific LLC - Overview
                • Thomas Scientific LLC - Product / Service
                • Thomas Scientific LLC - Key offerings
                • SWOT
              • 14.16 Vital Materials Co. Ltd.
                • Vital Materials Co. Ltd. - Overview
                • Vital Materials Co. Ltd. - Product / Service
                • Vital Materials Co. Ltd. - Key offerings
                • SWOT
              • 14.17 XIAN FUNCTION MATERIAL GROUP CO LTD
                • XIAN FUNCTION MATERIAL GROUP CO LTD - Overview
                • XIAN FUNCTION MATERIAL GROUP CO LTD - Product / Service
                • XIAN FUNCTION MATERIAL GROUP CO LTD - Key offerings
                • SWOT

              15 Appendix

              • 15.1 Scope of the report
                • 15.2 Inclusions and exclusions checklist
                  • Inclusions checklist
                  • Exclusions checklist
                • 15.3 Currency conversion rates for US$
                  • Currency conversion rates for US$
                • 15.4 Research methodology
                  • Research methodology
                • 15.5 Data procurement
                  • Information sources
                • 15.6 Data validation
                  • Data validation
                • 15.7 Validation techniques employed for market sizing
                  • Validation techniques employed for market sizing
                • 15.8 Data synthesis
                  • Data synthesis
                • 15.9 360 degree market analysis
                  • 360 degree market analysis
                • 15.10 List of abbreviations
                  • List of abbreviations

                Research Methodology

                Technavio presents a detailed picture of the market by way of study, synthesis, and summation of data from multiple sources. The analysts have presented the various facets of the market with a particular focus on identifying the key industry influencers. The data thus presented is comprehensive, reliable, and the result of extensive research, both primary and secondary.

                INFORMATION SOURCES

                Primary sources

                • Manufacturers and suppliers
                • Channel partners
                • Industry experts
                • Strategic decision makers

                Secondary sources

                • Industry journals and periodicals
                • Government data
                • Financial reports of key industry players
                • Historical data
                • Press releases

                DATA ANALYSIS

                Data Synthesis

                • Collation of data
                • Estimation of key figures
                • Analysis of derived insights

                Data Validation

                • Triangulation with data models
                • Reference against proprietary databases
                • Corroboration with industry experts

                REPORT WRITING

                Qualitative

                • Market drivers
                • Market challenges
                • Market trends
                • Five forces analysis

                Quantitative

                • Market size and forecast
                • Market segmentation
                • Geographical insights
                • Competitive landscape

                Interested in this report?

                Get your sample now to see our research methodology and insights!

                Download Now

                Frequently Asked Questions

                Arsenic Triselenide market growth will increase by $ 181.3 mn during 2024-2028 .

                The Arsenic Triselenide market is expected to grow at a CAGR of 5.7% during 2024-2028 .

                Arsenic Triselenide market is segmented by End-user( Electronics and semiconductors, Telecommunication, Others) Type( Powder, Crystals, Thin films)

                Advanced Engineering Materials Ltd., American Elements, Ereztech LLC, ESPI Metals, Gelest Inc., Goodfellow Cambridge Ltd., Heeger Materials Inc., Noah Chemicals, ProChem Inc., Sigma Aldrich Chemicals Pvt. Ltd., Stanford Advanced Materials, Thomas Scientific LLC, Vital Materials Co. Ltd., XIAN FUNCTION MATERIAL GROUP CO LTD are a few of the key vendors in the Arsenic Triselenide market.

                APAC will register the highest growth rate of 42% among the other regions. Therefore, the Arsenic Triselenide market in APAC is expected to garner significant business opportunities for the vendors during the forecast period.

                US, China, India, Germany, Japan, UK, Spain, France, Vietnam, Brazil

                • High application of arsenic triselenideThe global arsenic triselenide market is significantly driven by its diverse applications across various high-tech and industrial sectors. This compound is integral to the production of infrared-transmitting glass is the driving factor this market.
                • which is essential for a range of optical applications is the driving factor this market.
                • including advanced imaging systems and sensors. The unique properties of arsenic triselenide make it an ideal material for these applications is the driving factor this market.
                • contributing to its high demand.In the realm of pyrotechnics and pigments is the driving factor this market.
                • arsenic triselenide is valued for its ability to produce vibrant colors and stable compounds. Its role in the manufacturing of linoleum further underscores its versatility is the driving factor this market.
                • as it contributes to the durability and quality of this widely used flooring material.One of the most critical applications of arsenic triselenide is in the semiconductor industry. It is used in the production of electrical semiconductors and photoconductors is the driving factor this market.
                • which are fundamental components of modern electronic devices. Additionally is the driving factor this market.
                • arsenic triselenide serves as a reducing agent and a tanning agent is the driving factor this market.
                • highlighting its utility in chemical processes and the leather industry. Its application as an inorganic photoresist is particularly noteworthy is the driving factor this market.
                • as it enables the fabrication of intricate three dimensional (3D) nanostructures. This capability is crucial for the advancement of nanotechnology and the production of next-generation electronic and photonic devices.The broad spectrum of applications for arsenic triselenide underscores its importance in various industries. As technological advancements continue to evolve is the driving factor this market.
                • the demand for high-quality materials like arsenic triselenide is expected to rise. The ongoing expansion of its applications will likely sustain the growth and development of the industry during the forecast period. is the driving factor this market.

                The Arsenic Triselenide market vendors should focus on grabbing business opportunities from the Electronics and semiconductors segment as it accounted for the largest market share in the base year.