Arsenic Removal Technology Market Analysis APAC, North America, Europe, South America, Middle East and Africa - US, China, India, Germany, Japan, UK, Canada, France, Brazil, Vietnam - Size and Forecast 2024-2028

Arsenic Removal Technology Market Analysis APAC, North America, Europe, South America, Middle East and Africa - US, China, India, Germany, Japan, UK, Canada, France, Brazil, Vietnam - Size and Forecast 2024-2028

Published: Nov 2024 214 Pages SKU: IRTNTR80354

Market Overview at a Glance

$307.8 Mn
Market Opportunity
7.4%
CAGR
7.2
YoY growth 2023-2024(%)

What is the Size of Arsenic Removal Technology Market?

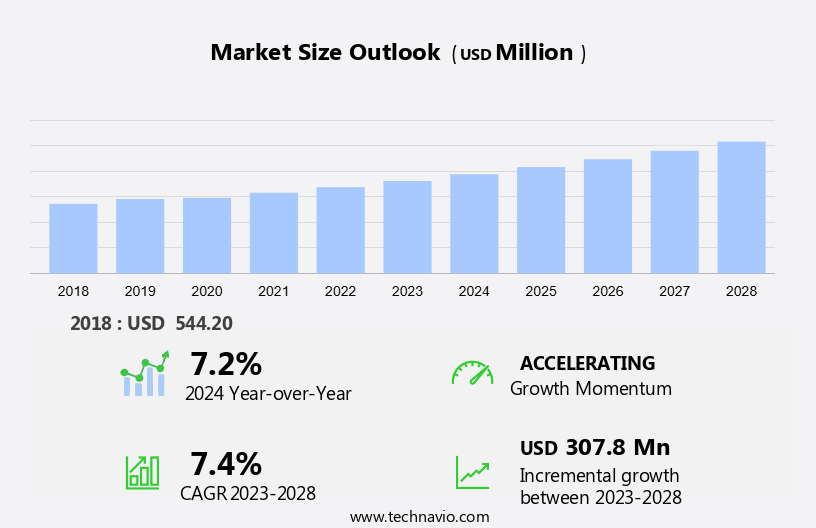
The Arsenic Removal Technology market size is estimated to grow at a CAGR of 7.4% between 2023 and 2028. The market size is forecast to increase by USD 307.8 million. The arsenic removal technology market is experiencing significant growth due to increasing regulations on arsenic levels in water, particularly in industrial water processing and municipal water treatment. Agriculture and residential consumers are also becoming more conscious of the health risks associated with arsenic, leading to a demand for sustainable solutions. However, technical limitations and high initial costs remain challenges for the market. Membrane technology is a promising solution for arsenic reduction, offering cost-effective technologies for large-scale applications. Sustainable and cost-effective solutions are crucial for the deployment of arsenic removal technologies, as high levels of arsenic in water have been linked to heart disease and other health issues. Integration of artificial intelligence and machine learning in arsenic removal technology is a key trend, enabling more efficient and effective arsenic removal processes.

Arsenic Removal Technology Market Size

Request Free Arsenic Removal Technology Market Sample

Market Segment

The market research report provides comprehensive data (region-wise segment analysis), with forecasts and estimates in "USD million" for the period 2024-2028, as well as historical data from 2018 - 2022 for the following segments.

  • Type
    • Adsorption
    • Ion exchange
    • Reverse osmosis
    • Biological treatment
    • Others
  • Application
    • Drinking water treatment
    • Industrial water treatment
    • Agricultural water treatment
    • Others
  • Geography
    • APAC
      • China
      • India
      • Japan
      • Vietnam
    • North America
      • Canada
      • US
    • Europe
      • Germany
      • UK
      • France
    • South America
      • Brazil
    • Middle East and Africa

Which is the Largest Segment Driving Market Growth?

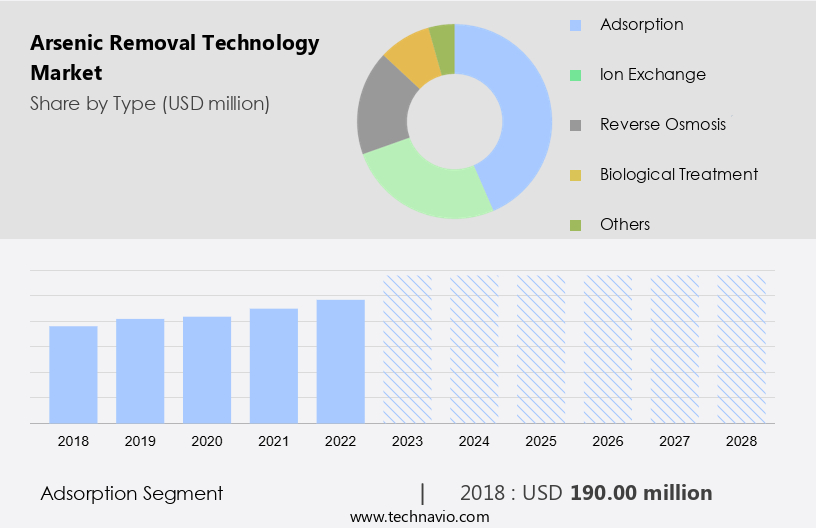
The adsorption segment is estimated to witness significant growth during the forecast period. The arsenic removal technology market in the United States is primarily driven by the private sector and municipalities to ensure the provision of clean drinking water, particularly in regions with high arsenic exposure from groundwater sources. Arsenic, a toxic element, can have severe health impacts if ingested, making the need for effective water purification solutions crucial. Environmental regulations mandate the removal of arsenic from water supplies to protect public health. Pharmaceutical companies also utilize arsenic removal technologies in their manufacturing processes to ensure compliance with environmental standards. Adsorption technology, a prominent method in arsenic removal, employs various materials to capture and eliminate arsenic from water.

Arsenic Removal Technology Market Size

Get a glance at the market share of various regions Download the PDF Sample

The adsorption segment was valued at USD 190 million in 2018. Activated carbon, iron-based composites, and natural adsorbents are among the materials explored for their arsenic adsorption capabilities. Iron-impregnated materials, such as goethite and magnetite, have shown exceptional efficiency due to their large surface area and strong affinity for arsenic species. Grants from organizations like the US Environmental Protection Agency (EPA) and the Department of Agriculture (USDA) can help fund arsenic removal projects in low-income regions, ensuring access to clean drinking water for underserved communities. The market for arsenic removal technologies is expected to grow as the demand for clean water continues to increase, with ongoing research and development efforts contributing to advancements in arsenic removal technology.

Which Region is Leading the Market?

Arsenic Removal Technology Market Share by Geography

For more insights on the market share of various regions Request Free Sample

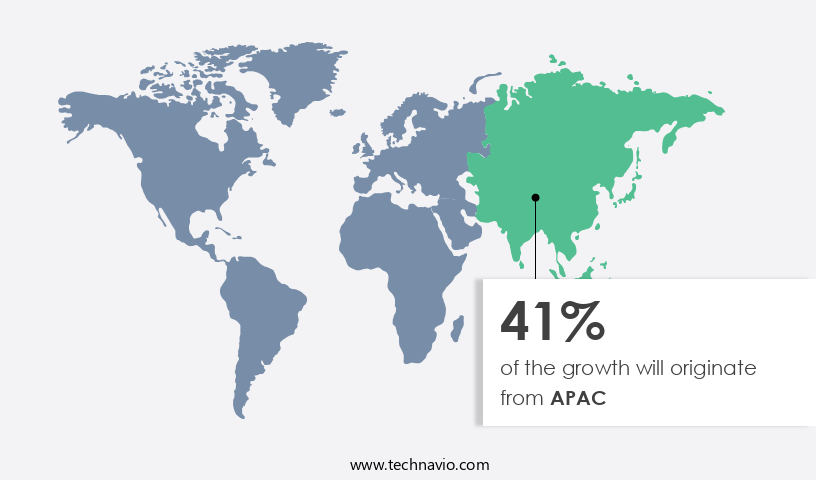
APAC is estimated to contribute 41% to the growth of the global market during the forecast period. Technavio's analysts have elaborately explained the regional trends and drivers that shape the market during the forecast period.

The Asia Pacific (APAC) region's arsenic removal technology market is gaining momentum due to escalating health concerns and substantial investments in water management infrastructure. Arsenic, a metalloid, poses significant health risks, particularly in the form of skin cancer. In 2023, India reported approximately 104,930 cases, and Japan projected around 27,000 new cases. These alarming statistics underscore the importance of ensuring safe drinking water, free from arsenic contamination. Furthermore, cardiovascular diseases (CVD) are a major concern in the region, with 32,457 fatalities from heart attacks in India in 2022. Co-precipitation, adsorption, and reverse osmosis are professional methods used in water treatment to eliminate arsenic impurities. Electricity-driven technologies like reverse osmosis are increasingly popular due to their efficiency and scalability. In the non-residential sector, these technologies are essential for providing safe drinking water to employees and tenants. Ensuring the removal of arsenic from drinking water is a critical step towards maintaining public health and reducing the burden on healthcare systems.

How do Technavio's company ranking index and market positioning come to your aid?

Companies are implementing various strategies, such as strategic alliances, partnerships, mergers and acquisitions, geographical expansion, and product/service launches, to enhance their presence in the market.

Aqua Clear Water Treatment Specialists - The company offers arsenic removal technologies and designs and builds Filtration Solutions for commercial and industrial water treatment.

Technavio provides the ranking index for the top 20 companies along with insights on the market positioning of: 

  • Apex Technology
  • Aqua Clear Water Treatment Specialists
  • Aqua Pure Solutions
  • Bharti Waters Pvt. Ltd.
  • Chart Industries Inc.
  • Culligan International Co.
  • Evoqua Water Technologies LLC
  • Fluence Corp. Ltd.
  • Graver Technologies LLC
  • H2O Innovation Inc
  • Hungerford and Terry Inc.
  • Kinetico Inc.
  • Lenntech BV
  • Pentair Plc
  • Pureflow
  • Quantum Filtration Medium Pty Ltd
  • Riley Equipment Company Inc
  • Sre Senthil Engineering Co
  • Veolia Environnement SA

Explore our company rankings and market positioning Request Free Sample

How can Technavio Assist you in Making Critical Decisions?

Arsenic Removal Technology Market Size

What is the Market Structure and Year-over-Year growth of the Arsenic Removal Technology Market?

Market structure

Fragmented

YoY growth 2023-2024

7.2

Market Dynamic

The arsenic removal technology market is witnessing significant growth due to increasing concerns over water quality and health risks associated with arsenic contamination. Arsenic is a naturally occurring element that can enter water sources through various means, posing a threat to human health when consumed. Arsenic contamination in water can occur in both groundwater and surface water sources. It is essential to remove arsenic from water before consumption to ensure drinking water quality. Arsenic removal systems have gained popularity as safe water solutions for both residential and commercial applications. Water quality testing is a crucial aspect of ensuring the safety of water supplies. Automatic devices for arsenic removal have gained traction due to their ease of use and effectiveness. These systems use advanced technologies such as membrane filtration and adsorption to remove arsenic from water.

Moreover, affordable water filtration solutions are in high demand, especially in regions where access to clean water is a challenge. DIY water filtration systems and compact devices have gained popularity due to their affordability and ease of installation. Home water filtration systems are increasingly being adopted to provide clean and safe drinking water. Arsenic removal systems offer numerous benefits, including improved drinking water quality, protection against health risks, and compliance with regulatory requirements. These systems are available in various forms, including water filter cartridges and advanced water treatment solutions. Water treatment chemicals are an essential component of arsenic removal systems.

Also, they work by binding with arsenic ions and removing them from the water. Water treatment cost is a critical factor in the adoption of these systems, and ongoing research is focused on developing cost-effective and efficient solutions. Water scarcity solutions and water resource management initiatives are driving the demand for arsenic removal technology. Municipal water treatment plants are investing in advanced water treatment technologies to ensure the safety and quality of their water supplies. Water pollution control and water treatment services are also key areas of focus. In conclusion, the arsenic removal technology market is expected to continue growing due to increasing awareness of water quality and health risks associated with arsenic contamination. Advanced technologies, affordability, and regulatory compliance are key drivers of market growth. Ongoing research and development efforts are focused on improving the efficiency and cost-effectiveness of arsenic removal systems.

Our researchers analyzed the data with 2023 as the base year, along with the key drivers, trends, and challenges. A holistic analysis of drivers will help companies refine their marketing strategies to gain a competitive advantage.

What are the Primary Factors Driving the Market Growth?

The rise in disposable income is notably driving market growth. The global market for arsenic removal technology is experiencing growth due to the increasing prioritization of safe water in various regions. As disposable income rises, there is a greater demand for advanced filtration systems that can effectively remove arsenic and other contaminants from water. In the United States, for instance, the Centers for Disease Control and Prevention (CDC) reports that over 14 million Americans are exposed to arsenic in their drinking water, which can lead to health issues such as diabetes, circulatory disorders, and cancer. In response, there is a growing market for arsenic removal technologies, particularly those utilizing metal salts and lime-based processes.

These solutions provide households and businesses with healthier water options, addressing concerns over the long-term health risks associated with arsenic exposure. With urbanization and population growth, the need for reliable and automatic arsenic removal systems is becoming increasingly pressing. By investing in these technologies, individuals and communities can ensure the safety and quality of their water supplies, enhancing overall health and well-being. Thus, such factors are driving the growth of the market during the forecast period.


What are the Significant Trends being Witnessed in the Market?

Integration of AI and ML in arsenic removal technology is the key trend in the market. The arsenic removal technology market is undergoing a notable evolution with the integration of artificial intelligence (AI) and machine learning (ML) technologies. These advanced solutions are utilized to forecast and optimize the efficiency of arsenic removal processes, signifying a crucial advancement in the industry. Recent innovations in AI and ML applications, such as Light Gradient Boosting Machine (LightGBM) and Extreme Gradient Boosting, have substantially improved the predictive capabilities for arsenate adsorption in wastewater using metal-organic frameworks (MOFs). These models fine-tune experimental parameters, thereby enhancing the performance of arsenic removal systems.

In addition, interpretable machine learning models, which incorporate decision tree-based algorithms and molecular fingerprints like Morgan and MACCS, represent a pioneering approach in the market. These models offer a unique advantage by providing interpretability, enabling a better understanding of the underlying mechanisms of arsenic removal processes. The deployment of sustainable and cost-effective technologies is essential to address the stringent regulations governing arsenic levels in industrial water processing, agriculture, and municipal water treatment. Additionally, these technologies are crucial for catering to the needs of residential consumers while overcoming the technical limitations associated with arsenic removal. Thus, such trends will shape the growth of the market during the forecast period.


What are the Major Market Challenges?

The high initial cost associated with arsenic removal technology is the major challenge that affects the growth of the market. The arsenic removal technology market in the US is driven by the demand for safe drinking water, particularly in residential applications. Arsenic, a micro-particle that can pose serious health risks when consumed, necessitates the use of advanced filtration systems. Coagulation processes are commonly used to remove arsenic from water, but these methods can be costly and require regular maintenance. Disposable income plays a significant role in the adoption of arsenic removal technologies. While the initial investment can be high, the long-term benefits to human health justify the expense.

Arsenic level testing is crucial to ensure the effectiveness of these systems. Compact and biodegradable technologies are gaining popularity due to their lower environmental impact and reduced operational costs. The selection of advanced arsenic removal technologies can significantly impact the overall cost. Membrane filtration, reverse osmosis, and advanced oxidation processes are effective but require substantial capital investment due to the complexity and sophistication of the equipment involved. Small-scale residential systems can range from USD 100 to USD 1,000, while larger commercial or industrial systems can cost between USD 10,000 and USD 50,000 or more. Maintaining these systems is also essential to ensure their longevity and effectiveness. Regular maintenance can help prevent costly repairs and ensure the continued provision of safe drinking water. By investing in arsenic removal technologies, US households and businesses can protect their health and the environment while ensuring a consistent supply of clean water. Hence, the above factors will impede the growth of the market during the forecast period.


Exclusive Customer Landscape

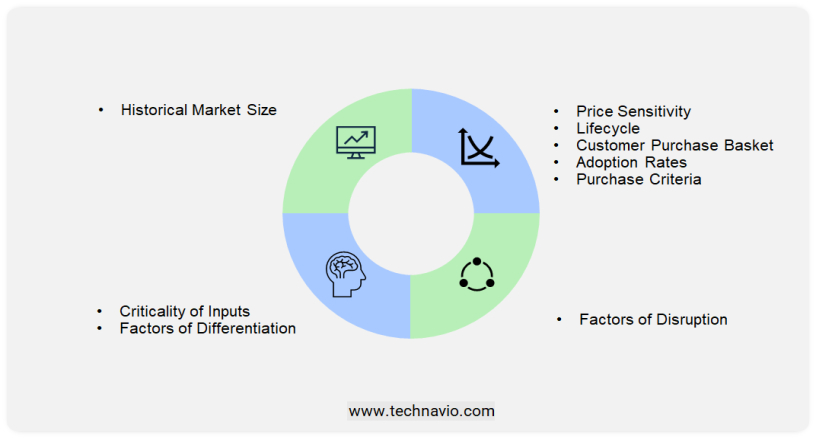
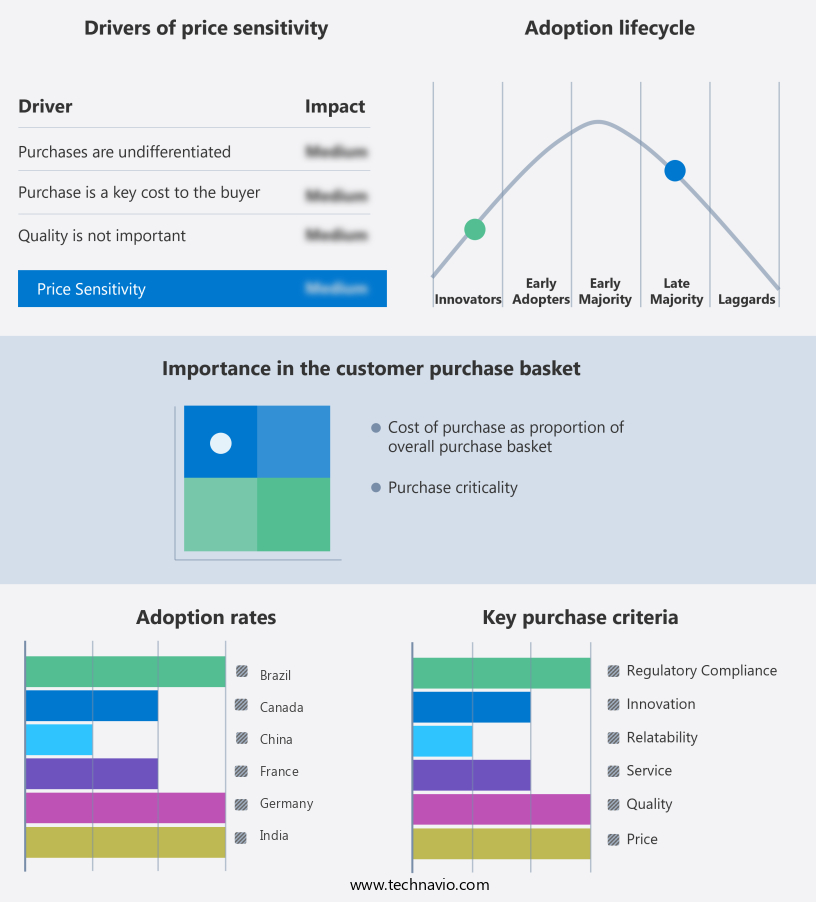
The market forecasting report includes the adoption lifecycle of the market, covering from the innovator's stage to the laggard's stage. It focuses on adoption rates in different regions based on penetration. Furthermore, the report also includes key purchase criteria and drivers of price sensitivity to help companies evaluate and develop their market growth analysis strategies.

Arsenic Removal Technology Market Share by Geography

 Customer Landscape

Market Analyst Overview

Arsenic is a metalloid that can pose serious health risks when present in water. Impurities in water sources, including arsenic, have become a significant environmental issue due to urbanization and industrialization. The arsenic removal technology market has gained momentum as a result of growing concerns for safe drinking water. Reverse osmosis and coagulation are professional methods used for arsenic removal. Adsorption using metal salts and activated alumina is another effective technology. Water treatment solutions, such as filtration and ion-exchange processes, play a crucial role in reducing arsenic levels in water. Membrane technology and electrodialysis are cost-effective technologies for arsenic reduction.

In conclusion, arsenic exposure can lead to various health issues, including diabetes, circulatory disorders, heart disease, and cancer. Regulations for arsenic levels in drinking water are stringent, and municipal water treatment plants deploy sustainable solutions to ensure safe drinking water for residential and non-residential consumers. Agriculture and industrial water processing also require arsenic removal technology to maintain safety standards and prevent detrimental effects on crops and industrial processes. Environmental regulations and eco-friendly technologies are essential for arsenic removal. Hybrid systems, such as nanotechnology and co-precipitation, offer promising solutions for arsenic pollution in groundwater and industrial water. Arsenic exposure can have toxic impact on human health, making it essential to invest in cost-effective and sustainable arsenic removal technologies.

Market Scope

Report Coverage

Details

Page number

214

Base year

2023

Historic period

2018 - 2022

Forecast period

2024-2028

Growth momentum & CAGR

Accelerate at a CAGR of 7.4%

Market growth 2024-2028

USD 307.8 million

Regional analysis

APAC, North America, Europe, South America, and Middle East and Africa

Performing market contribution

APAC at 41%

Key countries

US, China, India, Germany, Japan, UK, Canada, France, Brazil, and Vietnam

Competitive landscape

Leading Companies, Market Positioning of Companies, Competitive Strategies, and Industry Risks

Key companies profiled

Apex Technology, Aqua Clear Water Treatment Specialists, Aqua Pure Solutions, Bharti Waters Pvt. Ltd., Chart Industries Inc., Culligan International Co., Evoqua Water Technologies LLC, Fluence Corp. Ltd., Graver Technologies LLC, H2O Innovation Inc, Hungerford and Terry Inc., Kinetico Inc., Lenntech BV, Pentair Plc, Pureflow, Quantum Filtration Medium Pty Ltd, Riley Equipment Company Inc, Sre Senthil Engineering Co, and Veolia Environnement SA

Market dynamics

Parent market analysis, market growth inducers and obstacles, fast-growing and slow-growing segment analysis, AI impact on market trends, COVID -19 impact and recovery analysis and future consumer dynamics, market research and growth, market forecast, market condition analysis for the forecast period

Customization purview

If our market report has not included the data that you are looking for, you can reach out to our analysts and get segments customized.

Download PDF Sample

What are the Key Data Covered in this Market Research Report?

  • CAGR of the market during the forecast period
  • Detailed information on factors that will drive the market growth and forecasting between 2024 and 2028
  • Precise estimation of the size of the market  and its contribution of the market in focus to the parent market
  • Accurate predictions about upcoming market growth and trends and changes in consumer behaviour
  • Growth of the market across APAC, North America, Europe, South America, and Middle East and Africa
  • Thorough analysis of the market's competitive landscape and detailed information about companies
  • Comprehensive analysis of factors that will challenge the growth of market companies

1 Executive Summary

  • 1.1 Market overview
    • Executive Summary - Chart on Market Overview
    • Executive Summary - Data Table on Market Overview
    • Executive Summary - Chart on Global Market Characteristics
    • Executive Summary - Chart on Market by Geography
    • Executive Summary - Chart on Market Segmentation by Type
    • Executive Summary - Chart on Market Segmentation by Application
    • Executive Summary - Chart on Incremental Growth
    • Executive Summary - Data Table on Incremental Growth
    • Executive Summary - Chart on Company Market Positioning

2 Technavio Analysis

  • 2.1 Analysis of price sensitivity, lifecycle, customer purchase basket, adoption rates, and purchase criteria
    • Analysis of price sensitivity, lifecycle, customer purchase basket, adoption rates, and purchase criteria
  • 2.2 Criticality of inputs and Factors of differentiation
    • Overview on criticality of inputs and factors of differentiation
  • 2.3 Factors of disruption
    • Overview on factors of disruption
  • 2.4 Impact of drivers and challenges
    • Impact of drivers and challenges in 2023 and 2028

3 Market Landscape

  • 3.1 Market ecosystem
    • Parent Market
    • Data Table on - Parent Market
  • 3.2 Market characteristics
    • Market characteristics analysis
  • 3.3 Value chain analysis
    • Value Chain Analysis

4 Market Sizing

  • 4.1 Market definition
    • Offerings of companies included in the market definition
  • 4.2 Market segment analysis
    • Market segments
  • 4.3 Market size 2023
    • 4.4 Market outlook: Forecast for 2023-2028
      • Chart on Global - Market size and forecast 2023-2028 ($ million)
      • Data Table on Global - Market size and forecast 2023-2028 ($ million)
      • Chart on Global Market: Year-over-year growth 2023-2028 (%)
      • Data Table on Global Market: Year-over-year growth 2023-2028 (%)

    5 Historic Market Size

    • 5.1 Global Arsenic Removal Technology Market 2018 - 2022
      • Historic Market Size - Data Table on Global Arsenic Removal Technology Market 2018 - 2022 ($ million)
    • 5.2 Type segment analysis 2018 - 2022
      • Historic Market Size - Type Segment 2018 - 2022 ($ million)
    • 5.3 Application segment analysis 2018 - 2022
      • Historic Market Size - Application Segment 2018 - 2022 ($ million)
    • 5.4 Geography segment analysis 2018 - 2022
      • Historic Market Size - Geography Segment 2018 - 2022 ($ million)
    • 5.5 Country segment analysis 2018 - 2022
      • Historic Market Size - Country Segment 2018 - 2022 ($ million)

    6 Qualitative Analysis

    • 6.1 Impact of AI on the Global Arsenic Removal Technology Market

      7 Five Forces Analysis

      • 7.1 Five forces summary
        • Five forces analysis - Comparison between 2023 and 2028
      • 7.2 Bargaining power of buyers
        • Bargaining power of buyers - Impact of key factors 2023 and 2028
      • 7.3 Bargaining power of suppliers
        • Bargaining power of suppliers - Impact of key factors in 2023 and 2028
      • 7.4 Threat of new entrants
        • Threat of new entrants - Impact of key factors in 2023 and 2028
      • 7.5 Threat of substitutes
        • Threat of substitutes - Impact of key factors in 2023 and 2028
      • 7.6 Threat of rivalry
        • Threat of rivalry - Impact of key factors in 2023 and 2028
      • 7.7 Market condition
        • Chart on Market condition - Five forces 2023 and 2028

      8 Market Segmentation by Type

      • 8.1 Market segments
        • Chart on Type - Market share 2023-2028 (%)
        • Data Table on Type - Market share 2023-2028 (%)
      • 8.2 Comparison by Type
        • Chart on Comparison by Type
        • Data Table on Comparison by Type
      • 8.3 Adsorption - Market size and forecast 2023-2028
        • Chart on Adsorption - Market size and forecast 2023-2028 ($ million)
        • Data Table on Adsorption - Market size and forecast 2023-2028 ($ million)
        • Chart on Adsorption - Year-over-year growth 2023-2028 (%)
        • Data Table on Adsorption - Year-over-year growth 2023-2028 (%)
      • 8.4 Ion exchange - Market size and forecast 2023-2028
        • Chart on Ion exchange - Market size and forecast 2023-2028 ($ million)
        • Data Table on Ion exchange - Market size and forecast 2023-2028 ($ million)
        • Chart on Ion exchange - Year-over-year growth 2023-2028 (%)
        • Data Table on Ion exchange - Year-over-year growth 2023-2028 (%)
      • 8.5 Reverse osmosis - Market size and forecast 2023-2028
        • Chart on Reverse osmosis - Market size and forecast 2023-2028 ($ million)
        • Data Table on Reverse osmosis - Market size and forecast 2023-2028 ($ million)
        • Chart on Reverse osmosis - Year-over-year growth 2023-2028 (%)
        • Data Table on Reverse osmosis - Year-over-year growth 2023-2028 (%)
      • 8.6 Biological treatment - Market size and forecast 2023-2028
        • Chart on Biological treatment - Market size and forecast 2023-2028 ($ million)
        • Data Table on Biological treatment - Market size and forecast 2023-2028 ($ million)
        • Chart on Biological treatment - Year-over-year growth 2023-2028 (%)
        • Data Table on Biological treatment - Year-over-year growth 2023-2028 (%)
      • 8.7 Others - Market size and forecast 2023-2028
        • Chart on Others - Market size and forecast 2023-2028 ($ million)
        • Data Table on Others - Market size and forecast 2023-2028 ($ million)
        • Chart on Others - Year-over-year growth 2023-2028 (%)
        • Data Table on Others - Year-over-year growth 2023-2028 (%)
      • 8.8 Market opportunity by Type
        • Market opportunity by Type ($ million)
        • Data Table on Market opportunity by Type ($ million)

      9 Market Segmentation by Application

      • 9.1 Market segments
        • Chart on Application - Market share 2023-2028 (%)
        • Data Table on Application - Market share 2023-2028 (%)
      • 9.2 Comparison by Application
        • Chart on Comparison by Application
        • Data Table on Comparison by Application
      • 9.3 Drinking water treatment - Market size and forecast 2023-2028
        • Chart on Drinking water treatment - Market size and forecast 2023-2028 ($ million)
        • Data Table on Drinking water treatment - Market size and forecast 2023-2028 ($ million)
        • Chart on Drinking water treatment - Year-over-year growth 2023-2028 (%)
        • Data Table on Drinking water treatment - Year-over-year growth 2023-2028 (%)
      • 9.4 Industrial water treatment - Market size and forecast 2023-2028
        • Chart on Industrial water treatment - Market size and forecast 2023-2028 ($ million)
        • Data Table on Industrial water treatment - Market size and forecast 2023-2028 ($ million)
        • Chart on Industrial water treatment - Year-over-year growth 2023-2028 (%)
        • Data Table on Industrial water treatment - Year-over-year growth 2023-2028 (%)
      • 9.5 Agricultural water treatment - Market size and forecast 2023-2028
        • Chart on Agricultural water treatment - Market size and forecast 2023-2028 ($ million)
        • Data Table on Agricultural water treatment - Market size and forecast 2023-2028 ($ million)
        • Chart on Agricultural water treatment - Year-over-year growth 2023-2028 (%)
        • Data Table on Agricultural water treatment - Year-over-year growth 2023-2028 (%)
      • 9.6 Others - Market size and forecast 2023-2028
        • Chart on Others - Market size and forecast 2023-2028 ($ million)
        • Data Table on Others - Market size and forecast 2023-2028 ($ million)
        • Chart on Others - Year-over-year growth 2023-2028 (%)
        • Data Table on Others - Year-over-year growth 2023-2028 (%)
      • 9.7 Market opportunity by Application
        • Market opportunity by Application ($ million)
        • Data Table on Market opportunity by Application ($ million)

      10 Customer Landscape

      • 10.1 Customer landscape overview
        • Analysis of price sensitivity, lifecycle, customer purchase basket, adoption rates, and purchase criteria

      11 Geographic Landscape

      • 11.1 Geographic segmentation
        • Chart on Market share by geography 2023-2028 (%)
        • Data Table on Market share by geography 2023-2028 (%)
      • 11.2 Geographic comparison
        • Chart on Geographic comparison
        • Data Table on Geographic comparison
      • 11.3 APAC - Market size and forecast 2023-2028
        • Chart on APAC - Market size and forecast 2023-2028 ($ million)
        • Data Table on APAC - Market size and forecast 2023-2028 ($ million)
        • Chart on APAC - Year-over-year growth 2023-2028 (%)
        • Data Table on APAC - Year-over-year growth 2023-2028 (%)
      • 11.4 North America - Market size and forecast 2023-2028
        • Chart on North America - Market size and forecast 2023-2028 ($ million)
        • Data Table on North America - Market size and forecast 2023-2028 ($ million)
        • Chart on North America - Year-over-year growth 2023-2028 (%)
        • Data Table on North America - Year-over-year growth 2023-2028 (%)
      • 11.5 Europe - Market size and forecast 2023-2028
        • Chart on Europe - Market size and forecast 2023-2028 ($ million)
        • Data Table on Europe - Market size and forecast 2023-2028 ($ million)
        • Chart on Europe - Year-over-year growth 2023-2028 (%)
        • Data Table on Europe - Year-over-year growth 2023-2028 (%)
      • 11.6 South America - Market size and forecast 2023-2028
        • Chart on South America - Market size and forecast 2023-2028 ($ million)
        • Data Table on South America - Market size and forecast 2023-2028 ($ million)
        • Chart on South America - Year-over-year growth 2023-2028 (%)
        • Data Table on South America - Year-over-year growth 2023-2028 (%)
      • 11.7 Middle East and Africa - Market size and forecast 2023-2028
        • Chart on Middle East and Africa - Market size and forecast 2023-2028 ($ million)
        • Data Table on Middle East and Africa - Market size and forecast 2023-2028 ($ million)
        • Chart on Middle East and Africa - Year-over-year growth 2023-2028 (%)
        • Data Table on Middle East and Africa - Year-over-year growth 2023-2028 (%)
      • 11.8 US - Market size and forecast 2023-2028
        • Chart on US - Market size and forecast 2023-2028 ($ million)
        • Data Table on US - Market size and forecast 2023-2028 ($ million)
        • Chart on US - Year-over-year growth 2023-2028 (%)
        • Data Table on US - Year-over-year growth 2023-2028 (%)
      • 11.9 China - Market size and forecast 2023-2028
        • Chart on China - Market size and forecast 2023-2028 ($ million)
        • Data Table on China - Market size and forecast 2023-2028 ($ million)
        • Chart on China - Year-over-year growth 2023-2028 (%)
        • Data Table on China - Year-over-year growth 2023-2028 (%)
      • 11.10 India - Market size and forecast 2023-2028
        • Chart on India - Market size and forecast 2023-2028 ($ million)
        • Data Table on India - Market size and forecast 2023-2028 ($ million)
        • Chart on India - Year-over-year growth 2023-2028 (%)
        • Data Table on India - Year-over-year growth 2023-2028 (%)
      • 11.11 Germany - Market size and forecast 2023-2028
        • Chart on Germany - Market size and forecast 2023-2028 ($ million)
        • Data Table on Germany - Market size and forecast 2023-2028 ($ million)
        • Chart on Germany - Year-over-year growth 2023-2028 (%)
        • Data Table on Germany - Year-over-year growth 2023-2028 (%)
      • 11.12 Japan - Market size and forecast 2023-2028
        • Chart on Japan - Market size and forecast 2023-2028 ($ million)
        • Data Table on Japan - Market size and forecast 2023-2028 ($ million)
        • Chart on Japan - Year-over-year growth 2023-2028 (%)
        • Data Table on Japan - Year-over-year growth 2023-2028 (%)
      • 11.13 Canada - Market size and forecast 2023-2028
        • Chart on Canada - Market size and forecast 2023-2028 ($ million)
        • Data Table on Canada - Market size and forecast 2023-2028 ($ million)
        • Chart on Canada - Year-over-year growth 2023-2028 (%)
        • Data Table on Canada - Year-over-year growth 2023-2028 (%)
      • 11.14 UK - Market size and forecast 2023-2028
        • Chart on UK - Market size and forecast 2023-2028 ($ million)
        • Data Table on UK - Market size and forecast 2023-2028 ($ million)
        • Chart on UK - Year-over-year growth 2023-2028 (%)
        • Data Table on UK - Year-over-year growth 2023-2028 (%)
      • 11.15 France - Market size and forecast 2023-2028
        • Chart on France - Market size and forecast 2023-2028 ($ million)
        • Data Table on France - Market size and forecast 2023-2028 ($ million)
        • Chart on France - Year-over-year growth 2023-2028 (%)
        • Data Table on France - Year-over-year growth 2023-2028 (%)
      • 11.16 Vietnam - Market size and forecast 2023-2028
        • Chart on Vietnam - Market size and forecast 2023-2028 ($ million)
        • Data Table on Vietnam - Market size and forecast 2023-2028 ($ million)
        • Chart on Vietnam - Year-over-year growth 2023-2028 (%)
        • Data Table on Vietnam - Year-over-year growth 2023-2028 (%)
      • 11.17 Brazil - Market size and forecast 2023-2028
        • Chart on Brazil - Market size and forecast 2023-2028 ($ million)
        • Data Table on Brazil - Market size and forecast 2023-2028 ($ million)
        • Chart on Brazil - Year-over-year growth 2023-2028 (%)
        • Data Table on Brazil - Year-over-year growth 2023-2028 (%)
      • 11.18 Market opportunity by geography
        • Market opportunity by geography ($ million)
        • Data Tables on Market opportunity by geography ($ million)

      12 Drivers, Challenges, and Opportunity/Restraints

      • 12.1 Market drivers
        • 12.2 Market challenges
          • 12.3 Impact of drivers and challenges
            • Impact of drivers and challenges in 2023 and 2028
          • 12.4 Market opportunities/restraints

            13 Competitive Landscape

            • 13.1 Overview
              • 13.2 Competitive Landscape
                • Overview on criticality of inputs and factors of differentiation
              • 13.3 Landscape disruption
                • Overview on factors of disruption
              • 13.4 Industry risks
                • Impact of key risks on business

              14 Competitive Analysis

              • 14.1 Companies profiled
                • Companies covered
              • 14.2 Company ranking index
                • Company ranking index
              • 14.3 Market positioning of companies
                • Matrix on companies position and classification
              • 14.4 Aqua Clear Water Treatment Specialists
                • Aqua Clear Water Treatment Specialists - Overview
                • Aqua Clear Water Treatment Specialists - Product / Service
                • Aqua Clear Water Treatment Specialists - Key offerings
                • SWOT
              • 14.5 Aqua Pure Solutions
                • Aqua Pure Solutions - Overview
                • Aqua Pure Solutions - Product / Service
                • Aqua Pure Solutions - Key offerings
                • SWOT
              • 14.6 Chart Industries Inc.
                • Chart Industries Inc. - Overview
                • Chart Industries Inc. - Business segments
                • Chart Industries Inc. - Key news
                • Chart Industries Inc. - Key offerings
                • Chart Industries Inc. - Segment focus
                • SWOT
              • 14.7 Culligan International Co.
                • Culligan International Co. - Overview
                • Culligan International Co. - Product / Service
                • Culligan International Co. - Key offerings
                • SWOT
              • 14.8 Evoqua Water Technologies LLC
                • Evoqua Water Technologies LLC - Overview
                • Evoqua Water Technologies LLC - Business segments
                • Evoqua Water Technologies LLC - Key news
                • Evoqua Water Technologies LLC - Key offerings
                • Evoqua Water Technologies LLC - Segment focus
                • SWOT
              • 14.9 Fluence Corp. Ltd.
                • Fluence Corp. Ltd. - Overview
                • Fluence Corp. Ltd. - Product / Service
                • Fluence Corp. Ltd. - Key offerings
                • SWOT
              • 14.10 Graver Technologies LLC
                • Graver Technologies LLC - Overview
                • Graver Technologies LLC - Product / Service
                • Graver Technologies LLC - Key offerings
                • SWOT
              • 14.11 H2O Innovation Inc
                • H2O Innovation Inc - Overview
                • H2O Innovation Inc - Business segments
                • H2O Innovation Inc - Key offerings
                • H2O Innovation Inc - Segment focus
                • SWOT
              • 14.12 Hungerford and Terry Inc.
                • Hungerford and Terry Inc. - Overview
                • Hungerford and Terry Inc. - Product / Service
                • Hungerford and Terry Inc. - Key offerings
                • SWOT
              • 14.13 Kinetico Inc.
                • Kinetico Inc. - Overview
                • Kinetico Inc. - Product / Service
                • Kinetico Inc. - Key offerings
                • SWOT
              • 14.14 Lenntech BV
                • Lenntech BV - Overview
                • Lenntech BV - Product / Service
                • Lenntech BV - Key offerings
                • SWOT
              • 14.15 Pentair Plc
                • Pentair Plc - Overview
                • Pentair Plc - Business segments
                • Pentair Plc - Key news
                • Pentair Plc - Key offerings
                • Pentair Plc - Segment focus
                • SWOT
              • 14.16 Pureflow
                • Pureflow - Overview
                • Pureflow - Product / Service
                • Pureflow - Key offerings
                • SWOT
              • 14.17 Sre Senthil Engineering Co
                • Sre Senthil Engineering Co - Overview
                • Sre Senthil Engineering Co - Product / Service
                • Sre Senthil Engineering Co - Key offerings
                • SWOT
              • 14.18 Veolia Environnement SA
                • Veolia Environnement SA - Overview
                • Veolia Environnement SA - Business segments
                • Veolia Environnement SA - Key news
                • Veolia Environnement SA - Key offerings
                • Veolia Environnement SA - Segment focus
                • SWOT

              15 Appendix

              • 15.1 Scope of the report
                • 15.2 Inclusions and exclusions checklist
                  • Inclusions checklist
                  • Exclusions checklist
                • 15.3 Currency conversion rates for US$
                  • Currency conversion rates for US$
                • 15.4 Research methodology
                  • Research methodology
                • 15.5 Data procurement
                  • Information sources
                • 15.6 Data validation
                  • Data validation
                • 15.7 Validation techniques employed for market sizing
                  • Validation techniques employed for market sizing
                • 15.8 Data synthesis
                  • Data synthesis
                • 15.9 360 degree market analysis
                  • 360 degree market analysis
                • 15.10 List of abbreviations
                  • List of abbreviations

                Research Methodology

                Technavio presents a detailed picture of the market by way of study, synthesis, and summation of data from multiple sources. The analysts have presented the various facets of the market with a particular focus on identifying the key industry influencers. The data thus presented is comprehensive, reliable, and the result of extensive research, both primary and secondary.

                INFORMATION SOURCES

                Primary sources

                • Manufacturers and suppliers
                • Channel partners
                • Industry experts
                • Strategic decision makers

                Secondary sources

                • Industry journals and periodicals
                • Government data
                • Financial reports of key industry players
                • Historical data
                • Press releases

                DATA ANALYSIS

                Data Synthesis

                • Collation of data
                • Estimation of key figures
                • Analysis of derived insights

                Data Validation

                • Triangulation with data models
                • Reference against proprietary databases
                • Corroboration with industry experts

                REPORT WRITING

                Qualitative

                • Market drivers
                • Market challenges
                • Market trends
                • Five forces analysis

                Quantitative

                • Market size and forecast
                • Market segmentation
                • Geographical insights
                • Competitive landscape

                Interested in this report?

                Get your sample now to see our research methodology and insights!

                Download Now

                Frequently Asked Questions

                Arsenic Removal Technology market growth will increase by $ 307.8 mn during 2024-2028 .

                The Arsenic Removal Technology market is expected to grow at a CAGR of 7.4% during 2024-2028 .

                Arsenic Removal Technology market is segmented by Type( Adsorption, Ion exchange, Reverse osmosis, Biological treatment, Others) Application( Drinking water treatment, Industrial water treatment, Agricultural water treatment, Others)

                Apex Technology, Aqua Clear Water Treatment Specialists, Aqua Pure Solutions, Bharti Waters Pvt. Ltd., Chart Industries Inc., Culligan International Co., Evoqua Water Technologies LLC, Fluence Corp. Ltd., Graver Technologies LLC, H2O Innovation Inc, Hungerford and Terry Inc., Kinetico Inc., Lenntech BV, Pentair Plc, Pureflow, Quantum Filtration Medium Pty Ltd, Riley Equipment Company Inc, Sre Senthil Engineering Co, Veolia Environnement SA are a few of the key vendors in the Arsenic Removal Technology market.

                APAC will register the highest growth rate of 41% among the other regions. Therefore, the Arsenic Removal Technology market in APAC is expected to garner significant business opportunities for the vendors during the forecast period.

                US, China, India, Germany, Japan, UK, Canada, France, Brazil, Vietnam

                • Rise in disposable incomeThe global arsenic removal technology market is significantly influenced by the rise in disposable income across various regions is the driving factor this market.
                • which is driving demand for improved water purification solutions.Brazil: In 2023 is the driving factor this market.
                • the average real monthly income for employed individuals aged 14 and over in Brazil reached $548 is the driving factor this market.
                • marking a 7.2% increase from $511 in 2022 and a 1.8% rise from $538 in 2019. This upward trend in income levels enhances the purchasing power of households is the driving factor this market.
                • enabling them to invest in advanced water purification technologies is the driving factor this market.
                • including arsenic removal systems. As disposable income grows is the driving factor this market.
                • there is a greater emphasis on health and safety is the driving factor this market.
                • leading to increased adoption of effective water treatment solutions.China: The disposable personal income in China saw a notable increase is the driving factor this market.
                • rising to approximately $7 is the driving factor this market.
                • 390 in 2023 from $7 is the driving factor this market.
                • 028 in 2022. This significant growth reflects the overall economic development and improved living standards in the country. With higher disposable incomes is the driving factor this market.
                • Chinese consumers are more likely to prioritize clean and safe drinking water is the driving factor this market.
                • driving the demand for sophisticated arsenic removal technologies. The market is expected to benefit from this trend as more households and industries invest in advanced water treatment systems to ensure water quality.Germany: In Germany is the driving factor this market.
                • the average monthly salary in 2023 was around $4 is the driving factor this market.
                • 685 is the driving factor this market.
                • based on continuous household budget surveys. With earnings from employment constituting 63% of total income is the driving factor this market.
                • the rise in average salaries indicates increased financial capacity among German consumers. This financial stability allows for greater investment in home and industrial water purification systems is the driving factor this market.
                • including those designed to remove arsenic. The heightened awareness of water quality issues and the availability of disposable income are key factors driving the adoption of arsenic removal technologies in Germany. is the driving factor this market.

                The Arsenic Removal Technology market vendors should focus on grabbing business opportunities from the Adsorption segment as it accounted for the largest market share in the base year.