Artificial Intelligence Market In Renewable Energy Size 2025-2029
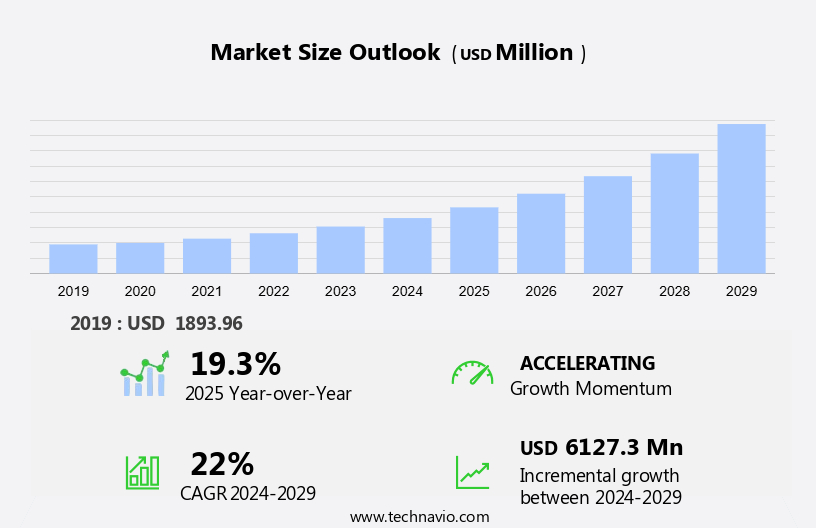
The artificial intelligence market in renewable energy size is forecast to increase by USD 6.13 billion at a CAGR of 22% between 2024 and 2029.
- The market is experiencing significant growth due to the increasing demand for sustainable and eco-friendly energy sources. Key trends in this market include the launch of innovative technologies and solutions to improve energy efficiency and reduce carbon emissions. However, high initial investment costs remain a challenge for market growth. Artificial Intelligence (AI) is playing an essential role in optimizing production and distribution. AI algorithms enable predictive maintenance of renewable energy infrastructure, improve energy storage systems, and enhance grid management. The integration of AI in renewable energy systems is expected to increase efficiency, reduce operational costs, and ensure a stable energy supply. Despite these benefits, the implementation requires substantial investment and technical expertise.
What will be the Size of the Market During the Forecast Period?
- Artificial Intelligence (AI) is revolutionizing the sector by optimizing various aspects of energy production and distribution. One significant application is in the management of wind turbines. AI algorithms analyze environmental conditions, such as wind speed and direction, to maximize energy production. Moreover, AI can predict and adapt to changing weather patterns, including rainfall and cloud cover, ensuring continuous energy generation. Flood control is another area where AI plays a crucial role. By monitoring reservoir stages and energy demand, AI systems can optimize dam operations to prevent flooding while maintaining grid stability. AI algorithms also help in predicting power consumption patterns, enabling efficient energy distribution and reducing electricity prices.
- Furthermore, renewable energy infrastructure, including wind turbines and solar panels, is vulnerable to cybersecurity threats. AI-powered solutions can detect and respond to cyberattacks in real-time, ensuring the security of renewable energy assets. Furthermore, AI algorithms can analyze climate data to predict maintenance needs, streamlining processes and reducing downtime. The integration of electric-powered automobiles into the energy grid poses new challenges. AI-based systems can manage energy transmission and distribution, balancing supply and demand and ensuring grid stability. Cloud-based systems enable real-time monitoring and analysis of energy production and consumption, providing valuable insights for market players.
How is this market segmented and which is the largest segment?
The market research report provides comprehensive data (region-wise segment analysis), with forecasts and estimates in "USD billion" for the period 2025-2029, as well as historical data from 2019-2023 for the following segments.
- Application
- Grid management
- Energy demand forecasting
- Predictive maintenance
- Energy storage and optimization
- Others
- End-user
- Generation
- Distribution
- Transmission
- Consumption
- Geography
- APAC
- China
- India
- Japan
- Europe
- Germany
- UK
- France
- Spain
- North America
- US
- South America
- Brazil
- Middle East and Africa
- APAC
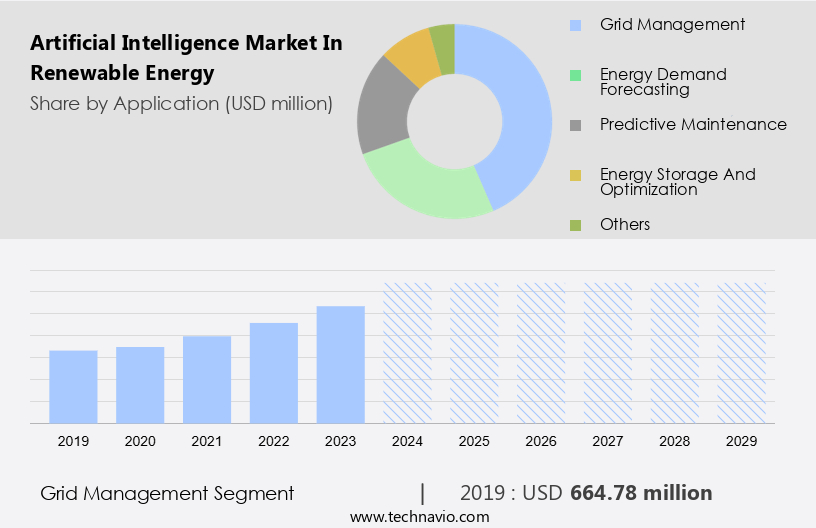
By Application Insights
- The grid management segment is estimated to witness significant growth during the forecast period.
Artificial Intelligence (AI) plays a pivotal role in the renewable energy sector, particularly in grid management. AI algorithms enhance the efficiency and reliability of smart grids by analyzing historical and real-time data to predict consumption patterns. This predictive capability enables utilities to allocate resources effectively, ensuring energy supply meets demand and preventing potential shortages. During periods of sudden high demand, AI can dynamically adjust electricity distribution, directing power to where it is needed most. AI-driven energy optimization also extends to load forecasting and energy access, improving energy investment and equity. Grid modernization and sector innovation are key areas of focus, with AI expected to significantly impact the adoption and climate change mitigation efforts.
Get a glance at the market report of share of various segments Request Free Sample
The grid management segment was valued at USD 664.78 million in 2019 and showed a gradual increase during the forecast period.
Regional Analysis
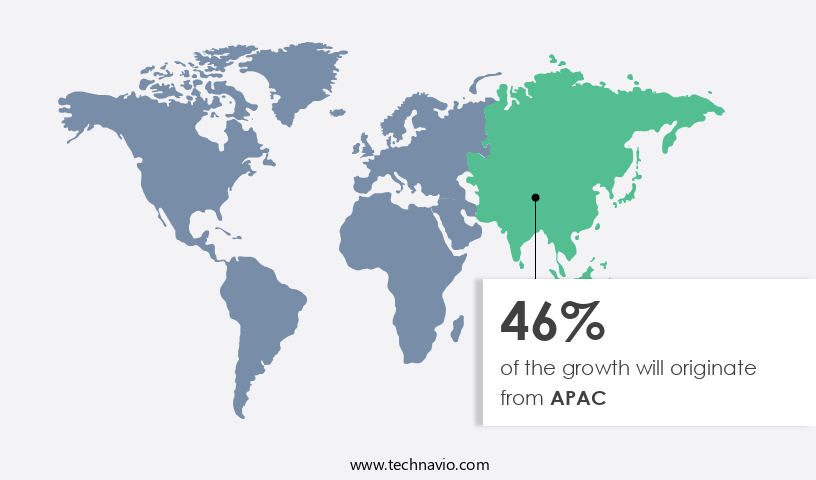
- APAC is estimated to contribute 46% to the growth of the global market during the forecast period.
Technavio's analysts have elaborately explained the regional trends and drivers that shape the market during the forecast period.
For more insights on the market share of various regions Request Free Sample
The Asia-Pacific (APAC) region is a major player in the market, fueled by the rapid adoption of renewable technologies and a heightened focus on energy efficiency. Key countries, including China, India, and Japan, are leading the charge in renewable energy deployment, significantly expanding their capacities. As of 2023, China's renewable energy capacity surpassed 1.45 billion kilowatts, representing over half of the country's total power generation capacity. The National Energy Administration anticipates that by 2028, China's capacity will reach an impressive 7,300 gigawatts (GW), contributing approximately 60% to the global increase in renewable capacity. This growth is crucial in the fight against climate change and reducing carbon emissions, as renewable energy sources, such as wind, bioenergy, and solar, offer sustainable alternatives to traditional energy sources. Additionally, advancements in energy optimization, battery storage, and electric vehicles further enhance the integration into the grid.
Market Dynamics
Our researchers analyzed the data with 2024 as the base year, along with the key drivers, trends, and challenges. A holistic analysis of drivers will help companies refine their marketing strategies to gain a competitive advantage.
What are the key market drivers leading to the rise in adoption of Artificial Intelligence Market In Renewable Energy?
Growing demand for renewable energy is the key driver of the market.
- The sector is witnessing significant growth, leading to an increased demand for artificial intelligence (AI) technologies. In 2023, renewable electricity capacity expanded by 50%, adding approximately 510 gigawatts (GW) to the global energy landscape. Solar photovoltaic (PV) installations accounted for 75% of this growth. The integration of these energy sources is a primary factor driving the market for AI in renewable energy. According to current energy policy projections, renewables are expected to account for 80% of new power generation capacity by 2030, with solar energy representing over half of this expansion. AI technologies play a crucial role in optimizing the efficiency and integration of these renewable energy systems.
- Energy innovation, such as bioenergy, wind energy, geothermal energy, and energy storage systems, is a key focus area for AI-driven energy management. Electric vehicles (EVs) and energy modeling are also significant applications of AI in the sector. Energy optimization, energy consumption, and energy efficiency are essential components of the energy transition, and AI technologies enable predictive maintenance, energy market forecasting, and grid modernization. The adoption of these energy sources is a critical step towards reducing greenhouse gas emissions, carbon footprint reduction, and addressing climate change. The integration of AI-powered energy management systems, smart energy grids, and distributed energy resources is essential for achieving sustainable development goals and ensuring energy security and energy equity.
What are the market trends shaping the Artificial Intelligence Market In Renewable Energy?
New product launches is the upcoming trend in the market.
- The renewable energy sector is experiencing innovation through artificial intelligence (AI) technology, which is revolutionizing energy management and integration. AI is being utilized to enhance the predictability, efficiency, and reliability of renewable energy systems. This cloud-native tool, launched on November 12, 2024, leverages Hitachi Energy's industry expertise to provide accurate forecasts for various energy applications. These include load management, market pricing, and renewable energy generation. By improving the predictability of energy investments, Nostradamus AI contributes to the transition towards green energy, reducing carbon emissions, and increasing energy security.
- Other applications of AI in renewable energy include energy optimization, energy modeling, and energy storage management. The adoption of AI-driven energy solutions is essential for meeting sustainable development goals, such as energy efficiency optimization, carbon footprint reduction, and renewable energy expansion. Additionally, AI is crucial for managing distributed energy resources, smart energy grids, and energy distribution systems. The integration of AI is a critical step towards grid modernization and decarbonization, creating a more sustainable energy future.
What challenges does Artificial Intelligence Market In Renewable Energy face during its growth?
High initial investment costs is a key challenge affecting the market growth.
- Artificial Intelligence (AI) plays a pivotal role in the market, driving innovation and optimization in various sectors. In the realm of energy, AI is revolutionizing bioenergy, off-grid energy, and distributed generation through energy modeling and predictive maintenance. For instance, AI is used to optimize the performance of wind energy systems by analyzing wind patterns and predicting electricity rises, ensuring energy efficiency and reducing carbon emissions. Similarly, AI is employed in energy storage systems, such as battery storage, to manage energy consumption patterns and grid stability. Moreover, AI is instrumental in the green energy transition, facilitating the integration of electric vehicles and smart grid technologies.
- It aids in energy policy analysis, enabling the implementation of decarbonization strategies and sustainable development goals. AI-powered energy management systems are also crucial for energy market forecasting, ensuring energy security and resilience. Despite the numerous benefits, high initial investment costs pose a significant challenge in the adoption of AI technologies in the sector. The deployment of AI-driven energy optimization systems, such as predictive maintenance for wind turbines and smart grid systems, requires substantial capital for infrastructure, software, data acquisition, and system upgrades. However, the long-term savings and environmental benefits make it a worthwhile investment for the future of clean energy.
Exclusive Customer Landscape
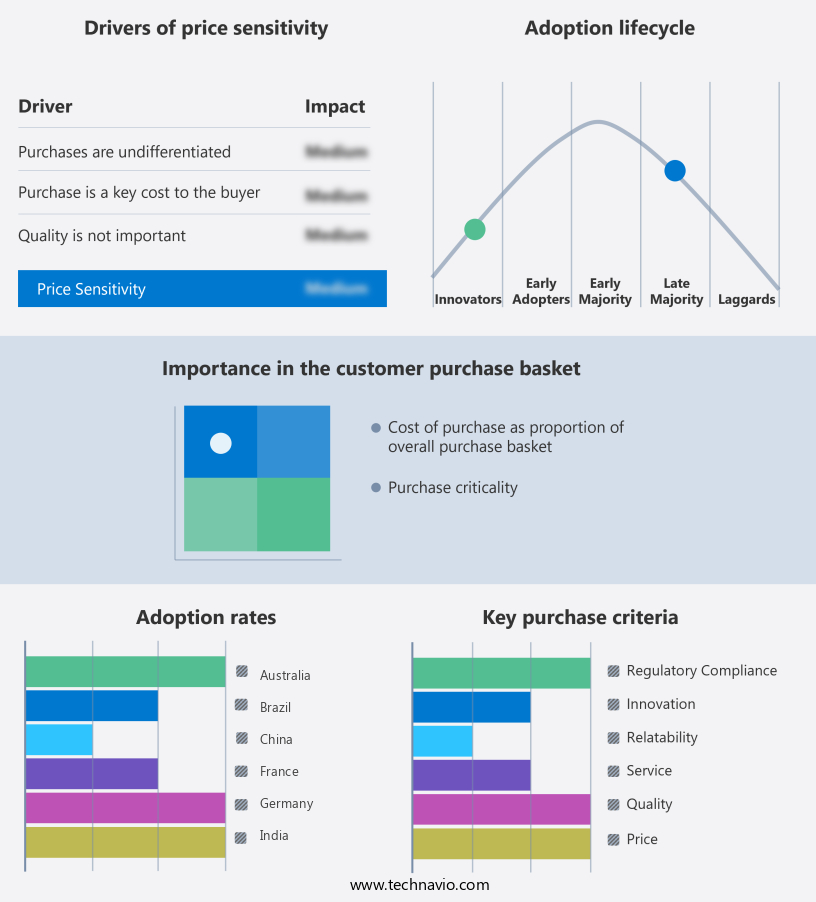
The market forecasting report includes the adoption lifecycle of the market, covering from the innovator's stage to the laggard's stage. It focuses on adoption rates in different regions based on penetration. Furthermore, the market report also includes key purchase criteria and drivers of price sensitivity to help companies evaluate and develop their market growth analysis strategies.
Customer Landscape
Key Companies & Market Insights
Companies are implementing various strategies, such as strategic alliances, market forecast, partnerships, mergers and acquisitions, geographical expansion, and product/service launches, to enhance their presence in the market.
ABB Ltd. - This company offers artificial intelligence in renewable energy solutions through its ABB Ability OPTIMAX platform.
The market research and growth report includes detailed analyses of the competitive landscape of the market and information about key companies, including:
- Aegeus Technologies
- ALFA VENTURES
- Alphabet Inc.
- E.ON SE
- GE Vernova Inc.
- GPS Renewables Pvt. Ltd.
- International Business Machines Corp.
- Microsoft Corp.
- Prescinto Technologies
- REConnect Energy
- Schneider Electric SE
- Siemens AG
- Skilancer Solar
- Tesla Inc.
Qualitative and quantitative analysis of companies has been conducted to help clients understand the wider business environment as well as the strengths and weaknesses of key market players. Data is qualitatively analyzed to categorize companies as pure play, category-focused, industry-focused, and diversified; it is quantitatively analyzed to categorize companies as dominant, leading, strong, tentative, and weak.
Research Analyst Overview
The market is witnessing significant growth and transformation, driven by advancements in technology, increasing awareness of climate change, and shifting energy policies. One of the most promising areas of innovation is the integration of artificial intelligence (AI) into various aspects of the renewable energy sector. AI is revolutionizing the renewable energy industry by optimizing energy production, consumption, and distribution. Energy modeling, a critical component of renewable energy planning, is being enhanced through AI-driven simulations and predictive analytics. This enables more accurate forecasting of energy demand and supply, ensuring a reliable and efficient energy grid.
Moreover, bioenergy, a renewable energy source derived from organic materials, is benefiting from AI applications in process streamlining and efficiency optimization. AI algorithms analyze data from various sensors to optimize the conversion process, reducing costs and increasing productivity. Off-grid energy systems, essential for providing energy access in remote areas, are being enhanced through AI-powered energy management. Smart energy grids, which use AI for load forecasting and demand response, ensure a stable power supply and reduce energy wastage. Electric vehicles (EVs) are a significant contributor to the renewable energy market, with AI playing a crucial role in their integration into the energy ecosystem.
Furthermore, AI algorithms analyze data from the power grid and EV charging stations to optimize charging patterns and ensure grid stability. Wind energy, a leading renewable energy source, is being optimized through AI-driven energy analytics. Predictive maintenance algorithms analyze data from wind turbines to identify potential issues before they become critical, reducing downtime and maintenance costs. Battery storage systems, an essential component of renewable energy systems, are being optimized through AI-powered energy management. AI algorithms analyze data from various sources to optimize battery charging and discharging patterns, ensuring efficient energy storage and usage. The renewable energy sector is also adopting AI for energy policy analysis and climate change mitigation.
|
Market Scope |
|
|
Report Coverage |
Details |
|
Page number |
221 |
|
Base year |
2024 |
|
Historic period |
2019-2023 |
|
Forecast period |
2025-2029 |
|
Growth momentum & CAGR |
Accelerate at a CAGR of 22% |
|
Market Growth 2025-2029 |
USD 6.13 billion |
|
Market structure |
Fragmented |
|
YoY growth 2024-2025(%) |
19.3 |
|
Key countries |
China, US, India, Germany, Japan, UK, Australia, France, Brazil, and Spain |
|
Competitive landscape |
Leading Companies, Market Positioning of Companies, Competitive Strategies, and Industry Risks |
What are the Key Data Covered in this Market Research and Growth Report?
- CAGR of the market during the forecast period
- Detailed information on factors that will drive the market growth and forecasting between 2025 and 2029
- Precise estimation of the size of the market and its contribution of the market in focus to the parent market
- Accurate predictions about upcoming market growth and trends and changes in consumer behaviour
- Growth of the market across APAC, Europe, North America, South America, and Middle East and Africa
- Thorough analysis of the market's competitive landscape and detailed information about companies
- Comprehensive analysis of factors that will challenge the growth of market companies
We can help! Our analysts can customize this market research report to meet your requirements. Get in touch
 RIA -
RIA - 
