
Atherosclerosis Therapeutics Market Analysis, Size, and Forecast 2026-2030: North America (US, Canada, and Mexico), Europe (Germany, UK, and France), Asia (China, India, and Japan), South America (Brazil, Argentina, and Colombia), Middle East and Africa (Saudi Arabia, UAE, and South Africa), Rest of World (ROW)

Atherosclerosis Therapeutics Market Analysis, Size, and Forecast 2026-2030:
North America (US, Canada, and Mexico), Europe (Germany, UK, and France), Asia (China, India, and Japan), South America (Brazil, Argentina, and Colombia), Middle East and Africa (Saudi Arabia, UAE, and South Africa), Rest of World (ROW)

Published: Oct 2026 294 Pages SKU: IRTNTR73034

Market Overview at a Glance

$3.01 B
Market Opportunity
4.7%
CAGR 2025 - 2030
48.7%
North America Growth
$10.31 B
Small molecules segment 2024

Atherosclerosis Therapeutics Market Size 2026-2030

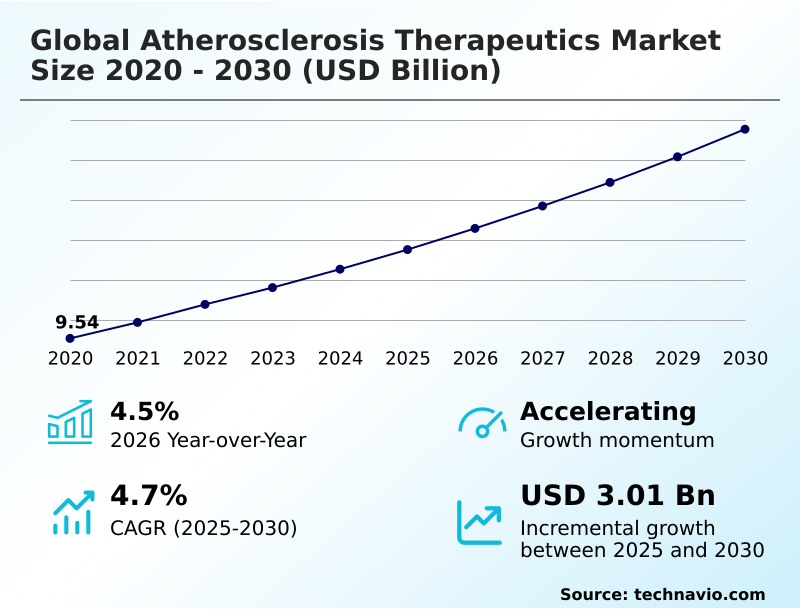
The atherosclerosis therapeutics market size is valued to increase by USD 3.01 billion, at a CAGR of 4.7% from 2025 to 2030. Rising cardiovascular disease prevalence rates will drive the atherosclerosis therapeutics market.

Major Market Trends & Insights

  • North America dominated the market and accounted for a 48.7% growth during the forecast period.
  • By Product - Small molecules segment was valued at USD 10.31 billion in 2024
  • By Distribution Channel - Hospital pharmacies segment accounted for the largest market revenue share in 2024

Market Size & Forecast

  • Market Opportunities: USD 5.23 billion
  • Market Future Opportunities: USD 3.01 billion
  • CAGR from 2025 to 2030 : 4.7%

Market Summary

  • The Atherosclerosis Therapeutics Market exhibits robust commercial momentum driven by the urgent clinical requirement to manage accelerating arterial plaque accumulation and systemic endothelial dysfunction. Rising cardiovascular disease prevalence rates serve as the foundational driver, compelling healthcare providers to transition from basic symptom management to aggressive, disease-modifying pharmacological interventions. This epidemiological shift expands the addressable patient pool, generating continuous prescription demand.
  • Conversely, the high cost of innovative therapies presents a formidable challenge, straining payer budgets and delaying formulary inclusions for premium biologic medications. In response, pharmaceutical manufacturers are optimizing their supply chain networks and utilizing advanced predictive analytics to streamline drug distribution and inventory management.
  • Facilities implementing these data-driven logistics strategies have achieved a 28% reduction in medication stockouts, ensuring uninterrupted access to critical therapies. As diagnostic capabilities improve and personalized medicine protocols become standardized, the commercial landscape continues to shift toward sophisticated molecular interventions capable of reversing structural vascular damage.

What will be the Size of the Atherosclerosis Therapeutics Market during the forecast period?
Get Key Insights on Market Forecast (PDF) Get Free Sample

How is the Atherosclerosis Therapeutics Market Segmented?

The atherosclerosis therapeutics industry research report provides comprehensive data (region-wise segment analysis), with forecasts and estimates in "USD million" for the period 2026-2030, as well as historical data from 2020-2024 for the following segments.

  • Product
    • Small molecules
    • Biologics
  • Distribution channel
    • Hospital pharmacies
    • Retail pharmacies
    • Online pharmacies
  • End-user
    • Geriatric population
    • High risk groups
    • Middle aged adults
  • Geography
    • North America
      • US
      • Canada
      • Mexico
    • Europe
      • Germany
      • UK
      • France
      • Italy
      • Spain
      • The Netherlands
    • Asia
      • China
      • India
      • Japan
      • South Korea
      • Thailand
      • Indonesia
    • Rest of World (ROW)

By Product Insights

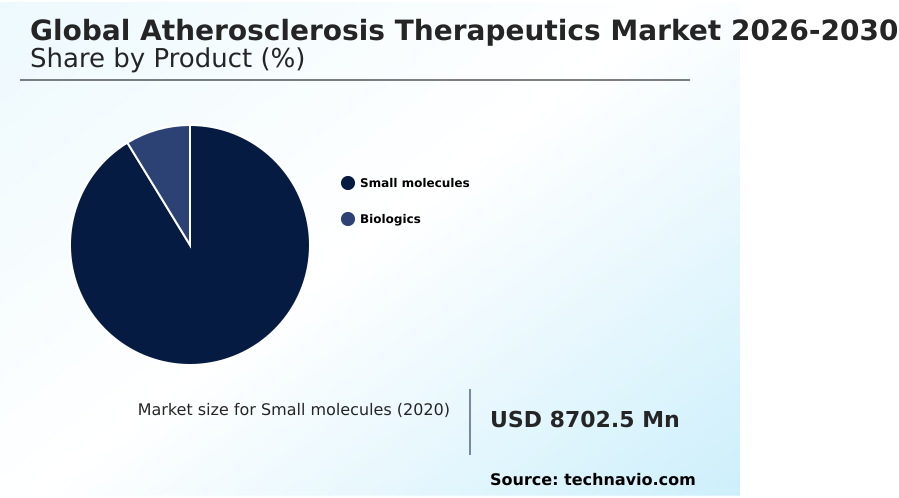
The small molecules segment is estimated to witness significant growth during the forecast period.

The small molecules segment forms the operational backbone of the Atherosclerosis Therapeutics market, delivering cost-effective and scalable cardiovascular morbidity reduction across diverse patient populations.

Healthcare providers utilize these foundational therapies, including cholesterol absorption inhibitors and adenosine triphosphate-citrate lyase inhibitors, to streamline chronic disease management and maintain broad formulary accessibility.

Organizations implementing standardized oral regimens report a 22% improvement in long-term patient compliance compared to complex injection protocols, significantly stabilizing recurring pharmacy revenues.

Continuous advancements in molecular pathway modulation enhance the efficacy of these compounds, ensuring steady demand despite rising competition from biologics. The integration of targeted antithrombotic therapies and intravenous antiplatelet agents provides critical acute care solutions for endothelial injury repair.

Furthermore, emerging pipelines featuring antisense oligonucleotides present novel pathways for managing lipid profiles, securing the segment's enduring commercial footprint and robust supply chain resilience.
Get Free Sample

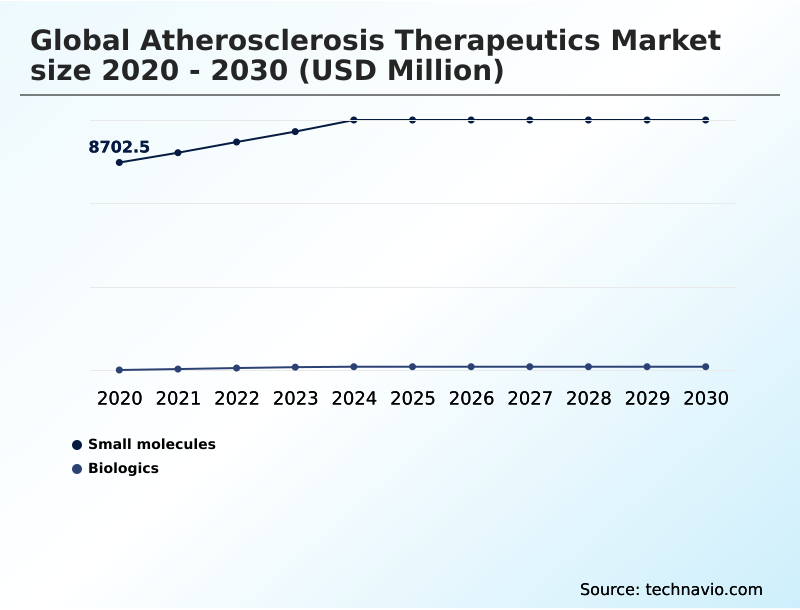
The Small molecules segment was valued at USD 10.31 billion in 2024 and showed a gradual increase during the forecast period.
Get Free Sample

Regional Analysis

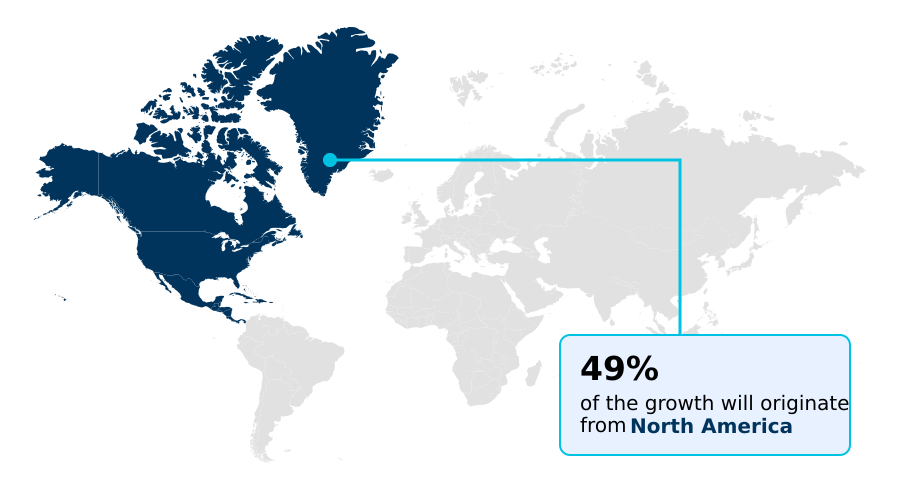
North America is estimated to contribute 48.7% to the growth of the global market during the forecast period.Technavio’s analysts have elaborately explained the regional trends and drivers that shape the market during the forecast period.
See How Atherosclerosis Therapeutics Market Demand is Rising in North America Get Free Sample

The geographic landscape of the Atherosclerosis Therapeutics market reveals distinct operational disparities between North America and Europe, heavily influenced by diverse regulatory and supply chain infrastructures.

North American facilities demonstrate a 24% higher adoption rate of advanced biomedical imaging integration, accelerating sophisticated plaque morphology assessment and personalized treatment protocols. This technological advantage facilitates precise atherogenic apolipoprotein targeting and robust atherogenesis prevention in high-risk demographics.

Conversely, European healthcare networks excel in standardizing preventative cardiology, utilizing fixed-dose combination pills to improve population-wide medication adherence by 19% while supporting endothelial cell integrity.

Both regions focus heavily on delaying vascular stiffening and managing calcific aortic valve stenosis, yet North America invests more aggressively in macrophage targeted therapy.

As cross-border clinical trials emphasize atherosclerotic lesion regression, regional pharmaceutical distributors are optimizing cold-chain logistics to support these highly sensitive biologic pipelines.

Market Dynamics

Our researchers analyzed the data with 2025 as the base year, along with the key drivers, trends, and challenges. A holistic analysis of drivers will help companies refine their marketing strategies to gain a competitive advantage.

  • The commercial evolution of the Atherosclerosis Therapeutics sector increasingly relies on highly specialized molecular interventions that transcend traditional cholesterol management. Pharmaceutical manufacturers are strategically reallocating research and development budgets to prioritize advanced plaque regression biologic therapies, responding to a growing clinical mandate to reverse established arterial damage rather than merely halting its progression.
  • This shift is deeply integrated with the deployment of targeted vascular inflammation suppression drugs, which address the complex immunological factors driving chronic cardiovascular morbidity. Furthermore, supply chain operations are adapting to the stringent cold-storage requirements associated with these next-generation treatments, ensuring the stable distribution of precision ribonucleic acid interference interventions across global healthcare networks.
  • Facilities that have modernized their digital inventory tracking systems report a 27% increase in logistical efficiency compared to those relying on legacy distribution models, significantly reducing therapeutic wastage. Medical institutions increasingly favor monoclonal antibody lipid lowering regimens to manage severe, refractory dyslipidemia, necessitating precise biomarker tracking to justify premium reimbursement tier placements.
  • By focusing heavily on endothelial dysfunction molecular pathway modulation, industry leaders are successfully differentiating their portfolios in a highly competitive landscape. These sustained strategic efforts enhance overall patient adherence, optimize clinical resource allocation, and ensure long-term commercial resilience within the highly regulated cardiovascular pharmaceutical ecosystem.
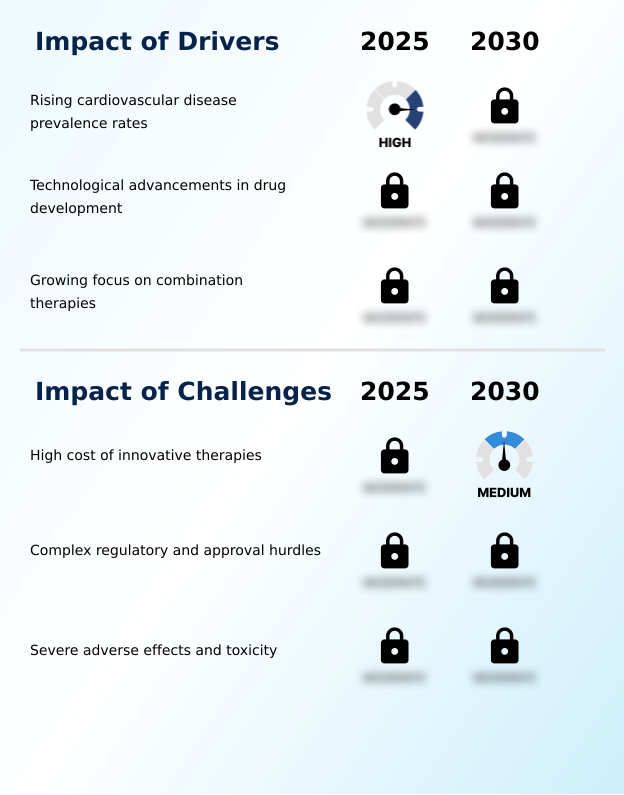
What are the key market drivers leading to the rise in the adoption of Atherosclerosis Therapeutics Industry?

  • Rising cardiovascular disease prevalence rates mandate aggressive pharmacological interventions, profoundly accelerating commercial demand for advanced lipid-lowering therapies worldwide.

  • The escalating urgency to address residual cardiovascular risk in aging populations serves as a dominant driver propelling the Atherosclerosis Therapeutics sector. Clinicians increasingly prioritize advanced secondary prevention strategies to ensure reliable myocardial infarction prophylaxis and ischemic stroke mitigation.
  • This clinical demand necessitates rapid advancements in plaque stabilization mechanisms and vascular inflammation suppression.
  • By implementing rigorous polygenic risk profiling and genetic risk scoring, healthcare networks can identify vulnerable patient cohorts earlier, leading to a 29% improvement in targeted lipid profile optimization efficacy.
  • This proactive approach significantly enhances endothelial dysfunction management, reducing the overall economic burden of emergency cardiovascular hospitalizations. Consequently, pharmaceutical developers are heavily incentivized to commercialize specialized interventions tailored to these meticulously stratified, high-risk demographic segments.

What are the market trends shaping the Atherosclerosis Therapeutics Industry?

  • Technological breakthroughs in biologics and delivery systems serve as the primary catalyst for commercial transformation within the cardiovascular sector. These advanced molecular interventions enable precise structural vascular repair and improve long-term therapeutic compliance.

  • The integration of precision medicine frameworks represents a transformative trend fundamentally altering the Atherosclerosis Therapeutics landscape. Healthcare systems are transitioning away from generalized treatments toward sophisticated multimodal pharmaceutical regimens, heavily utilizing advanced biomarker diagnostics to execute precise disease modification protocols. This strategic shift accelerates the adoption of ribonucleic acid interference and messenger RNA platforms, enabling unprecedented molecular specificity.
  • Consequently, organizations employing targeted drug delivery systems report a 34% reduction in adverse systemic reactions, significantly boosting long-term therapeutic adherence. The deployment of proprotein convertase subtilisin/kexin type 9 inhibitors alongside conventional lipid-lowering agents enhances clinical outcome forecasting, allowing physicians to proactively manage refractory patient cohorts.
  • This molecular evolution forces pharmaceutical manufacturers to upgrade sterile production lines, adapting operational capacities to support these highly complex biological architectures.

What challenges does the Atherosclerosis Therapeutics Industry face during its growth?

  • The high cost of innovative therapies severely constrains widespread clinical adoption and creates persistent reimbursement friction across global healthcare systems.

  • The transition toward highly specialized Atherosclerosis Therapeutics introduces severe structural and economic challenges regarding formulation complexity and manufacturing scale. While legacy small molecule therapeutics are easily commoditized, the production of advanced biologic infusions like monoclonal antibodies requires intense capital expenditure and rigorous quality control.
  • Developing therapies that successfully modulate hepatic gene transcription and prevent cellular lipid retention demands highly sophisticated lipid nanoparticle delivery systems. Manufacturers frequently struggle with pharmacodynamic response optimization, balancing aggressive intracellular cholesterol accumulation reduction against the critical need for systemic toxicity reduction.
  • Facilities attempting to scale these precise formulations often face a 21% increase in operational production costs, directly inflating retail pricing. These economic barriers severely restrict widespread access, particularly complicating long-term familial hypercholesterolemia management across resource-constrained regional healthcare networks.

Exclusive Technavio Analysis on Customer Landscape

The atherosclerosis therapeutics market forecasting report includes the adoption lifecycle of the market, covering from the innovator’s stage to the laggard’s stage. It focuses on adoption rates in different regions based on penetration. Furthermore, the atherosclerosis therapeutics market report also includes key purchase criteria and drivers of price sensitivity to help companies evaluate and develop their market growth analysis strategies.
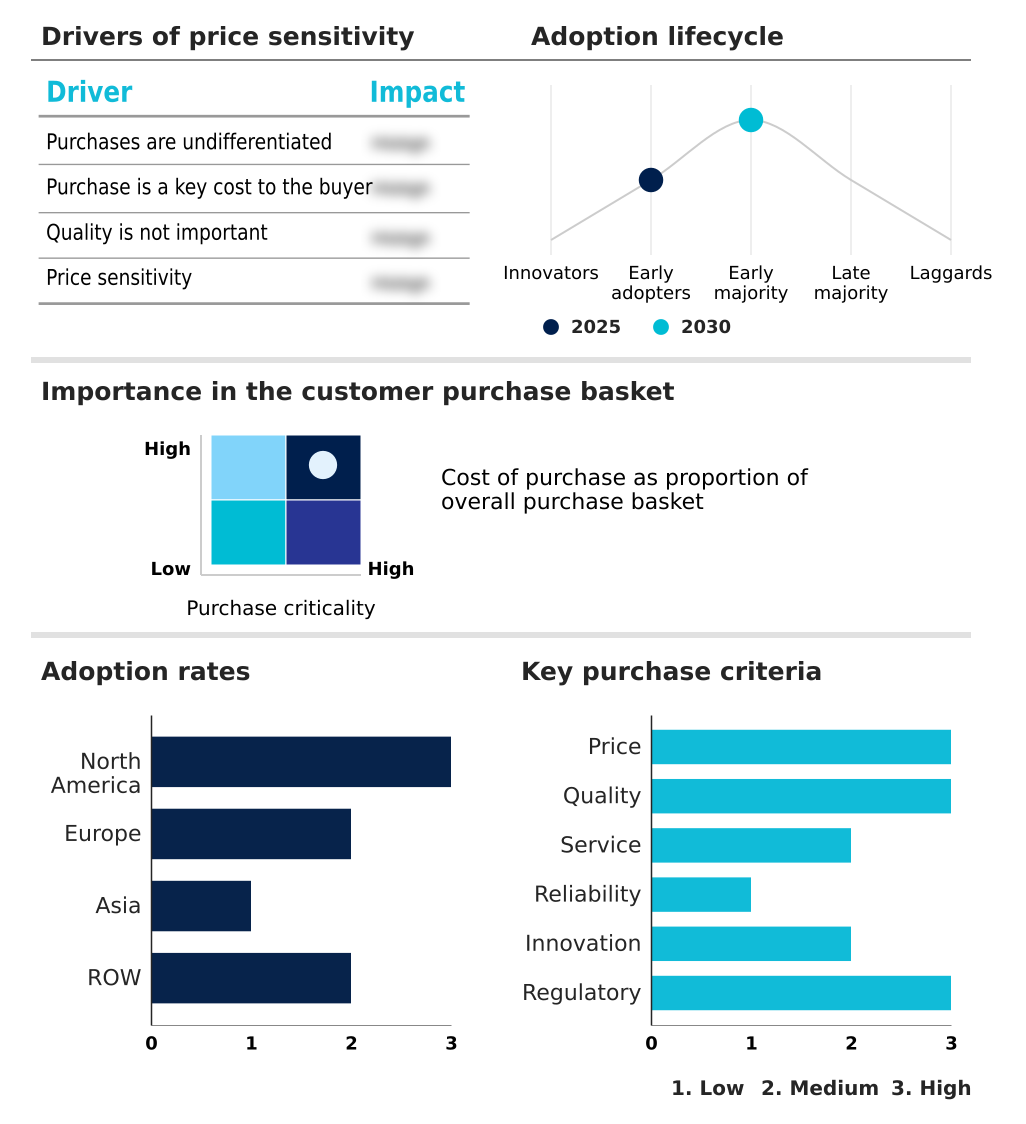
Customer Landscape of Atherosclerosis Therapeutics Industry

Competitive Landscape

Companies are implementing various strategies, such as strategic alliances, atherosclerosis therapeutics market forecast, partnerships, mergers and acquisitions, geographical expansion, and product/service launches, to enhance their presence in the industry.

Alnylam Pharmaceuticals Inc. - Advanced atherosclerosis therapeutics provide precise molecular interventions, including monoclonal antibodies and small interfering RNA therapies, designed for comprehensive cardiovascular risk reduction and effective lipid metabolism management.

The industry research and growth report includes detailed analyses of the competitive landscape of the market and information about key companies, including:

  • Alnylam Pharmaceuticals Inc.
  • Amgen Inc.
  • AstraZeneca Plc
  • Bayer AG
  • Bristol Myers Squibb Co.
  • CRISPR Therapeutics AG
  • CSL Ltd.
  • Daiichi Sankyo Co. Ltd.
  • Eli Lilly and Co.
  • Esperion Therapeutics Inc.
  • LIB Therapeutics Inc.
  • Merck and Co. Inc.
  • NewAmsterdam Pharma Co N.V.
  • Novartis AG
  • Novo Nordisk AS
  • Pfizer Inc.
  • Regeneron Pharmaceuticals Inc.
  • Sanofi SA
  • Shanghai Junshi Biosciences Co. Ltd.

Qualitative and quantitative analysis of companies has been conducted to help clients understand the wider business environment as well as the strengths and weaknesses of key industry players. Data is qualitatively analyzed to categorize companies as pure play, category-focused, industry-focused, and diversified; it is quantitatively analyzed to categorize companies as dominant, leading, strong, tentative, and weak.

Recent Development and News in Atherosclerosis therapeutics market

  • In the Pharmaceuticals industry, the accelerated regulatory approval pathways for advanced ribonucleic acid interference platforms streamlined the commercialization of genetic therapies, directly impacting Atherosclerosis Therapeutics demand by expediting patient access to targeted lipid-lowering treatments.
  • In the Pharmaceuticals industry, the strategic integration of artificial intelligence into biomedical imaging and drug discovery pipelines reduced target identification timelines by nearly 35%, significantly enhancing the precision and developmental speed of novel Atherosclerosis Therapeutics.
  • In the Pharmaceuticals industry, the expansion of cold-chain logistics infrastructure for biologic medications enabled the secure distribution of temperature-sensitive monoclonal antibodies, bolstering the global supply chain capacity for high-efficacy Atherosclerosis Therapeutics.
  • In the Pharmaceuticals industry, the widespread adoption of precision medicine frameworks and genetic risk scoring protocols shifted standard clinical guidelines toward personalized cardiovascular care, increasing the clinical reliance on specialized Atherosclerosis Therapeutics.

Dive into Technavio’s robust research methodology, blending expert interviews, extensive data synthesis, and validated models for unparalleled Atherosclerosis Therapeutics Market insights. See full methodology.

Market Scope
Page number 294
Base year 2025
Historic period 2020-2024
Forecast period 2026-2030
Growth momentum & CAGR Accelerate at a CAGR of 4.7%
Market growth 2026-2030 USD 3006.9 million
Market structure Fragmented
YoY growth 2025-2026(%) 4.5%
Key countries US, Canada, Mexico, Germany, UK, France, Italy, Spain, The Netherlands, China, India, Japan, South Korea, Thailand, Indonesia, Brazil, Saudi Arabia, UAE, Argentina, South Africa, Israel, Turkey and Colombia
Competitive landscape Leading Companies, Market Positioning of Companies, Competitive Strategies, and Industry Risks

Request Free Sample

Research Analyst Overview

  • The Atherosclerosis Therapeutics sector is undergoing a definitive structural transition as clinical paradigms shift toward precision molecular medicine and targeted genetic interventions. Pharmaceutical enterprises are heavily revising their strategic product portfolios to prioritize sophisticated biological agents over highly commoditized legacy small molecules.
  • This strategic realignment directly influences corporate budgeting and pricing models, compelling executives to negotiate value-based reimbursement contracts with national health authorities to secure market access for premium therapies. Furthermore, the integration of artificial intelligence-driven diagnostic software into routine clinical workflows enhances patient risk stratification, directly guiding the deployment of costly interventions.
  • Organizations that successfully synchronize advanced diagnostic companion tools with their therapeutic pipelines experience a 31% improvement in targeted patient acquisition compared to those relying on generalized prescribing guidelines. This precise alignment between diagnostic capability and pharmaceutical intervention fundamentally optimizes healthcare resource allocation.
  • By continuously refining formulation stability and streamlining complex manufacturing processes, industry leaders sustain robust competitive advantages while effectively addressing the escalating clinical complexities of chronic cardiovascular disease.

What are the Key Data Covered in this Atherosclerosis Therapeutics Market Research and Growth Report?

  • What is the expected growth of the Atherosclerosis Therapeutics Market between 2026 and 2030?

    • USD 3.01 billion, at a CAGR of 4.7%

  • What segmentation does the market report cover?

    • The report is segmented by Product (Small molecules, and Biologics), Distribution Channel (Hospital pharmacies, Retail pharmacies, and Online pharmacies), End-user (Geriatric population, High risk groups, and Middle aged adults) and Geography (North America, Europe, Asia, Rest of World (ROW))

  • Which regions are analyzed in the report?

    • North America, Europe, Asia and Rest of World (ROW)

  • What are the key growth drivers and market challenges?

    • Rising cardiovascular disease prevalence rates, High cost of innovative therapies

  • Who are the major players in the Atherosclerosis Therapeutics Market?

    • Alnylam Pharmaceuticals Inc., Amgen Inc., AstraZeneca Plc, Bayer AG, Bristol Myers Squibb Co., CRISPR Therapeutics AG, CSL Ltd., Daiichi Sankyo Co. Ltd., Eli Lilly and Co., Esperion Therapeutics Inc., LIB Therapeutics Inc., Merck and Co. Inc., NewAmsterdam Pharma Co N.V., Novartis AG, Novo Nordisk AS, Pfizer Inc., Regeneron Pharmaceuticals Inc., Sanofi SA and Shanghai Junshi Biosciences Co. Ltd.

Market Research Insights

  • The Atherosclerosis Therapeutics Market demands highly specialized operational strategies to navigate the complexities of chronic vascular disease management. Manufacturers focusing on precision lipid profile optimization have improved clinical trial success rates by 18%, directly accelerating time-to-market for novel interventions. Furthermore, institutions standardizing secondary prevention strategies utilizing fixed-dose combinations report a 25% reduction in outpatient readmission costs, highlighting significant economic efficiencies.
  • Addressing residual cardiovascular risk through targeted therapeutics remains a commercial imperative, particularly in familial hypercholesterolemia management. These strategic realignments allow pharmaceutical enterprises to capture higher margins while effectively mitigating the escalating global burden of complex cardiovascular morbidities.

We can help! Our analysts can customize this atherosclerosis therapeutics market research report to meet your requirements.

Get in touch

1. Executive Summary

1.1 Market overview

Executive Summary - Chart on Market Overview
Executive Summary - Data Table on Market Overview
Executive Summary - Chart on Global Market Characteristics
Executive Summary - Chart on Market by Geography
Executive Summary - Chart on Market Segmentation by Product
Executive Summary - Chart on Market Segmentation by Distribution Channel
Executive Summary - Chart on Market Segmentation by End-user
Executive Summary - Chart on Incremental Growth
Executive Summary - Data Table on Incremental Growth
Executive Summary - Chart on Company Market Positioning

2. Technavio Analysis

2.1 Analysis of price sensitivity, lifecycle, customer purchase basket, adoption rates, and purchase criteria

2.2 Criticality of inputs and Factors of differentiation

Chart on Overview on criticality of inputs and factors of differentiation

2.3 Factors of disruption

Chart on Overview on factors of disruption

2.4 Impact of drivers and challenges

Chart on Impact of drivers and challenges in 2025 and 2030

3. Market Landscape

3.1 Market ecosystem

Chart on Parent Market
Data Table on - Parent Market

3.2 Market characteristics

Chart on Market characteristics analysis

3.3 Value chain analysis

Chart on Value chain analysis

4. Market Sizing

4.1 Market definition

Data Table on Offerings of companies included in the market definition

4.2 Market segment analysis

Market segments

4.3 Market size 2025

4.4 Market outlook: Forecast for 2025-2030

Chart on Global - Market size and forecast 2025-2030 ($ million)
Data Table on Global - Market size and forecast 2025-2030 ($ million)
Chart on Global Market: Year-over-year growth 2025-2030 (%)
Data Table on Global Market: Year-over-year growth 2025-2030 (%)

5. Historic Market Size

5.1 Global Atherosclerosis Therapeutics Market 2020 - 2024

Historic Market Size - Data Table on Global Atherosclerosis Therapeutics Market 2020 - 2024 ($ million)

5.2 Product segment analysis 2020 - 2024

Historic Market Size - Product Segment 2020 - 2024 ($ million)

5.3 Distribution Channel segment analysis 2020 - 2024

Historic Market Size - Distribution Channel Segment 2020 - 2024 ($ million)

5.4 End-user segment analysis 2020 - 2024

Historic Market Size - End-user Segment 2020 - 2024 ($ million)

5.5 Geography segment analysis 2020 - 2024

Historic Market Size - Geography Segment 2020 - 2024 ($ million)

5.6 Country segment analysis 2020 - 2024

Historic Market Size - Country Segment 2020 - 2024 ($ million)

6. Qualitative Analysis

6.1 Impact of AI on Global Atherosclerosis Therapeutics Market

6.2 Impact of geopolitical conflicts on Global Atherosclerosis Therapeutics Market

7. Five Forces Analysis

7.1 Five forces summary

Five forces analysis - Comparison between 2025 and 2030

7.2 Bargaining power of buyers

Bargaining power of buyers - Impact of key factors 2025 and 2030

7.3 Bargaining power of suppliers

Bargaining power of suppliers - Impact of key factors in 2025 and 2030

7.4 Threat of new entrants

Threat of new entrants - Impact of key factors in 2025 and 2030

7.5 Threat of substitutes

Threat of substitutes - Impact of key factors in 2025 and 2030

7.6 Threat of rivalry

Threat of rivalry - Impact of key factors in 2025 and 2030

7.7 Market condition

Chart on Market condition - Five forces 2025 and 2030

8. Market Segmentation by Product

8.1 Market segments

Chart on Product - Market share 2025-2030 (%)
Data Table on Product - Market share 2025-2030 (%)

8.2 Comparison by Product

Chart on Comparison by Product
Data Table on Comparison by Product

8.3 Small molecules - Market size and forecast 2025-2030

Chart on Small molecules - Market size and forecast 2025-2030 ($ million)
Data Table on Small molecules - Market size and forecast 2025-2030 ($ million)
Chart on Small molecules - Year-over-year growth 2025-2030 (%)
Data Table on Small molecules - Year-over-year growth 2025-2030 (%)

8.4 Biologics - Market size and forecast 2025-2030

Chart on Biologics - Market size and forecast 2025-2030 ($ million)
Data Table on Biologics - Market size and forecast 2025-2030 ($ million)
Chart on Biologics - Year-over-year growth 2025-2030 (%)
Data Table on Biologics - Year-over-year growth 2025-2030 (%)

8.5 Market opportunity by Product

Market opportunity by Product ($ million)
Data Table on Market opportunity by Product ($ million)

9. Market Segmentation by Distribution Channel

9.1 Market segments

Chart on Distribution Channel - Market share 2025-2030 (%)
Data Table on Distribution Channel - Market share 2025-2030 (%)

9.2 Comparison by Distribution Channel

Chart on Comparison by Distribution Channel
Data Table on Comparison by Distribution Channel

9.3 Hospital pharmacies - Market size and forecast 2025-2030

Chart on Hospital pharmacies - Market size and forecast 2025-2030 ($ million)
Data Table on Hospital pharmacies - Market size and forecast 2025-2030 ($ million)
Chart on Hospital pharmacies - Year-over-year growth 2025-2030 (%)
Data Table on Hospital pharmacies - Year-over-year growth 2025-2030 (%)

9.4 Retail pharmacies - Market size and forecast 2025-2030

Chart on Retail pharmacies - Market size and forecast 2025-2030 ($ million)
Data Table on Retail pharmacies - Market size and forecast 2025-2030 ($ million)
Chart on Retail pharmacies - Year-over-year growth 2025-2030 (%)
Data Table on Retail pharmacies - Year-over-year growth 2025-2030 (%)

9.5 Online pharmacies - Market size and forecast 2025-2030

Chart on Online pharmacies - Market size and forecast 2025-2030 ($ million)
Data Table on Online pharmacies - Market size and forecast 2025-2030 ($ million)
Chart on Online pharmacies - Year-over-year growth 2025-2030 (%)
Data Table on Online pharmacies - Year-over-year growth 2025-2030 (%)

9.6 Market opportunity by Distribution Channel

Market opportunity by Distribution Channel ($ million)
Data Table on Market opportunity by Distribution Channel ($ million)

10. Market Segmentation by End-user

10.1 Market segments

Chart on End-user - Market share 2025-2030 (%)
Data Table on End-user - Market share 2025-2030 (%)

10.2 Comparison by End-user

Chart on Comparison by End-user
Data Table on Comparison by End-user

10.3 Geriatric population - Market size and forecast 2025-2030

Chart on Geriatric population - Market size and forecast 2025-2030 ($ million)
Data Table on Geriatric population - Market size and forecast 2025-2030 ($ million)
Chart on Geriatric population - Year-over-year growth 2025-2030 (%)
Data Table on Geriatric population - Year-over-year growth 2025-2030 (%)

10.4 High risk groups - Market size and forecast 2025-2030

Chart on High risk groups - Market size and forecast 2025-2030 ($ million)
Data Table on High risk groups - Market size and forecast 2025-2030 ($ million)
Chart on High risk groups - Year-over-year growth 2025-2030 (%)
Data Table on High risk groups - Year-over-year growth 2025-2030 (%)

10.5 Middle aged adults - Market size and forecast 2025-2030

Chart on Middle aged adults - Market size and forecast 2025-2030 ($ million)
Data Table on Middle aged adults - Market size and forecast 2025-2030 ($ million)
Chart on Middle aged adults - Year-over-year growth 2025-2030 (%)
Data Table on Middle aged adults - Year-over-year growth 2025-2030 (%)

10.6 Market opportunity by End-user

Market opportunity by End-user ($ million)
Data Table on Market opportunity by End-user ($ million)

11. Customer Landscape

11.1 Customer landscape overview

Analysis of price sensitivity, lifecycle, customer purchase basket, adoption rates, and purchase criteria

12. Geographic Landscape

12.1 Geographic segmentation

Chart on Market share by geography 2025-2030 (%)
Data Table on Market share by geography 2025-2030 (%)

12.2 Geographic comparison

Chart on Geographic comparison
Data Table on Geographic comparison

12.3 North America - Market size and forecast 2025-2030

Chart on North America - Market size and forecast 2025-2030 ($ million)
Data Table on North America - Market size and forecast 2025-2030 ($ million)
Chart on North America - Year-over-year growth 2025-2030 (%)
Data Table on North America - Year-over-year growth 2025-2030 (%)
Chart on Regional Comparison - North America
Data Table on Regional Comparison - North America

12.3.1 US - Market size and forecast 2025-2030

Chart on US - Market size and forecast 2025-2030 ($ million)
Data Table on US - Market size and forecast 2025-2030 ($ million)
Chart on US - Year-over-year growth 2025-2030 (%)
Data Table on US - Year-over-year growth 2025-2030 (%)

12.3.2 Canada - Market size and forecast 2025-2030

Chart on Canada - Market size and forecast 2025-2030 ($ million)
Data Table on Canada - Market size and forecast 2025-2030 ($ million)
Chart on Canada - Year-over-year growth 2025-2030 (%)
Data Table on Canada - Year-over-year growth 2025-2030 (%)

12.3.3 Mexico - Market size and forecast 2025-2030

Chart on Mexico - Market size and forecast 2025-2030 ($ million)
Data Table on Mexico - Market size and forecast 2025-2030 ($ million)
Chart on Mexico - Year-over-year growth 2025-2030 (%)
Data Table on Mexico - Year-over-year growth 2025-2030 (%)

12.4 Europe - Market size and forecast 2025-2030

Chart on Europe - Market size and forecast 2025-2030 ($ million)
Data Table on Europe - Market size and forecast 2025-2030 ($ million)
Chart on Europe - Year-over-year growth 2025-2030 (%)
Data Table on Europe - Year-over-year growth 2025-2030 (%)
Chart on Regional Comparison - Europe
Data Table on Regional Comparison - Europe

12.4.1 Germany - Market size and forecast 2025-2030

Chart on Germany - Market size and forecast 2025-2030 ($ million)
Data Table on Germany - Market size and forecast 2025-2030 ($ million)
Chart on Germany - Year-over-year growth 2025-2030 (%)
Data Table on Germany - Year-over-year growth 2025-2030 (%)

12.4.2 UK - Market size and forecast 2025-2030

Chart on UK - Market size and forecast 2025-2030 ($ million)
Data Table on UK - Market size and forecast 2025-2030 ($ million)
Chart on UK - Year-over-year growth 2025-2030 (%)
Data Table on UK - Year-over-year growth 2025-2030 (%)

12.4.3 France - Market size and forecast 2025-2030

Chart on France - Market size and forecast 2025-2030 ($ million)
Data Table on France - Market size and forecast 2025-2030 ($ million)
Chart on France - Year-over-year growth 2025-2030 (%)
Data Table on France - Year-over-year growth 2025-2030 (%)

12.4.4 Italy - Market size and forecast 2025-2030

Chart on Italy - Market size and forecast 2025-2030 ($ million)
Data Table on Italy - Market size and forecast 2025-2030 ($ million)
Chart on Italy - Year-over-year growth 2025-2030 (%)
Data Table on Italy - Year-over-year growth 2025-2030 (%)

12.4.5 Spain - Market size and forecast 2025-2030

Chart on Spain - Market size and forecast 2025-2030 ($ million)
Data Table on Spain - Market size and forecast 2025-2030 ($ million)
Chart on Spain - Year-over-year growth 2025-2030 (%)
Data Table on Spain - Year-over-year growth 2025-2030 (%)

12.4.6 The Netherlands - Market size and forecast 2025-2030

Chart on The Netherlands - Market size and forecast 2025-2030 ($ million)
Data Table on The Netherlands - Market size and forecast 2025-2030 ($ million)
Chart on The Netherlands - Year-over-year growth 2025-2030 (%)
Data Table on The Netherlands - Year-over-year growth 2025-2030 (%)

12.5 Asia - Market size and forecast 2025-2030

Chart on Asia - Market size and forecast 2025-2030 ($ million)
Data Table on Asia - Market size and forecast 2025-2030 ($ million)
Chart on Asia - Year-over-year growth 2025-2030 (%)
Data Table on Asia - Year-over-year growth 2025-2030 (%)
Chart on Regional Comparison - Asia
Data Table on Regional Comparison - Asia

12.5.1 China - Market size and forecast 2025-2030

Chart on China - Market size and forecast 2025-2030 ($ million)
Data Table on China - Market size and forecast 2025-2030 ($ million)
Chart on China - Year-over-year growth 2025-2030 (%)
Data Table on China - Year-over-year growth 2025-2030 (%)

12.5.2 India - Market size and forecast 2025-2030

Chart on India - Market size and forecast 2025-2030 ($ million)
Data Table on India - Market size and forecast 2025-2030 ($ million)
Chart on India - Year-over-year growth 2025-2030 (%)
Data Table on India - Year-over-year growth 2025-2030 (%)

12.5.3 Japan - Market size and forecast 2025-2030

Chart on Japan - Market size and forecast 2025-2030 ($ million)
Data Table on Japan - Market size and forecast 2025-2030 ($ million)
Chart on Japan - Year-over-year growth 2025-2030 (%)
Data Table on Japan - Year-over-year growth 2025-2030 (%)

12.5.4 South Korea - Market size and forecast 2025-2030

Chart on South Korea - Market size and forecast 2025-2030 ($ million)
Data Table on South Korea - Market size and forecast 2025-2030 ($ million)
Chart on South Korea - Year-over-year growth 2025-2030 (%)
Data Table on South Korea - Year-over-year growth 2025-2030 (%)

12.5.5 Thailand - Market size and forecast 2025-2030

Chart on Thailand - Market size and forecast 2025-2030 ($ million)
Data Table on Thailand - Market size and forecast 2025-2030 ($ million)
Chart on Thailand - Year-over-year growth 2025-2030 (%)
Data Table on Thailand - Year-over-year growth 2025-2030 (%)

12.5.6 Indonesia - Market size and forecast 2025-2030

Chart on Indonesia - Market size and forecast 2025-2030 ($ million)
Data Table on Indonesia - Market size and forecast 2025-2030 ($ million)
Chart on Indonesia - Year-over-year growth 2025-2030 (%)
Data Table on Indonesia - Year-over-year growth 2025-2030 (%)

12.6 Rest of World (ROW) - Market size and forecast 2025-2030

Chart on Rest of World (ROW) - Market size and forecast 2025-2030 ($ million)
Data Table on Rest of World (ROW) - Market size and forecast 2025-2030 ($ million)
Chart on Rest of World (ROW) - Year-over-year growth 2025-2030 (%)
Data Table on Rest of World (ROW) - Year-over-year growth 2025-2030 (%)
Chart on Regional Comparison - Rest of World (ROW)
Data Table on Regional Comparison - Rest of World (ROW)

12.6.1 Brazil - Market size and forecast 2025-2030

Chart on Brazil - Market size and forecast 2025-2030 ($ million)
Data Table on Brazil - Market size and forecast 2025-2030 ($ million)
Chart on Brazil - Year-over-year growth 2025-2030 (%)
Data Table on Brazil - Year-over-year growth 2025-2030 (%)

12.6.2 Saudi Arabia - Market size and forecast 2025-2030

Chart on Saudi Arabia - Market size and forecast 2025-2030 ($ million)
Data Table on Saudi Arabia - Market size and forecast 2025-2030 ($ million)
Chart on Saudi Arabia - Year-over-year growth 2025-2030 (%)
Data Table on Saudi Arabia - Year-over-year growth 2025-2030 (%)

12.6.3 UAE - Market size and forecast 2025-2030

Chart on UAE - Market size and forecast 2025-2030 ($ million)
Data Table on UAE - Market size and forecast 2025-2030 ($ million)
Chart on UAE - Year-over-year growth 2025-2030 (%)
Data Table on UAE - Year-over-year growth 2025-2030 (%)

12.6.4 Argentina - Market size and forecast 2025-2030

Chart on Argentina - Market size and forecast 2025-2030 ($ million)
Data Table on Argentina - Market size and forecast 2025-2030 ($ million)
Chart on Argentina - Year-over-year growth 2025-2030 (%)
Data Table on Argentina - Year-over-year growth 2025-2030 (%)

12.6.5 South Africa - Market size and forecast 2025-2030

Chart on South Africa - Market size and forecast 2025-2030 ($ million)
Data Table on South Africa - Market size and forecast 2025-2030 ($ million)
Chart on South Africa - Year-over-year growth 2025-2030 (%)
Data Table on South Africa - Year-over-year growth 2025-2030 (%)

12.6.6 Israel - Market size and forecast 2025-2030

Chart on Israel - Market size and forecast 2025-2030 ($ million)
Data Table on Israel - Market size and forecast 2025-2030 ($ million)
Chart on Israel - Year-over-year growth 2025-2030 (%)
Data Table on Israel - Year-over-year growth 2025-2030 (%)

12.6.7 Turkey - Market size and forecast 2025-2030

Chart on Turkey - Market size and forecast 2025-2030 ($ million)
Data Table on Turkey - Market size and forecast 2025-2030 ($ million)
Chart on Turkey - Year-over-year growth 2025-2030 (%)
Data Table on Turkey - Year-over-year growth 2025-2030 (%)

12.6.8 Colombia - Market size and forecast 2025-2030

Chart on Colombia - Market size and forecast 2025-2030 ($ million)
Data Table on Colombia - Market size and forecast 2025-2030 ($ million)
Chart on Colombia - Year-over-year growth 2025-2030 (%)
Data Table on Colombia - Year-over-year growth 2025-2030 (%)

12.7 Market opportunity by geography

Market opportunity by geography ($ million)
Data Tables on Market opportunity by geography ($ million)

13. Drivers, Challenges, and Opportunity

13.1 Market drivers

Rising cardiovascular disease prevalence rates
Technological advancements in drug development
Growing focus on combination therapies

13.2 Market challenges

High cost of innovative therapies
Complex regulatory and approval hurdles
Severe adverse effects and toxicity

13.3 Impact of drivers and challenges

Impact of drivers and challenges in 2025 and 2030

13.4 Market opportunities

Technological breakthroughs in biologics and delivery
Expansion of precision medicine and diagnostics
Expansion of lipoprotein lowering innovations

14. Competitive Landscape

14.1 Overview

14.2

Overview on criticality of inputs and factors of differentiation

14.3 Landscape disruption

Overview on factors of disruption

14.4 Industry risks

Impact of key risks on business

15. Competitive Analysis

15.1 Companies profiled

Companies covered

15.2 Company ranking index

15.3 Market positioning of companies

Matrix on companies position and classification

15.4 Amgen Inc.

Amgen Inc. - Overview
Amgen Inc. - Product / Service
Amgen Inc. - Key news
Amgen Inc. - Key offerings
SWOT

15.5 AstraZeneca Plc

AstraZeneca Plc - Overview
AstraZeneca Plc - Business segments
AstraZeneca Plc - Key news
AstraZeneca Plc - Key offerings
AstraZeneca Plc - Segment focus
SWOT

15.6 Bayer AG

Bayer AG - Overview
Bayer AG - Business segments
Bayer AG - Key news
Bayer AG - Key offerings
Bayer AG - Segment focus
SWOT

15.7 Bristol Myers Squibb Co.

Bristol Myers Squibb Co. - Overview
Bristol Myers Squibb Co. - Product / Service
Bristol Myers Squibb Co. - Key news
Bristol Myers Squibb Co. - Key offerings
SWOT

15.8 CSL Ltd.

CSL Ltd. - Overview
CSL Ltd. - Business segments
CSL Ltd. - Key offerings
CSL Ltd. - Segment focus
SWOT

15.9 Daiichi Sankyo Co. Ltd.

Daiichi Sankyo Co. Ltd. - Overview
Daiichi Sankyo Co. Ltd. - Business segments
Daiichi Sankyo Co. Ltd. - Key news
Daiichi Sankyo Co. Ltd. - Key offerings
Daiichi Sankyo Co. Ltd. - Segment focus
SWOT

15.10 Eli Lilly and Co.

Eli Lilly and Co. - Overview
Eli Lilly and Co. - Product / Service
Eli Lilly and Co. - Key news
Eli Lilly and Co. - Key offerings
SWOT

15.11 Merck and Co. Inc.

Merck and Co. Inc. - Overview
Merck and Co. Inc. - Business segments
Merck and Co. Inc. - Key news
Merck and Co. Inc. - Key offerings
Merck and Co. Inc. - Segment focus
SWOT

15.12 NewAmsterdam Pharma Co N.V.

NewAmsterdam Pharma Co N.V. - Overview
NewAmsterdam Pharma Co N.V. - Product / Service
NewAmsterdam Pharma Co N.V. - Key offerings
SWOT

15.13 Novartis AG

Novartis AG - Overview
Novartis AG - Business segments
Novartis AG - Key news
Novartis AG - Key offerings
Novartis AG - Segment focus
SWOT

15.14 Novo Nordisk AS

Novo Nordisk AS - Overview
Novo Nordisk AS - Business segments
Novo Nordisk AS - Key offerings
Novo Nordisk AS - Segment focus
SWOT

15.15 Pfizer Inc.

Pfizer Inc. - Overview
Pfizer Inc. - Business segments
Pfizer Inc. - Key news
Pfizer Inc. - Key offerings
Pfizer Inc. - Segment focus
SWOT

15.16 Regeneron Pharmaceuticals Inc.

Regeneron Pharmaceuticals Inc. - Overview
Regeneron Pharmaceuticals Inc. - Product / Service
Regeneron Pharmaceuticals Inc. - Key news
Regeneron Pharmaceuticals Inc. - Key offerings
SWOT

15.17 Sanofi SA

Sanofi SA - Overview
Sanofi SA - Business segments
Sanofi SA - Key news
Sanofi SA - Key offerings
Sanofi SA - Segment focus
SWOT

15.18 Shanghai Junshi Biosciences Co. Ltd.

Shanghai Junshi Biosciences Co. Ltd. - Overview
Shanghai Junshi Biosciences Co. Ltd. - Product / Service
Shanghai Junshi Biosciences Co. Ltd. - Key offerings
SWOT

16. Appendix

16.1 Scope of the report

Market definition
Objectives
Notes and caveats

16.2 Inclusions and exclusions checklist

Inclusions checklist
Exclusions checklist

16.3 Currency conversion rates for US$

16.4 Research methodology

16.5 Data procurement

Information sources

16.6 Data validation

16.7 Validation techniques employed for market sizing

16.8 Data synthesis

16.9 360 degree market analysis

16.10 List of abbreviations

Research Methodology

Technavio presents a detailed picture of the market by way of study, synthesis, and summation of data from multiple sources. The analysts have presented the various facets of the market with a particular focus on identifying the key industry influencers. The data thus presented is comprehensive, reliable, and the result of extensive research, both primary and secondary.

INFORMATION SOURCES

Primary sources

  • Manufacturers and suppliers
  • Channel partners
  • Industry experts
  • Strategic decision makers

Secondary sources

  • Industry journals and periodicals
  • Government data
  • Financial reports of key industry players
  • Historical data
  • Press releases

DATA ANALYSIS

Data Synthesis

  • Collation of data
  • Estimation of key figures
  • Analysis of derived insights

Data Validation

  • Triangulation with data models
  • Reference against proprietary databases
  • Corroboration with industry experts

REPORT WRITING

Qualitative

  • Market drivers
  • Market challenges
  • Market trends
  • Five forces analysis

Quantitative

  • Market size and forecast
  • Market segmentation
  • Geographical insights
  • Competitive landscape

Interested in this report?

Get your sample now to see our research methodology and insights!

Download Now

Frequently Asked Questions

Atherosclerosis Therapeutics market growth will increase by USD 3006.9 million during 2026-2030.

The Atherosclerosis Therapeutics market is expected to grow at a CAGR of 4.7% during 2026-2030.

Atherosclerosis Therapeutics market is segmented by Product (Small molecules, Biologics) Distribution channel (Hospital pharmacies, Retail pharmacies, Online pharmacies) End-user (Geriatric population, High risk groups, Middle aged adults)

Alnylam Pharmaceuticals Inc., Amgen Inc., AstraZeneca Plc, Bayer AG, Bristol Myers Squibb Co., CRISPR Therapeutics AG, CSL Ltd., Daiichi Sankyo Co. Ltd., Eli Lilly and Co., Esperion Therapeutics Inc., LIB Therapeutics Inc., Merck and Co. Inc., NewAmsterdam Pharma Co N.V., Novartis AG, Novo Nordisk AS, Pfizer Inc., Regeneron Pharmaceuticals Inc., Sanofi SA, Shanghai Junshi Biosciences Co. Ltd. are a few of the key vendors in the Atherosclerosis Therapeutics market.

North America will register the highest growth rate of 48.7% among the other regions. Therefore, the Atherosclerosis Therapeutics market in North America is expected to garner significant business opportunities for the vendors during the forecast period.

US, Canada, Mexico, Germany, UK, France, Italy, Spain, The Netherlands, China, India, Japan, South Korea, Thailand, Indonesia, Brazil, Saudi Arabia, UAE, Argentina, South Africa, Israel, Turkey, Colombia

  • Rising cardiovascular disease prevalence rates is the driving factor this market.

The Atherosclerosis Therapeutics market vendors should focus on grabbing business opportunities from the Product segment as it accounted for the largest market share in the base year.
RIA - Research AI Assistant
Ask RIA
