
Audience Analytics Market Analysis, Size, and Forecast 2026-2030: North America (US, Canada, and Mexico), Europe (UK, Germany, and France), APAC (China, Japan, and India), Middle East and Africa (UAE, Saudi Arabia, and South Africa), South America (Brazil, Argentina, and Chile), and Rest of World (ROW)

Audience Analytics Market Analysis, Size, and Forecast 2026-2030:
North America (US, Canada, and Mexico), Europe (UK, Germany, and France), APAC (China, Japan, and India), Middle East and Africa (UAE, Saudi Arabia, and South Africa), South America (Brazil, Argentina, and Chile), and Rest of World (ROW)

Published: Oct 2026 300 Pages SKU: IRTNTR74172

Market Overview at a Glance

$3.71 B
Market Opportunity
9.5%
CAGR 2025 - 2030
46.3%
North America Growth
$2.92 B
Sales and marketing management segment 2024

Audience Analytics Market Size 2026-2030

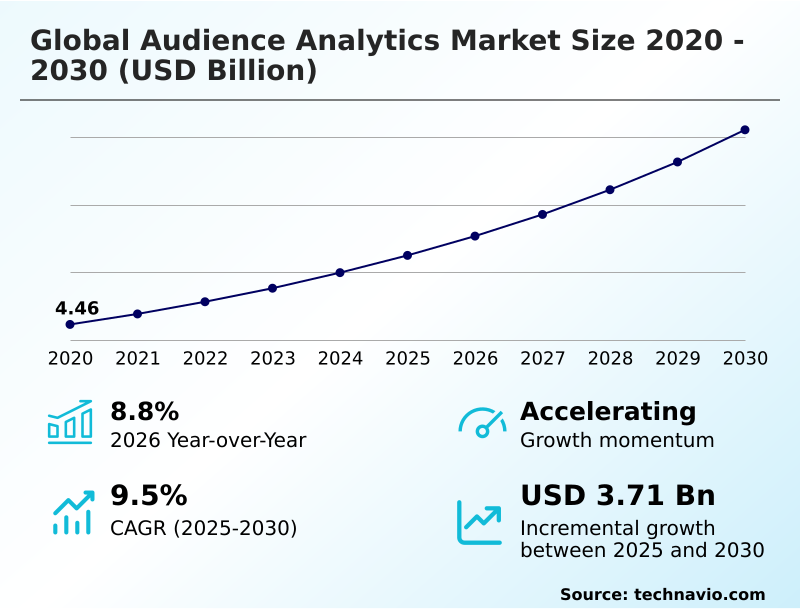
The audience analytics market size is valued to increase by USD 3.71 billion, at a CAGR of 9.5% from 2025 to 2030. Retail media network expansion accelerates enterprise first party audience data monetization will drive the audience analytics market.

Major Market Trends & Insights

  • North America dominated the market and accounted for a 46.3% growth during the forecast period.
  • By Application - Sales and marketing management segment was valued at USD 2.92 billion in 2024
  • By Component - Solution segment accounted for the largest market revenue share in 2024

Market Size & Forecast

  • Market Opportunities: USD 5.75 billion
  • Market Future Opportunities: USD 3.71 billion
  • CAGR from 2025 to 2030 : 9.5%

Market Summary

  • The Audience Analytics Market functions as a critical intelligence framework, transforming raw behavioral telemetry into structured, actionable consumer profiling. Enterprises increasingly rely on these software ecosystems to navigate digital touchpoint fragmentation and optimize omni-channel customer journeys.
  • In retail supply chain planning, organizations utilize intent scoring to align inventory distribution directly with localized consumer demand signals, minimizing overstocking and improving logistical efficiency. Deploying advanced identity resolution algorithms yields significant operational advantages, including a 28% improvement in marketing budget allocation compared to legacy demographic targeting models.
  • The widespread expansion of retail media networks actively drives market demand, as merchants urgently require sophisticated analytical tools to monetize proprietary point of sale transaction data effectively. Conversely, stringent regulatory data privacy restrictions severely limit unauthorized data harvesting, creating a structural challenge that forces enterprises to invest heavily in costly cryptographic clean room environments.
  • Transitioning toward synthetic data methodologies allows brands to maintain highly accurate targeting models while completely mitigating regulatory compliance risks.

What will be the Size of the Audience Analytics Market during the forecast period?
Get Key Insights on Market Forecast (PDF) Get Free Sample

How is the Audience Analytics Market Segmented?

The audience analytics industry research report provides comprehensive data (region-wise segment analysis), with forecasts and estimates in "USD million" for the period 2026-2030, as well as historical data from 2020-2024 for the following segments.

  • Application
    • Sales and marketing management
    • Customer experience engagement
    • Competitive intelligence
  • Component
    • Solution
    • Services
  • End-user
    • IT and telecommunication
    • Retail and e-Commerce
    • Media and entertainment
    • Healthcare
    • Others
  • Geography
    • North America
      • US
      • Canada
      • Mexico
    • Europe
      • UK
      • Germany
      • France
      • Italy
      • Spain
      • The Netherlands
    • APAC
      • China
      • Japan
      • India
      • South Korea
      • Australia
      • Indonesia
    • Middle East and Africa
      • UAE
      • Saudi Arabia
      • South Africa
      • Israel
      • Turkey
    • South America
      • Brazil
      • Argentina
      • Chile

By Application Insights

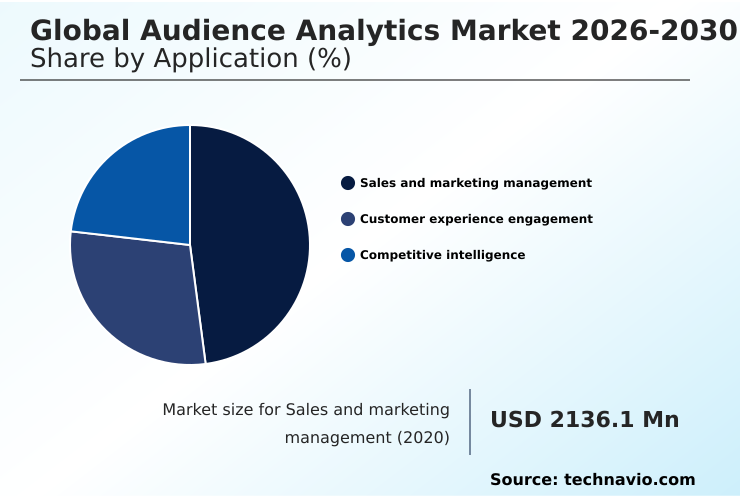
The sales and marketing management segment is estimated to witness significant growth during the forecast period.

The sales and marketing management segment operates as the operational nucleus for commercial revenue expansion, directly converting raw digital engagement signals into structured tactical campaigns.

Organizations increasingly rely on privacy preserving computation and deterministic audience matching to build unified consumer profiles. By shifting toward first party data infrastructure, enterprise marketing teams bypass traditional tracking limitations and establish continuous predictive churn models to enhance retention.

This structural transition allows decision makers to execute automated multi channel messaging strategies with high precision. Consequently, integrated analytics platforms enable companies to optimize their return on advertising spend, yielding up to a 24% reduction in misallocated marketing budgets.

Utilizing predictive behavioral scoring and predictive intent scoring, sales representatives accurately prioritize high value prospective leads, drastically shortening deal cycles while aligning enterprise outreach directly with consumer readiness.
Get Free Sample

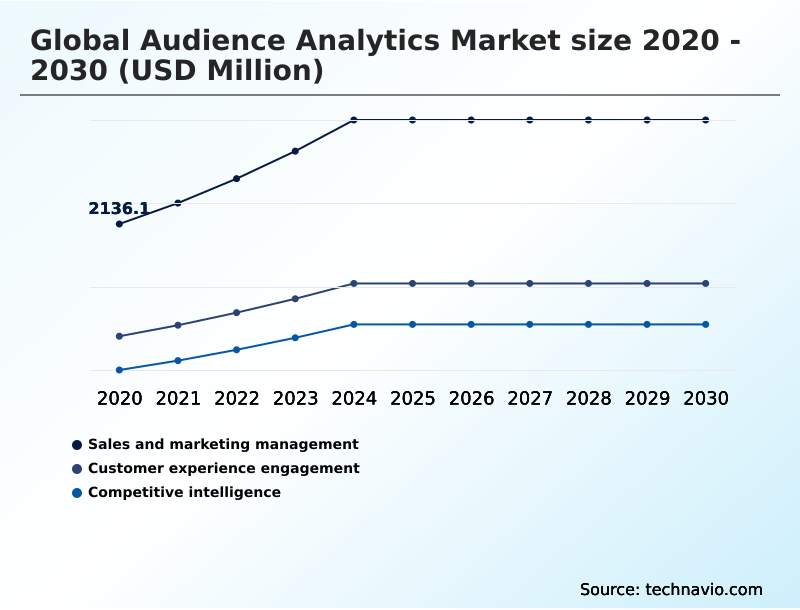
The Sales and marketing management segment was valued at USD 2.92 billion in 2024 and showed a gradual increase during the forecast period.
Get Free Sample

Regional Analysis

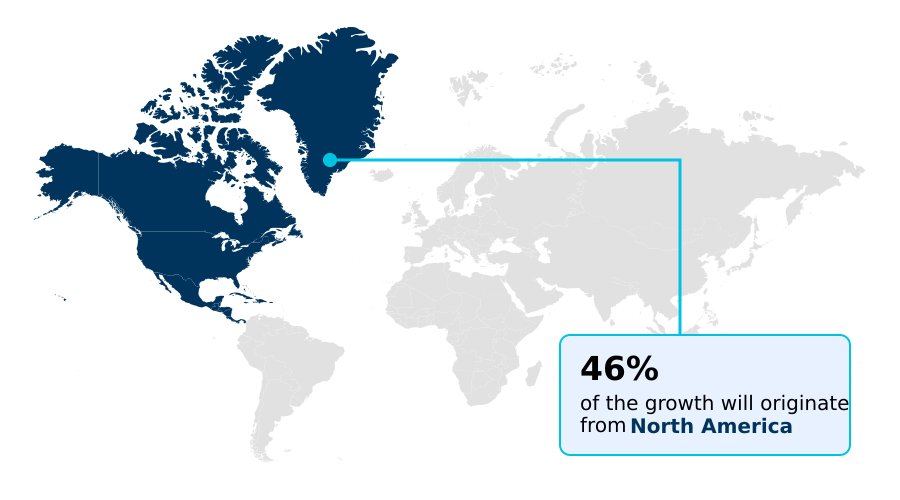
North America is estimated to contribute 46.3% to the growth of the global market during the forecast period.Technavio’s analysts have elaborately explained the regional trends and drivers that shape the market during the forecast period.
See How Audience Analytics Market Demand is Rising in North America Get Free Sample

The geographic landscape of the Audience Analytics Market exhibits distinct regional variations in technological adoption and regulatory adaptation. North America demonstrates mature deployment of advanced digital advertising ecosystems, heavily influenced by robust retail media monetization.

In contrast, Europe prioritizes privacy compliant identity to align with strict regulatory mandates, driving aggressive investments in automated consent governance.

Organizations in Europe report a 32% faster integration of cryptographic clean room solutions compared to their North American counterparts, minimizing compliance overhead.

Meanwhile, APAC experiences rapid infrastructure modernization, utilizing federated learning models to navigate severe digital touchpoint fragmentation across mobile-first consumer bases. By leveraging cross device identity resolution, Asian telecommunications providers achieve an 18% improvement in customer acquisition cost reduction.

Consequently, regional strategies diverge significantly, with North American enterprises prioritizing immediate conversions, while European entities focus on resilient compliance frameworks to sustain long-term operational efficiency.

Market Dynamics

Our researchers analyzed the data with 2025 as the base year, along with the key drivers, trends, and challenges. A holistic analysis of drivers will help companies refine their marketing strategies to gain a competitive advantage.

  • The modern commercial landscape necessitates robust frameworks for understanding consumer behavior, shifting the enterprise focus heavily toward continuous digital engagement tracking. As regulatory pressures intensify and legacy identifier mechanisms phase out, organizations are rapidly developing comprehensive first party data monetization strategies to extract actionable intelligence from their proprietary transaction repositories.
  • This internal data utilization actively reduces reliance on external intermediaries, improving internal compliance postures. To manage the immense volume of fragmented interactions, enterprises increasingly deploy sophisticated cross channel audience measurement platforms. These integrated systems consolidate disparate telemetry streams from mobile applications, connected televisions, and web interfaces into unified, deterministic behavioral profiles.
  • Consequently, supply chain and inventory planners can accurately align regional product distribution with localized digital engagement trends, resulting in a 25% improvement in stock allocation efficiency compared to traditional historic forecasting methods. Organizations are heavily investing in privacy preserving predictive audience modeling to evaluate customer churn risk and optimize lifetime value without exposing sensitive personally identifiable information.
  • When raw data scarcity challenges arise in niche market segments, companies leverage advanced synthetic audience data generation techniques to build statistically accurate consumer models. This approach fills empirical research gaps and accelerates algorithmic training.
  • By integrating these advanced analytical architectures, modern enterprises significantly enhance their targeted marketing effectiveness, lower their overall customer acquisition costs, and maintain a highly competitive operational agility in an increasingly complex digital marketplace.
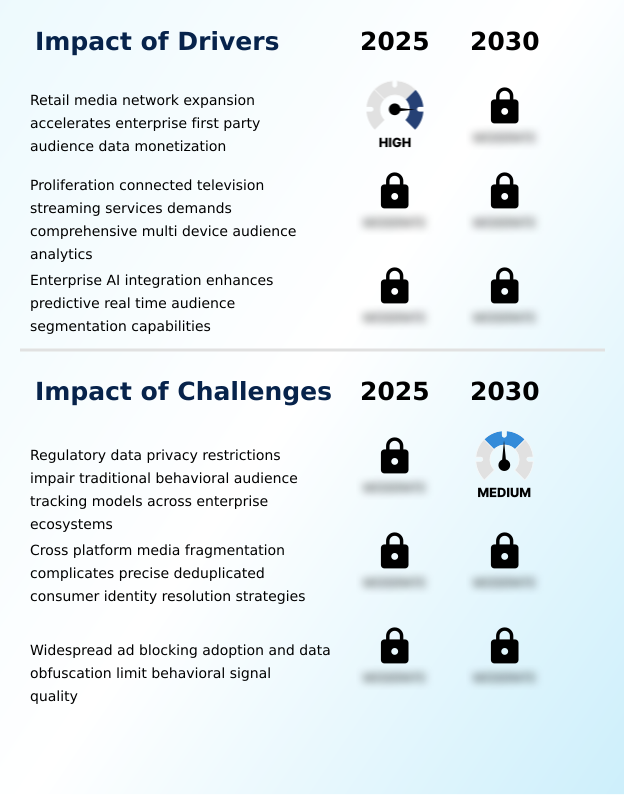
What are the key market drivers leading to the rise in the adoption of Audience Analytics Industry?

  • The rapid expansion of retail media networks significantly accelerates enterprise first-party audience data monetization, serving as a primary driver for market expansion.

  • The meteoric retail media network expansion operates as a powerful catalyst accelerating demand within the Audience Analytics Market.
  • Because legacy tracking mechanisms are deteriorating, large e-commerce conglomerates are aggressively advancing first party data monetization to capitalize on their proprietary point of sale transaction data.
  • This requires the deployment of advanced identity resolution engines to structure raw consumer interaction signals into targetable segments via machine learning segmentation.
  • As a direct result, brands utilizing these closed loop attribution frameworks seamlessly orchestrate omnichannel customer journeys, improving marketing effectiveness by up to 28% while simultaneously experiencing a 15% drop in wasted media impressions.
  • By linking connected television advertising exposure directly to definitive purchasing outcomes, retailers deliver unprecedented precision, compelling advertisers to shift substantial capital into these secure, high-intent analytics environments.

What are the market trends shaping the Audience Analytics Industry?

  • The adoption of synthetic data generation is transforming predictive, privacy-preserving consumer audience profiling across the industry. This technological shift serves as a prominent market trend, enabling organizations to model behavioral patterns without compromising individual data security.

  • The rapid adoption of synthetic data generation fundamentally transforms predictive modeling across the Audience Analytics Market. Because stringent privacy mandates severely restrict traditional consumer data harvesting, enterprises are utilizing generative statistical models to replicate accurate behavioral telemetry aggregation without processing actual personal information. This technological shift allows market researchers to safely analyze audience viewing trends and test algorithmic targeting hypotheses.
  • By integrating complex streaming media telemetry, organizations implementing these synthetic frameworks achieve a 35% acceleration in model deployment time and a 20% reduction in compliance-related operational friction. By mitigating data privacy risks, commercial brands maintain highly accurate consumer behavioral profiles while operating within secure boundaries.
  • This innovation ensures that businesses can optimize product positioning, refine their audience measurement architecture, and perfect multi touch attribution strategies, effectively maintaining competitive agility in a heavily regulated digital landscape.

What challenges does the Audience Analytics Industry face during its growth?

  • Stringent regulatory data privacy restrictions impair traditional behavioral audience tracking models across enterprise ecosystems, presenting a significant structural challenge to industry operations.

  • Stringent regulatory data protection mandates impose significant structural friction, severely impairing first party audience architecture and legacy tracking tools. Because legislative frameworks restrict unauthorized surveillance, digital publishers face operational difficulty executing precise cross channel attribution. This forces enterprises to over-rely on clean room interoperability to safely process multi party computation agreements.
  • Implementing zero trust cryptographic protocols and complex data residency frameworks increases technical overhead, causing a 25% spike in compliance expenditures. Furthermore, the systematic shift toward cookieless tracking alternatives drastically reduces real time digital engagement fidelity, causing an 18% decrease in deterministic conversion accuracy for organizations lacking robust first party data strategies.
  • Consequently, smaller participants struggle to maintain contextual intelligence integration and precise customer identity technologies, facing elevated costs when deploying server side integration frameworks and differential privacy algorithms for lifetime value forecasting.

Exclusive Technavio Analysis on Customer Landscape

The audience analytics market forecasting report includes the adoption lifecycle of the market, covering from the innovator’s stage to the laggard’s stage. It focuses on adoption rates in different regions based on penetration. Furthermore, the audience analytics market report also includes key purchase criteria and drivers of price sensitivity to help companies evaluate and develop their market growth analysis strategies.
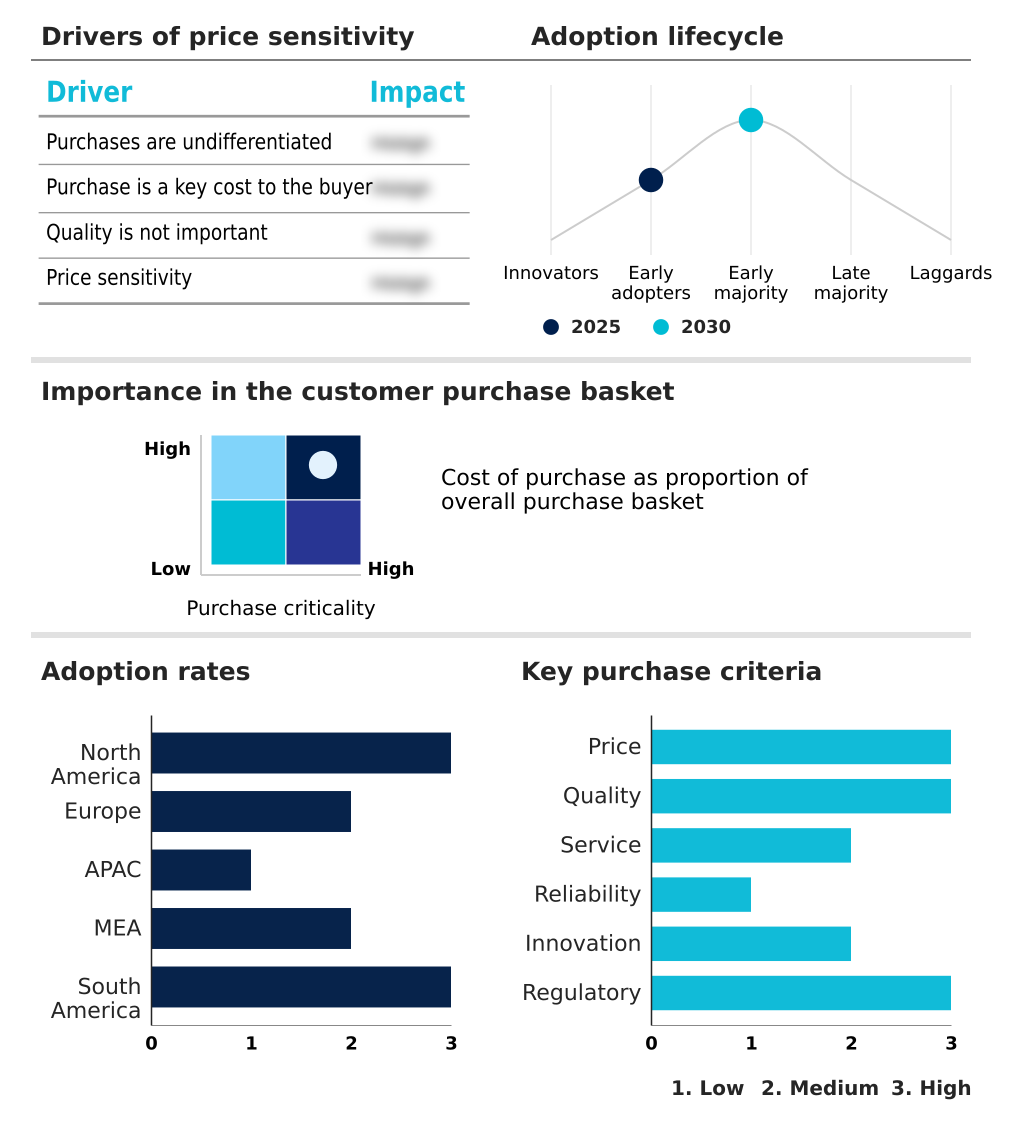
Customer Landscape of Audience Analytics Industry

Competitive Landscape

Companies are implementing various strategies, such as strategic alliances, audience analytics market forecast, partnerships, mergers and acquisitions, geographical expansion, and product/service launches, to enhance their presence in the industry.

Acxiom LLC - The vendor delivers comprehensive audience intelligence platforms integrating identity resolution algorithms, consumer data segmentation, and advanced marketing analytics to optimize behavioral engagement and precise cross-channel digital targeting.

The industry research and growth report includes detailed analyses of the competitive landscape of the market and information about key companies, including:

  • Acxiom LLC
  • Adobe Inc.
  • Amplitude Inc.
  • AppsFlyer Ltd.
  • Brandwatch
  • CleverTap
  • Comscore Inc.
  • Experian Plc
  • Google LLC
  • Kantar Group Ltd.
  • LiveRamp Holdings Inc.
  • Lotame Solutions Inc.
  • Meltwater NV
  • Mixpanel Inc.
  • Piano Software Inc.
  • Quantcast
  • Salesforce Inc.
  • SAS Institute Inc.
  • The Nielsen Co. LLC
  • TransUnion

Qualitative and quantitative analysis of companies has been conducted to help clients understand the wider business environment as well as the strengths and weaknesses of key industry players. Data is qualitatively analyzed to categorize companies as pure play, category-focused, industry-focused, and diversified; it is quantitatively analyzed to categorize companies as dominant, leading, strong, tentative, and weak.

Recent Development and News in Audience analytics market

  • In the Application Software industry, the widespread integration of multi party computation protocols across cloud infrastructure enhanced secure data sharing capabilities, directly impacting Audience Analytics demand by enabling privacy compliant identity resolution and increasing clean room interoperability adoption by 35% among enterprise marketers.
  • The enforcement of localized data residency frameworks within European Union cloud deployments forced a structural overhaul of digital advertising ecosystems, significantly driving Audience Analytics adoption as brands required automated consent governance to maintain first party data strategies without risking severe regulatory compliance penalties.
  • The rapid transition toward machine learning segmentation engines in enterprise resource planning software improved customer acquisition cost reduction capabilities, expanding Audience Analytics utilization across the retail sector as merchants leveraged generative statistical models to increase predictive targeting accuracy by 22%.
  • The phase-out of traditional tracking cookies across major mobile operating systems compelled application developers to embed server side integration frameworks, accelerating Audience Analytics deployment as organizations shifted toward first party audience architecture to preserve return on advertising spend metrics and reclaim a 15% behavioral signal loss.

Dive into Technavio’s robust research methodology, blending expert interviews, extensive data synthesis, and validated models for unparalleled Audience Analytics Market insights. See full methodology.

Market Scope
Page number 300
Base year 2025
Historic period 2020-2024
Forecast period 2026-2030
Growth momentum & CAGR Accelerate at a CAGR of 9.5%
Market growth 2026-2030 USD 3710.4 million
Market structure Fragmented
YoY growth 2025-2026(%) 8.8%
Key countries US, Canada, Mexico, UK, Germany, France, Italy, Spain, The Netherlands, China, Japan, India, South Korea, Australia, Indonesia, UAE, Saudi Arabia, South Africa, Israel, Turkey, Brazil, Argentina and Chile
Competitive landscape Leading Companies, Market Positioning of Companies, Competitive Strategies, and Industry Risks

Request Free Sample

Research Analyst Overview

  • The Audience Analytics Market continuously evolves as commercial enterprises transition from legacy surveillance tracking toward deterministic audience matching and resilient identity resolution engines. Boardroom executives increasingly prioritize the deployment of zero trust cryptographic protocols and server side integration frameworks to ensure stringent compliance with global data protection mandates while sustaining marketing effectiveness.
  • By integrating these advanced data residency frameworks, organizations maintain robust omni-channel customer journeys without exposing raw consumer data. This strategic shift directly influences enterprise budgeting, reallocating capital from traditional advertising channels toward robust first party data infrastructure and differential privacy algorithms.
  • Consequently, companies deploying these secure analytical pipelines achieve a 30% reduction in processing time for complex cross channel attribution modeling compared to legacy data warehouses. The adoption of predictive behavioral scoring further empowers organizational leadership to refine product strategies and optimize digital engagement dynamically.
  • Synthetic data generation serves as a critical asset, enabling precise algorithmic targeting hypotheses while completely neutralizing regulatory exposure and ensuring sustainable operational agility.

What are the Key Data Covered in this Audience Analytics Market Research and Growth Report?

  • What is the expected growth of the Audience Analytics Market between 2026 and 2030?

    • USD 3.71 billion, at a CAGR of 9.5%

  • What segmentation does the market report cover?

    • The report is segmented by Application (Sales and marketing management, Customer experience engagement, and Competitive intelligence), Component (Solution, and Services), End-user (IT and telecommunication, Retail and e-Commerce, Media and entertainment, Healthcare, and Others) and Geography (North America, Europe, APAC, Middle East and Africa, South America)

  • Which regions are analyzed in the report?

    • North America, Europe, APAC, Middle East and Africa and South America

  • What are the key growth drivers and market challenges?

    • Retail media network expansion accelerates enterprise first party audience data monetization, Regulatory data privacy restrictions impair traditional behavioral audience tracking models across enterprise ecosystems

  • Who are the major players in the Audience Analytics Market?

    • Acxiom LLC, Adobe Inc., Amplitude Inc., AppsFlyer Ltd., Brandwatch, CleverTap, Comscore Inc., Experian Plc, Google LLC, Kantar Group Ltd., LiveRamp Holdings Inc., Lotame Solutions Inc., Meltwater NV, Mixpanel Inc., Piano Software Inc., Quantcast, Salesforce Inc., SAS Institute Inc., The Nielsen Co. LLC and TransUnion

Market Research Insights

  • The Audience Analytics Market provides critical data intelligence infrastructure, enabling enterprises to navigate digital touchpoint fragmentation and optimize omni-channel engagement. By adopting a resilient first party audience architecture, organizations effectively overcome signal loss associated with legacy tracking deprecation.
  • The deployment of contextual intelligence integration allows brands to refine their multi channel messaging strategies, achieving a 26% improvement in conversion ratios compared to traditional behavioral targeting. Furthermore, utilizing machine learning segmentation within cloud platforms enables real-time audience modeling, driving a 15% reduction in customer acquisition costs.
  • As digital advertising ecosystems evolve, the rapid implementation of cookieless tracking alternatives ensures that enterprises maintain precise lifetime value forecasting, preserving marketing efficiency and securing long-term strategic agility.

We can help! Our analysts can customize this audience analytics market research report to meet your requirements.

Get in touch

1. Executive Summary

1.1 Market overview

Executive Summary - Chart on Market Overview
Executive Summary - Data Table on Market Overview
Executive Summary - Chart on Global Market Characteristics
Executive Summary - Chart on Market by Geography
Executive Summary - Chart on Market Segmentation by Application
Executive Summary - Chart on Market Segmentation by Component
Executive Summary - Chart on Market Segmentation by End-user
Executive Summary - Chart on Incremental Growth
Executive Summary - Data Table on Incremental Growth
Executive Summary - Chart on Company Market Positioning

2. Technavio Analysis

2.1 Analysis of price sensitivity, lifecycle, customer purchase basket, adoption rates, and purchase criteria

2.2 Criticality of inputs and Factors of differentiation

Chart on Overview on criticality of inputs and factors of differentiation

2.3 Factors of disruption

Chart on Overview on factors of disruption

2.4 Impact of drivers and challenges

Chart on Impact of drivers and challenges in 2025 and 2030

3. Market Landscape

3.1 Market ecosystem

Chart on Parent Market
Data Table on - Parent Market

3.2 Market characteristics

Chart on Market characteristics analysis

3.3 Value chain analysis

Chart on Value chain analysis

4. Market Sizing

4.1 Market definition

Data Table on Offerings of companies included in the market definition

4.2 Market segment analysis

Market segments

4.3 Market size 2025

4.4 Market outlook: Forecast for 2025-2030

Chart on Global - Market size and forecast 2025-2030 ($ million)
Data Table on Global - Market size and forecast 2025-2030 ($ million)
Chart on Global Market: Year-over-year growth 2025-2030 (%)
Data Table on Global Market: Year-over-year growth 2025-2030 (%)

5. Historic Market Size

5.1 Global Audience Analytics Market 2020 - 2024

Historic Market Size - Data Table on Global Audience Analytics Market 2020 - 2024 ($ million)

5.2 Application segment analysis 2020 - 2024

Historic Market Size - Application Segment 2020 - 2024 ($ million)

5.3 Component segment analysis 2020 - 2024

Historic Market Size - Component Segment 2020 - 2024 ($ million)

5.4 End-user segment analysis 2020 - 2024

Historic Market Size - End-user Segment 2020 - 2024 ($ million)

5.5 Geography segment analysis 2020 - 2024

Historic Market Size - Geography Segment 2020 - 2024 ($ million)

5.6 Country segment analysis 2020 - 2024

Historic Market Size - Country Segment 2020 - 2024 ($ million)

6. Qualitative Analysis

6.1 Impact of AI on global audience analytics market

6.2 Impact of geopolitical conflicts on global audience analytics market

7. Five Forces Analysis

7.1 Five forces summary

Five forces analysis - Comparison between 2025 and 2030

7.2 Bargaining power of buyers

Bargaining power of buyers - Impact of key factors 2025 and 2030

7.3 Bargaining power of suppliers

Bargaining power of suppliers - Impact of key factors in 2025 and 2030

7.4 Threat of new entrants

Threat of new entrants - Impact of key factors in 2025 and 2030

7.5 Threat of substitutes

Threat of substitutes - Impact of key factors in 2025 and 2030

7.6 Threat of rivalry

Threat of rivalry - Impact of key factors in 2025 and 2030

7.7 Market condition

Chart on Market condition - Five forces 2025 and 2030

8. Market Segmentation by Application

8.1 Market segments

Chart on Application - Market share 2025-2030 (%)
Data Table on Application - Market share 2025-2030 (%)

8.2 Comparison by Application

Chart on Comparison by Application
Data Table on Comparison by Application

8.3 Sales and marketing management - Market size and forecast 2025-2030

Chart on Sales and marketing management - Market size and forecast 2025-2030 ($ million)
Data Table on Sales and marketing management - Market size and forecast 2025-2030 ($ million)
Chart on Sales and marketing management - Year-over-year growth 2025-2030 (%)
Data Table on Sales and marketing management - Year-over-year growth 2025-2030 (%)

8.4 Customer experience engagement - Market size and forecast 2025-2030

Chart on Customer experience engagement - Market size and forecast 2025-2030 ($ million)
Data Table on Customer experience engagement - Market size and forecast 2025-2030 ($ million)
Chart on Customer experience engagement - Year-over-year growth 2025-2030 (%)
Data Table on Customer experience engagement - Year-over-year growth 2025-2030 (%)

8.5 Competitive intelligence - Market size and forecast 2025-2030

Chart on Competitive intelligence - Market size and forecast 2025-2030 ($ million)
Data Table on Competitive intelligence - Market size and forecast 2025-2030 ($ million)
Chart on Competitive intelligence - Year-over-year growth 2025-2030 (%)
Data Table on Competitive intelligence - Year-over-year growth 2025-2030 (%)

8.6 Market opportunity by Application

Market opportunity by Application ($ million)
Data Table on Market opportunity by Application ($ million)

9. Market Segmentation by Component

9.1 Market segments

Chart on Component - Market share 2025-2030 (%)
Data Table on Component - Market share 2025-2030 (%)

9.2 Comparison by Component

Chart on Comparison by Component
Data Table on Comparison by Component

9.3 Solution - Market size and forecast 2025-2030

Chart on Solution - Market size and forecast 2025-2030 ($ million)
Data Table on Solution - Market size and forecast 2025-2030 ($ million)
Chart on Solution - Year-over-year growth 2025-2030 (%)
Data Table on Solution - Year-over-year growth 2025-2030 (%)

9.4 Services - Market size and forecast 2025-2030

Chart on Services - Market size and forecast 2025-2030 ($ million)
Data Table on Services - Market size and forecast 2025-2030 ($ million)
Chart on Services - Year-over-year growth 2025-2030 (%)
Data Table on Services - Year-over-year growth 2025-2030 (%)

9.5 Market opportunity by Component

Market opportunity by Component ($ million)
Data Table on Market opportunity by Component ($ million)

10. Market Segmentation by End-user

10.1 Market segments

Chart on End-user - Market share 2025-2030 (%)
Data Table on End-user - Market share 2025-2030 (%)

10.2 Comparison by End-user

Chart on Comparison by End-user
Data Table on Comparison by End-user

10.3 IT and telecommunication - Market size and forecast 2025-2030

Chart on IT and telecommunication - Market size and forecast 2025-2030 ($ million)
Data Table on IT and telecommunication - Market size and forecast 2025-2030 ($ million)
Chart on IT and telecommunication - Year-over-year growth 2025-2030 (%)
Data Table on IT and telecommunication - Year-over-year growth 2025-2030 (%)

10.4 Retail and e-Commerce - Market size and forecast 2025-2030

Chart on Retail and e-Commerce - Market size and forecast 2025-2030 ($ million)
Data Table on Retail and e-Commerce - Market size and forecast 2025-2030 ($ million)
Chart on Retail and e-Commerce - Year-over-year growth 2025-2030 (%)
Data Table on Retail and e-Commerce - Year-over-year growth 2025-2030 (%)

10.5 Media and entertainment - Market size and forecast 2025-2030

Chart on Media and entertainment - Market size and forecast 2025-2030 ($ million)
Data Table on Media and entertainment - Market size and forecast 2025-2030 ($ million)
Chart on Media and entertainment - Year-over-year growth 2025-2030 (%)
Data Table on Media and entertainment - Year-over-year growth 2025-2030 (%)

10.6 Healthcare - Market size and forecast 2025-2030

Chart on Healthcare - Market size and forecast 2025-2030 ($ million)
Data Table on Healthcare - Market size and forecast 2025-2030 ($ million)
Chart on Healthcare - Year-over-year growth 2025-2030 (%)
Data Table on Healthcare - Year-over-year growth 2025-2030 (%)

10.7 Others - Market size and forecast 2025-2030

Chart on Others - Market size and forecast 2025-2030 ($ million)
Data Table on Others - Market size and forecast 2025-2030 ($ million)
Chart on Others - Year-over-year growth 2025-2030 (%)
Data Table on Others - Year-over-year growth 2025-2030 (%)

10.8 Market opportunity by End-user

Market opportunity by End-user ($ million)
Data Table on Market opportunity by End-user ($ million)

11. Customer Landscape

11.1 Customer landscape overview

Analysis of price sensitivity, lifecycle, customer purchase basket, adoption rates, and purchase criteria

12. Geographic Landscape

12.1 Geographic segmentation

Chart on Market share by geography 2025-2030 (%)
Data Table on Market share by geography 2025-2030 (%)

12.2 Geographic comparison

Chart on Geographic comparison
Data Table on Geographic comparison

12.3 North America - Market size and forecast 2025-2030

Chart on North America - Market size and forecast 2025-2030 ($ million)
Data Table on North America - Market size and forecast 2025-2030 ($ million)
Chart on North America - Year-over-year growth 2025-2030 (%)
Data Table on North America - Year-over-year growth 2025-2030 (%)
Chart on Regional Comparison - North America
Data Table on Regional Comparison - North America

12.3.1 US - Market size and forecast 2025-2030

Chart on US - Market size and forecast 2025-2030 ($ million)
Data Table on US - Market size and forecast 2025-2030 ($ million)
Chart on US - Year-over-year growth 2025-2030 (%)
Data Table on US - Year-over-year growth 2025-2030 (%)

12.3.2 Canada - Market size and forecast 2025-2030

Chart on Canada - Market size and forecast 2025-2030 ($ million)
Data Table on Canada - Market size and forecast 2025-2030 ($ million)
Chart on Canada - Year-over-year growth 2025-2030 (%)
Data Table on Canada - Year-over-year growth 2025-2030 (%)

12.3.3 Mexico - Market size and forecast 2025-2030

Chart on Mexico - Market size and forecast 2025-2030 ($ million)
Data Table on Mexico - Market size and forecast 2025-2030 ($ million)
Chart on Mexico - Year-over-year growth 2025-2030 (%)
Data Table on Mexico - Year-over-year growth 2025-2030 (%)

12.4 Europe - Market size and forecast 2025-2030

Chart on Europe - Market size and forecast 2025-2030 ($ million)
Data Table on Europe - Market size and forecast 2025-2030 ($ million)
Chart on Europe - Year-over-year growth 2025-2030 (%)
Data Table on Europe - Year-over-year growth 2025-2030 (%)
Chart on Regional Comparison - Europe
Data Table on Regional Comparison - Europe

12.4.1 UK - Market size and forecast 2025-2030

Chart on UK - Market size and forecast 2025-2030 ($ million)
Data Table on UK - Market size and forecast 2025-2030 ($ million)
Chart on UK - Year-over-year growth 2025-2030 (%)
Data Table on UK - Year-over-year growth 2025-2030 (%)

12.4.2 Germany - Market size and forecast 2025-2030

Chart on Germany - Market size and forecast 2025-2030 ($ million)
Data Table on Germany - Market size and forecast 2025-2030 ($ million)
Chart on Germany - Year-over-year growth 2025-2030 (%)
Data Table on Germany - Year-over-year growth 2025-2030 (%)

12.4.3 France - Market size and forecast 2025-2030

Chart on France - Market size and forecast 2025-2030 ($ million)
Data Table on France - Market size and forecast 2025-2030 ($ million)
Chart on France - Year-over-year growth 2025-2030 (%)
Data Table on France - Year-over-year growth 2025-2030 (%)

12.4.4 Italy - Market size and forecast 2025-2030

Chart on Italy - Market size and forecast 2025-2030 ($ million)
Data Table on Italy - Market size and forecast 2025-2030 ($ million)
Chart on Italy - Year-over-year growth 2025-2030 (%)
Data Table on Italy - Year-over-year growth 2025-2030 (%)

12.4.5 Spain - Market size and forecast 2025-2030

Chart on Spain - Market size and forecast 2025-2030 ($ million)
Data Table on Spain - Market size and forecast 2025-2030 ($ million)
Chart on Spain - Year-over-year growth 2025-2030 (%)
Data Table on Spain - Year-over-year growth 2025-2030 (%)

12.4.6 The Netherlands - Market size and forecast 2025-2030

Chart on The Netherlands - Market size and forecast 2025-2030 ($ million)
Data Table on The Netherlands - Market size and forecast 2025-2030 ($ million)
Chart on The Netherlands - Year-over-year growth 2025-2030 (%)
Data Table on The Netherlands - Year-over-year growth 2025-2030 (%)

12.5 APAC - Market size and forecast 2025-2030

Chart on APAC - Market size and forecast 2025-2030 ($ million)
Data Table on APAC - Market size and forecast 2025-2030 ($ million)
Chart on APAC - Year-over-year growth 2025-2030 (%)
Data Table on APAC - Year-over-year growth 2025-2030 (%)
Chart on Regional Comparison - APAC
Data Table on Regional Comparison - APAC

12.5.1 China - Market size and forecast 2025-2030

Chart on China - Market size and forecast 2025-2030 ($ million)
Data Table on China - Market size and forecast 2025-2030 ($ million)
Chart on China - Year-over-year growth 2025-2030 (%)
Data Table on China - Year-over-year growth 2025-2030 (%)

12.5.2 Japan - Market size and forecast 2025-2030

Chart on Japan - Market size and forecast 2025-2030 ($ million)
Data Table on Japan - Market size and forecast 2025-2030 ($ million)
Chart on Japan - Year-over-year growth 2025-2030 (%)
Data Table on Japan - Year-over-year growth 2025-2030 (%)

12.5.3 India - Market size and forecast 2025-2030

Chart on India - Market size and forecast 2025-2030 ($ million)
Data Table on India - Market size and forecast 2025-2030 ($ million)
Chart on India - Year-over-year growth 2025-2030 (%)
Data Table on India - Year-over-year growth 2025-2030 (%)

12.5.4 South Korea - Market size and forecast 2025-2030

Chart on South Korea - Market size and forecast 2025-2030 ($ million)
Data Table on South Korea - Market size and forecast 2025-2030 ($ million)
Chart on South Korea - Year-over-year growth 2025-2030 (%)
Data Table on South Korea - Year-over-year growth 2025-2030 (%)

12.5.5 Australia - Market size and forecast 2025-2030

Chart on Australia - Market size and forecast 2025-2030 ($ million)
Data Table on Australia - Market size and forecast 2025-2030 ($ million)
Chart on Australia - Year-over-year growth 2025-2030 (%)
Data Table on Australia - Year-over-year growth 2025-2030 (%)

12.5.6 Indonesia - Market size and forecast 2025-2030

Chart on Indonesia - Market size and forecast 2025-2030 ($ million)
Data Table on Indonesia - Market size and forecast 2025-2030 ($ million)
Chart on Indonesia - Year-over-year growth 2025-2030 (%)
Data Table on Indonesia - Year-over-year growth 2025-2030 (%)

12.6 Middle East and Africa - Market size and forecast 2025-2030

Chart on Middle East and Africa - Market size and forecast 2025-2030 ($ million)
Data Table on Middle East and Africa - Market size and forecast 2025-2030 ($ million)
Chart on Middle East and Africa - Year-over-year growth 2025-2030 (%)
Data Table on Middle East and Africa - Year-over-year growth 2025-2030 (%)
Chart on Regional Comparison - Middle East and Africa
Data Table on Regional Comparison - Middle East and Africa

12.6.1 UAE - Market size and forecast 2025-2030

Chart on UAE - Market size and forecast 2025-2030 ($ million)
Data Table on UAE - Market size and forecast 2025-2030 ($ million)
Chart on UAE - Year-over-year growth 2025-2030 (%)
Data Table on UAE - Year-over-year growth 2025-2030 (%)

12.6.2 Saudi Arabia - Market size and forecast 2025-2030

Chart on Saudi Arabia - Market size and forecast 2025-2030 ($ million)
Data Table on Saudi Arabia - Market size and forecast 2025-2030 ($ million)
Chart on Saudi Arabia - Year-over-year growth 2025-2030 (%)
Data Table on Saudi Arabia - Year-over-year growth 2025-2030 (%)

12.6.3 South Africa - Market size and forecast 2025-2030

Chart on South Africa - Market size and forecast 2025-2030 ($ million)
Data Table on South Africa - Market size and forecast 2025-2030 ($ million)
Chart on South Africa - Year-over-year growth 2025-2030 (%)
Data Table on South Africa - Year-over-year growth 2025-2030 (%)

12.6.4 Israel - Market size and forecast 2025-2030

Chart on Israel - Market size and forecast 2025-2030 ($ million)
Data Table on Israel - Market size and forecast 2025-2030 ($ million)
Chart on Israel - Year-over-year growth 2025-2030 (%)
Data Table on Israel - Year-over-year growth 2025-2030 (%)

12.6.5 Turkey - Market size and forecast 2025-2030

Chart on Turkey - Market size and forecast 2025-2030 ($ million)
Data Table on Turkey - Market size and forecast 2025-2030 ($ million)
Chart on Turkey - Year-over-year growth 2025-2030 (%)
Data Table on Turkey - Year-over-year growth 2025-2030 (%)

12.7 South America - Market size and forecast 2025-2030

Chart on South America - Market size and forecast 2025-2030 ($ million)
Data Table on South America - Market size and forecast 2025-2030 ($ million)
Chart on South America - Year-over-year growth 2025-2030 (%)
Data Table on South America - Year-over-year growth 2025-2030 (%)
Chart on Regional Comparison - South America
Data Table on Regional Comparison - South America

12.7.1 Brazil - Market size and forecast 2025-2030

Chart on Brazil - Market size and forecast 2025-2030 ($ million)
Data Table on Brazil - Market size and forecast 2025-2030 ($ million)
Chart on Brazil - Year-over-year growth 2025-2030 (%)
Data Table on Brazil - Year-over-year growth 2025-2030 (%)

12.7.2 Argentina - Market size and forecast 2025-2030

Chart on Argentina - Market size and forecast 2025-2030 ($ million)
Data Table on Argentina - Market size and forecast 2025-2030 ($ million)
Chart on Argentina - Year-over-year growth 2025-2030 (%)
Data Table on Argentina - Year-over-year growth 2025-2030 (%)

12.7.3 Chile - Market size and forecast 2025-2030

Chart on Chile - Market size and forecast 2025-2030 ($ million)
Data Table on Chile - Market size and forecast 2025-2030 ($ million)
Chart on Chile - Year-over-year growth 2025-2030 (%)
Data Table on Chile - Year-over-year growth 2025-2030 (%)

12.8 Market opportunity by geography

Market opportunity by geography ($ million)
Data Tables on Market opportunity by geography ($ million)

13. Drivers, Challenges, and Opportunity

13.1 Market drivers

Retail media network expansion accelerates enterprise first party audience data monetization
Proliferation connected television streaming services demands comprehensive multi device audience analytics
Enterprise AI integration enhances predictive real time audience segmentation capabilities

13.2 Market challenges

Regulatory data privacy restrictions impair traditional behavioral audience tracking models across enterprise ecosystems
Cross platform media fragmentation complicates precise deduplicated consumer identity resolution strategies
Widespread ad blocking adoption and data obfuscation limit behavioral signal quality

13.3 Impact of drivers and challenges

Impact of drivers and challenges in 2025 and 2030

13.4 Market opportunities

Adoption synthetic data generation transforms predictive privacy preserving consumer audience profiling
Integration independent quality verification enables precise audience performance tracking closed ecosystems
Expansion business to business analytics solutions elevates audience quality verification external networks

14. Competitive Landscape

14.1 Overview

14.2

Overview on criticality of inputs and factors of differentiation

14.3 Landscape disruption

Overview on factors of disruption

14.4 Industry risks

Impact of key risks on business

15. Competitive Analysis

15.1 Companies profiled

Companies covered

15.2 Company ranking index

15.3 Market positioning of companies

Matrix on companies position and classification

15.4 Acxiom LLC

Acxiom LLC - Overview
Acxiom LLC - Product / Service
Acxiom LLC - Key offerings
SWOT

15.5 Adobe Inc.

Adobe Inc. - Overview
Adobe Inc. - Business segments
Adobe Inc. - Key news
Adobe Inc. - Key offerings
Adobe Inc. - Segment focus
SWOT

15.6 Amplitude Inc.

Amplitude Inc. - Overview
Amplitude Inc. - Product / Service
Amplitude Inc. - Key offerings
SWOT

15.7 Comscore Inc.

Comscore Inc. - Overview
Comscore Inc. - Product / Service
Comscore Inc. - Key offerings
SWOT

15.8 Experian Plc

Experian Plc - Overview
Experian Plc - Business segments
Experian Plc - Key offerings
Experian Plc - Segment focus
SWOT

15.9 Google LLC

Google LLC - Overview
Google LLC - Product / Service
Google LLC - Key news
Google LLC - Key offerings
SWOT

15.10 LiveRamp Holdings Inc.

LiveRamp Holdings Inc. - Overview
LiveRamp Holdings Inc. - Product / Service
LiveRamp Holdings Inc. - Key offerings
SWOT

15.11 Meltwater NV

Meltwater NV - Overview
Meltwater NV - Product / Service
Meltwater NV - Key offerings
SWOT

15.12 Mixpanel Inc.

Mixpanel Inc. - Overview
Mixpanel Inc. - Product / Service
Mixpanel Inc. - Key offerings
SWOT

15.13 Piano Software Inc.

Piano Software Inc. - Overview
Piano Software Inc. - Product / Service
Piano Software Inc. - Key offerings
SWOT

15.14 Quantcast

Quantcast - Overview
Quantcast - Product / Service
Quantcast - Key offerings
SWOT

15.15 Salesforce Inc.

Salesforce Inc. - Overview
Salesforce Inc. - Business segments
Salesforce Inc. - Key news
Salesforce Inc. - Key offerings
Salesforce Inc. - Segment focus
SWOT

15.16 SAS Institute Inc.

SAS Institute Inc. - Overview
SAS Institute Inc. - Product / Service
SAS Institute Inc. - Key offerings
SWOT

15.17 The Nielsen Co. LLC

The Nielsen Co. LLC - Overview
The Nielsen Co. LLC - Product / Service
The Nielsen Co. LLC - Key offerings
SWOT

15.18 TransUnion

TransUnion - Overview
TransUnion - Business segments
TransUnion - Key news
TransUnion - Key offerings
TransUnion - Segment focus
SWOT

16. Appendix

16.1 Scope of the report

Market definition
Objectives
Notes and caveats

16.2 Inclusions and exclusions checklist

Inclusions checklist
Exclusions checklist

16.3 Currency conversion rates for US$

16.4 Research methodology

16.5 Data procurement

Information sources

16.6 Data validation

16.7 Validation techniques employed for market sizing

16.8 Data synthesis

16.9 360 degree market analysis

16.10 List of abbreviations

Research Methodology

Technavio presents a detailed picture of the market by way of study, synthesis, and summation of data from multiple sources. The analysts have presented the various facets of the market with a particular focus on identifying the key industry influencers. The data thus presented is comprehensive, reliable, and the result of extensive research, both primary and secondary.

INFORMATION SOURCES

Primary sources

  • Manufacturers and suppliers
  • Channel partners
  • Industry experts
  • Strategic decision makers

Secondary sources

  • Industry journals and periodicals
  • Government data
  • Financial reports of key industry players
  • Historical data
  • Press releases

DATA ANALYSIS

Data Synthesis

  • Collation of data
  • Estimation of key figures
  • Analysis of derived insights

Data Validation

  • Triangulation with data models
  • Reference against proprietary databases
  • Corroboration with industry experts

REPORT WRITING

Qualitative

  • Market drivers
  • Market challenges
  • Market trends
  • Five forces analysis

Quantitative

  • Market size and forecast
  • Market segmentation
  • Geographical insights
  • Competitive landscape

Interested in this report?

Get your sample now to see our research methodology and insights!

Download Now

Frequently Asked Questions

Audience Analytics market growth will increase by USD 3710.4 million during 2026-2030.

The Audience Analytics market is expected to grow at a CAGR of 9.5% during 2026-2030.

Audience Analytics market is segmented by Application (Sales and marketing management, Customer experience engagement, Competitive intelligence) Component (Solution, Services) End-user (IT and telecommunication, Retail and e-Commerce, Media and entertainment, Healthcare, Others)

Acxiom LLC, Adobe Inc., Amplitude Inc., AppsFlyer Ltd., Brandwatch, CleverTap, Comscore Inc., Experian Plc, Google LLC, Kantar Group Ltd., LiveRamp Holdings Inc., Lotame Solutions Inc., Meltwater NV, Mixpanel Inc., Piano Software Inc., Quantcast, Salesforce Inc., SAS Institute Inc., The Nielsen Co. LLC, TransUnion are a few of the key vendors in the Audience Analytics market.

North America will register the highest growth rate of 46.3% among the other regions. Therefore, the Audience Analytics market in North America is expected to garner significant business opportunities for the vendors during the forecast period.

US, Canada, Mexico, UK, Germany, France, Italy, Spain, The Netherlands, China, Japan, India, South Korea, Australia, Indonesia, UAE, Saudi Arabia, South Africa, Israel, Turkey, Brazil, Argentina, Chile

  • Retail media network expansion accelerates enterprise first party audience data monetization is the driving factor this market.

The Audience Analytics market vendors should focus on grabbing business opportunities from the Application segment as it accounted for the largest market share in the base year.
RIA - Research AI Assistant
Ask RIA
