Augmented Reality In Retail Market Size 2024-2028
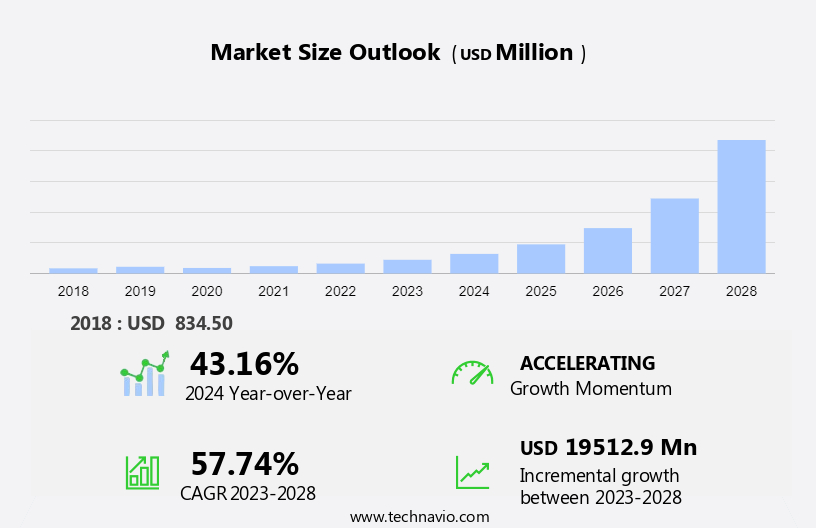
The augmented reality in retail market size is forecast to increase by USD 19.51 billion at a CAGR of 57.74% between 2023 and 2028. Augmented Reality (AR) is revolutionizing the retail industry by offering great shopping experiences. AR technology is increasingly being used for planning and designing, with applications ranging from information systems in jewelry and beauty and cosmetics to apparel fitting and footwear segments. AR is transforming furniture and lighting shopping by enabling customers to visualize products in their homes before purchasing. In the grocery shopping sector, AR is used for inventory management and product information. The footwear segment, particularly the Jewelry segment, is witnessing significant growth due to AR's ability to provide accurate measurements and customized designs. However, challenges such as privacy and security concerns, the need for LiDAR technology, and language translation for international markets may hinder market growth.
The growing use of smartphones and tablets is fueling the adoption of AR in online shopping, making it an essential tool for retailers to stay competitive.
Augmented Reality (AR) is revolutionizing the retail sector by merging digital objects with the real world, offering a great shopping experience. Customers can use viewing devices like phones, tablets, or AR glasses to interact with virtual elements in real-time. Digital technology is transforming physical stores into interactive spaces, allowing retailers to provide customers with visual and auditory information. The retail industry, including furniture retailers, is embracing AR to cater to younger customers who prefer online shopping. With smartphone penetration and internet penetration on the rise, connected devices are becoming the new norm. AR is being used for advertising, virtual fitting rooms, and visualizing software, enhancing the customer experience and reducing returns rates.
IoT spending on AR is expected to increase, offering opportunities for retailers to create unique shopping experiences. Online conversion rates are also expected to improve as AR provides a more engaging and interactive shopping experience.
Market Segmentation
The market research report provides comprehensive data (region-wise segment analysis), with forecasts and estimates in "USD billion" for the period 2024-2028, as well as historical data from 2018-2022 for the following segments.
- Type
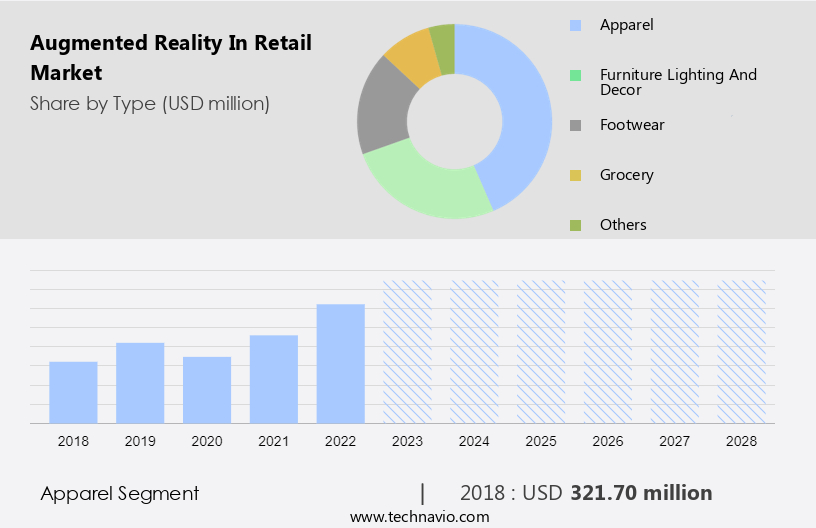
- Apparel
- Furniture lighting and decor
- Footwear
- Grocery
- Others
- Geography
- North America
- Canada
- US
- Europe
- Germany
- UK
- APAC
- China
- South America
- Middle East and Africa
- North America
By Type Insights
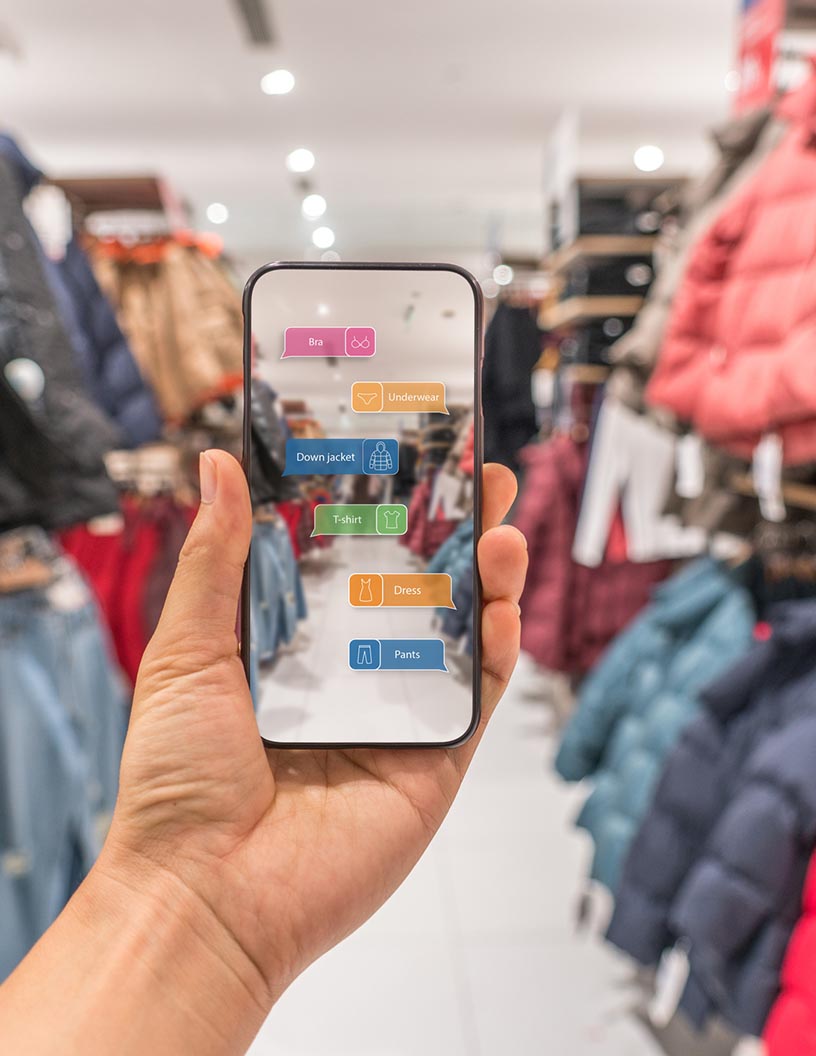
The apparel segment is estimated to witness significant growth during the forecast period. The market has witnessed significant growth, particularly in the apparel segment, due to the increasing adoption of advanced technology applications among consumers and the trend towards fashion clothing with intricate designs. AR technology is transforming retail by enabling interactive branding and marketing experiences for consumers, whether at home on their smartphones or in-store using handheld devices or smart AR mirrors. This technology allows for virtual try-on solutions, enhancing the shopping experience and driving sales. The use of AR is not limited to mobile devices, as head-mounted displays are also gaining popularity in certain applications. While the benefits of AR in retail are numerous, privacy and security concerns remain, necessitating the development of hardware and software solutions and services to address these issues.
Get a glance at the market share of various segments Request Free Sample
The apparel segment was valued at USD 321.70 million in 2018 and showed a gradual increase during the forecast period.
Regional Insights
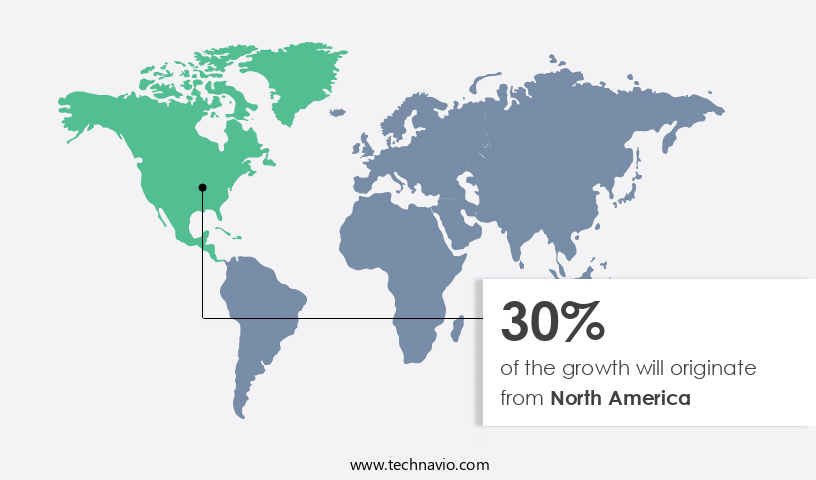
North America is estimated to contribute 30% to the growth of the global market during the forecast period. Technavio's analysts have elaborately explained the regional trends and drivers that shape the market during the forecast period.
For more insights on the market share of various regions Request Free Sample
Our researchers analyzed the data with 2023 as the base year, along with the key drivers, trends, and challenges. A holistic analysis of drivers will help companies refine their marketing strategies to gain a competitive advantage.
Market Driver
The use of AR technology to make advertising more effective is the key driver of the market. Augmented Reality (AR) technology is revolutionizing the retail sector by merging digital objects with the real world. Utilizing a viewing device such as a phone or tablet, or AR glasses, consumers can interact with digital content overlaid on physical items in real-time. This innovative technology offers a more engaging shopping experience, providing customers with visual and sensory information that goes beyond traditional product descriptions. AR advertisements cater to individual preferences and requirements, creating a highly environment that can drive sales. By simply pointing a smartphone at a product, customers can access detailed information, enhancing their purchasing decision-making process. The integration of AR technology in retail is expected to significantly grow during the forecast period, as it offers a unique blend of digital technology and the real world.
Market Trends
Growing smartphones and tablets will fuel growth of AR in retail industry is the upcoming trend in the market. Augmented Reality (AR) technology is revolutionizing the retail sector by integrating digital objects into the real world through a viewing device, such as a phone or tablet. AR glasses are also gaining popularity in this regard. Manufacturers of mobile devices are enhancing user experience and value proposition by incorporating AR technologies into their devices. The increasing adoption of smartphones and tablets, especially in the retail industry, is expected to propel the growth of the AR market. For instance, smartphones, like Android and iOS, offer AR features such as Google Lens and AI lens, respectively, enabling consumers to scan their environment and place digital objects, such as furniture, in a particular room before purchasing.
This technology provides visual and sensory information, including sound, to create a more shopping experience. The integration of AR technology in retail is set to transform the industry by offering consumers a more interactive and engaging shopping experience.
Market Challenge
Privacy and security concerns over AR is a key challenge affecting the market growth. Augmented Reality (AR) technology is revolutionizing the retail sector by overlaying digital objects onto the real world through a viewing device such as a phone, tablet, or AR glasses. This digital technology enhances the shopping experience by adding visual and sensory elements, including sound and haptic feedback, to the retail environment. However, privacy concerns are a significant challenge to the widespread adoption of AR in retail. AR technology collects and processes vast amounts of data about users and their surroundings, raising concerns about data privacy and security. It can access personal information from users' devices and social networking accounts, potentially posing a threat to their privacy.
Furthermore, the use of smart gears like AR glasses may also raise privacy concerns due to the amount of data they collect and transmit. Ensuring user privacy and data security is crucial for the successful implementation of AR technology in the retail industry.
Exclusive Customer Landscape
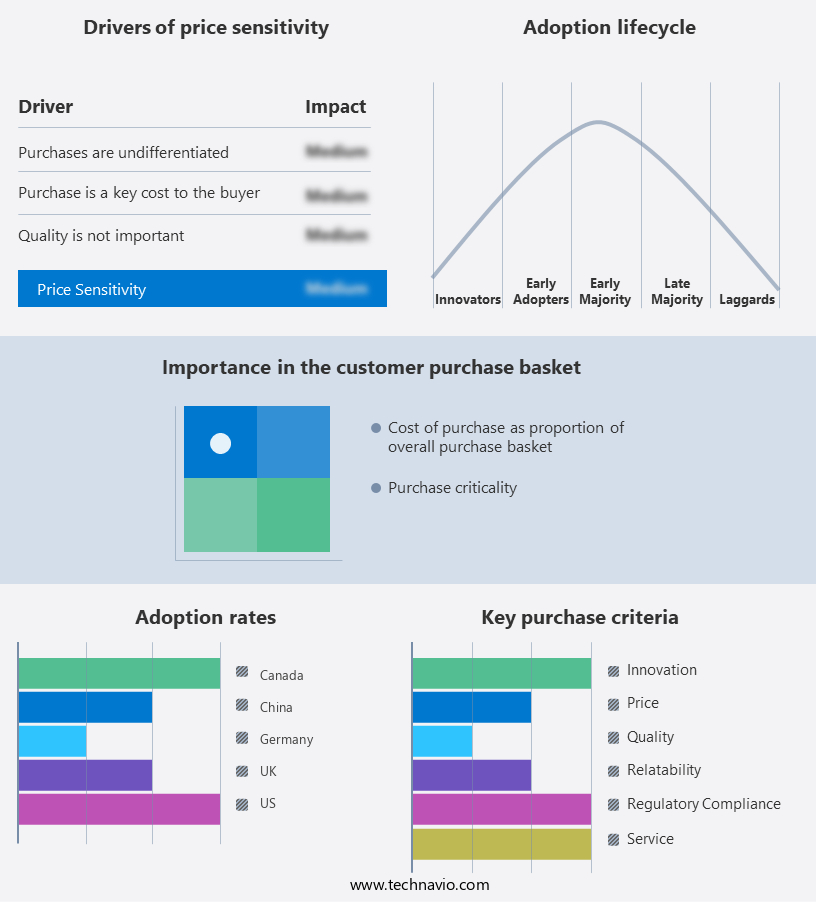
The market forecasting report includes the adoption lifecycle of the market, covering from the innovator's stage to the laggard's stage. It focuses on adoption rates in different regions based on penetration. Furthermore, the report also includes key purchase criteria and drivers of price sensitivity to help companies evaluate and develop their market growth analysis strategies.
Customer Landscape
Key Companies & Market Insights
Companies are implementing various strategies, such as strategic alliances, partnerships, mergers and acquisitions, geographical expansion, and product/service launches, to enhance their presence in the market.
Alphabet Inc. - The company offers augmented reality and virtual reality products such as Google AR and VR.
The market research and growth report includes detailed analyses of the competitive landscape of the market and information about key companies, including:
- Apple Inc.
- Elbit Systems Ltd.
- HP Inc.
- HTC Corp.
- Kopin Corp.
- Lenovo Group Ltd.
- Lumus Ltd.
- Magic Leap Inc.
- Microsoft Corp.
- NexTech AR Solutions Corp.
- PTC Inc.
- Qualcomm Inc.
- Samsung Electronics Co. Ltd.
- Sony Group Corp.
- Toshiba Corp.
- Upskill
- VR Vision Inc.
- Vuzix Corp.
- Zugara Inc.
Qualitative and quantitative analysis of companies has been conducted to help clients understand the wider business environment as well as the strengths and weaknesses of key market players. Data is qualitatively analyzed to categorize companies as pure play, category-focused, industry-focused, and diversified; it is quantitatively analyzed to categorize companies as dominant, leading, strong, tentative, and weak.
Research Analyst Overview
Augmented Reality (AR) is revolutionizing the retail sector by merging digital objects with the real world, providing an shopping experience for customers. AR technology utilizes a viewing device such as a phone, tablet, or AR glasses to overlay visual elements, sound, and sensory information onto the physical environment. In the retail industry, AR is being adopted for various applications including try-on solutions for apparel and footwear, virtual fitting rooms, and jewelry and beauty and cosmetics trials. AR is also being used for planning and designing in furniture and lighting retail, enabling customers to visualize products in their homes in real time.
Security and privacy concerns are being addressed through set-up and hardware and software solutions. AR is also being used for advertising and marketing, language translation, and online shopping, particularly in the footwear and jewelry segments. With the increasing smartphone penetration and connected devices, retailers are investing in innovative AR solutions to enhance the customer experience and boost online conversion rates while reducing return rates. AR options for personal customization and virtual representation of products are expected to drive growth in the retail sector, particularly among younger customers and in commercial markets such as e-commerce and automotive interior planning. IoT spending on AR is expected to increase as retailers seek to provide real-time digital information and virtual fitting room experiences in physical stores.
|
Industry Scope |
|
|
Report Coverage |
Details |
|
Page number |
147 |
|
Base year |
2023 |
|
Historic period |
2018 - 2022 |
|
Forecast period |
2024-2028 |
|
Growth momentum & CAGR |
Accelerate at a CAGR of 57.74% |
|
Market growth 2024-2028 |
USD 19.51 billion |
|
Market structure |
Fragmented |
|
YoY growth 2023-2024(%) |
43.16 |
|
Regional analysis |
North America, Europe, APAC, South America, and Middle East and Africa |
|
Performing market contribution |
North America at 30% |
|
Key countries |
US, China, Germany, UK, and Canada |
|
Competitive landscape |
Leading Companies, Market Positioning of Companies, Competitive Strategies, and Industry Risks |
|
Key companies profiled |
Alphabet Inc., Apple Inc., Elbit Systems Ltd., HP Inc., HTC Corp., Kopin Corp., Lenovo Group Ltd., Lumus Ltd., Magic Leap Inc., Microsoft Corp., NexTech AR Solutions Corp., PTC Inc., Qualcomm Inc., Samsung Electronics Co. Ltd., Sony Group Corp., Toshiba Corp., Upskill, VR Vision Inc., Vuzix Corp., and Zugara Inc. |
|
Market dynamics |
Parent market analysis, Market growth inducers and obstacles, Fast-growing and slow-growing segment analysis, Market growth and Forecasting, COVID 19 impact and recovery analysis and future consumer dynamics, Market condition analysis for forecast period |
|
Customization purview |
If our report has not included the data that you are looking for, you can reach out to our analysts and get segments customized. |
What are the Key Data Covered in this Market Research and Growth Report?
- CAGR of the market during the forecast period
- Detailed information on factors that will drive the market growth and forecasting between 2024 and 2028
- Precise estimation of the size of the market and its contribution of the market in focus to the parent market
- Accurate predictions about upcoming market growth and trends and changes in consumer behaviour
- Growth of the market across North America, Europe, APAC, South America, and Middle East and Africa
- Thorough analysis of the market's competitive landscape and detailed information about companies
- Comprehensive analysis of factors that will challenge the growth of market companies
We can help! Our analysts can customize this market research report to meet your requirements.
 RIA -
RIA - 
