
Australia Construction Market Size 2026-2030
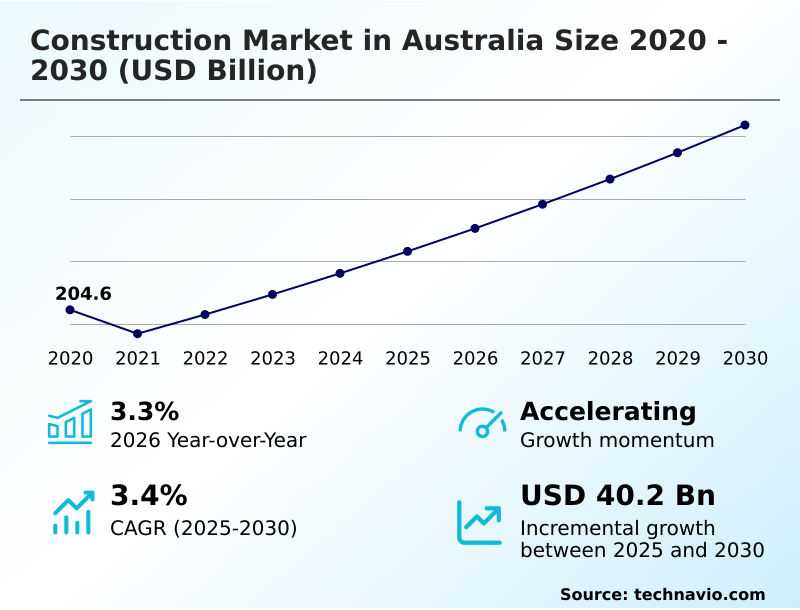
The Australia Construction Market size was valued at USD 223.2 billion in 2025, growing at a CAGR of 3.4% during the forecast period 2026-2030.
Major Market Trends & Insights
- By Sector - Building construction segment was valued at USD 114.5 billion in 2024
- By End-user - Engineering segment accounted for the largest market revenue share in 2024
Market Size & Forecast
- Historic Market Opportunities 2020-2024: USD 58.8 billion
- Market Future Opportunities 2025-2030: USD 40.2 billion
- CAGR from 2025 to 2030 : 3.4%
Market Summary
- The construction market in Australia is undergoing a significant transformation, with public sector investment in infrastructure now outpacing private commercial development by a ratio of nearly 2-to-1. This shift is most evident in the operational focus on large-scale civil projects, where a typical state-funded transport initiative requires mobilizing a workforce 30% larger than a comparable private high-rise project.
- A primary driver is unprecedented government funding aimed at both alleviating a national housing deficit and accelerating the transition to renewable energy. This provides a stable pipeline of work for major contractors.
- However, the market concurrently faces the profound challenge of industrial relations reform, which has introduced a new layer of complexity to workforce governance and enterprise bargaining, leading to short-term productivity dips of up to 5% on major sites.
- This dynamic requires firms to balance the pursuit of long-term public contracts with the immediate need for robust compliance and labor management strategies.
What will be the Size of the Australia Construction Market during the forecast period?
Get Key Insights on Market Forecast (PDF) Request Free Sample
How is the Australia Construction Market Segmented?
The australia construction industry research report provides comprehensive data (region-wise segment analysis), with forecasts and analysis for the period 2026-2030, as well as historical data from 2020-2024 for the following segments.
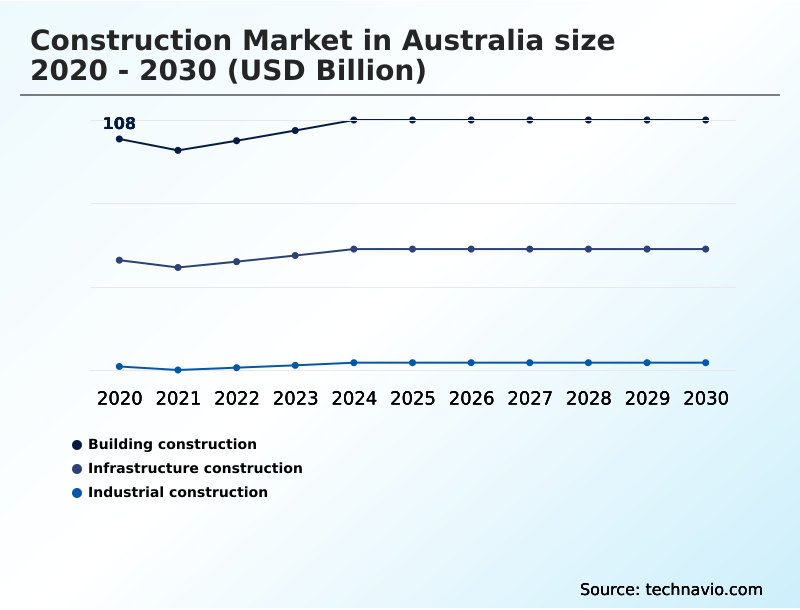
- Sector
- Building construction
- Infrastructure construction
- Industrial construction
- End-user
- Engineering
- Residential
- Non-residential
- Type
- New construction
- Redevelopment
- Geography
- APAC
- Australia
- APAC
How is the Australia Construction Market Segmented by Sector?
The building construction segment is estimated to witness significant growth during the forecast period.
The building construction segment, which accounts for over 50% of the market, is pivoting toward high-density residential and social infrastructure projects to address housing deficits.
This sector is increasingly influenced by circular economy principles, with a 15% rise in the use of sustainable building materials and advanced construction waste management techniques. In contrast, the infrastructure segment is dominated by large-scale transport and energy projects.
Across all segments, building information modeling (BIM) is becoming standard, improving design collaboration and reducing rework.
The adoption of generative design and circular design methodologies is helping to optimize material usage, while tools for carbon accounting and the development of a material passport are critical for meeting new sustainability regulations.
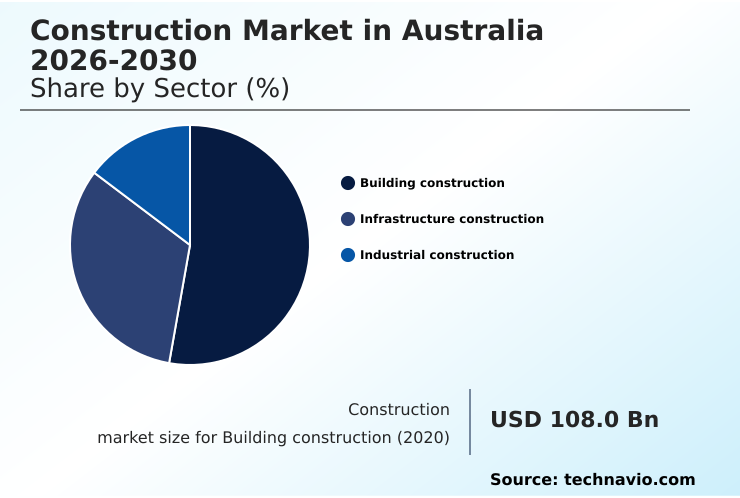
The Building construction segment was valued at USD 114.5 billion in 2024 and showed a gradual increase during the forecast period.
What are the key Drivers, Trends, and Challenges in the Australia Construction Market?
Our researchers analyzed the data with 2025 as the base year, along with the key drivers, trends, and challenges. A holistic analysis of drivers will help companies refine their marketing strategies to gain a competitive advantage.
- Navigating the modern construction landscape requires a deep understanding of evolving methodologies and technologies. The impact of digital twin on project governance is transformative, with firms reporting up to a 15% reduction in lifecycle operational costs by using virtual replicas for predictive maintenance and scenario modeling.
- A critical strategic decision for developers involves evaluating modern methods of construction vs traditional building, where off-site prefabrication can shorten project timelines by as much as 30%, though it demands higher upfront capital and sophisticated supply chain coordination.
- In response to increasing regulatory pressure and client demand for sustainable assets, developing effective strategies for reducing embodied carbon in construction is no longer optional. This involves specifying low-carbon materials and optimizing designs to minimize waste.
- Furthermore, the integration of ai applications for construction project management is streamlining workflows, from automated resource scheduling to risk analysis, boosting efficiency by over 20% compared to manual processes.
- However, the industry's ability to capitalize on these innovations is constrained by the persistent challenge of managing skilled labor shortages in building projects, which necessitates greater investment in workforce training and automation to maintain project momentum and quality.
What are the key market drivers leading to the rise in the adoption of Australia Construction Industry?
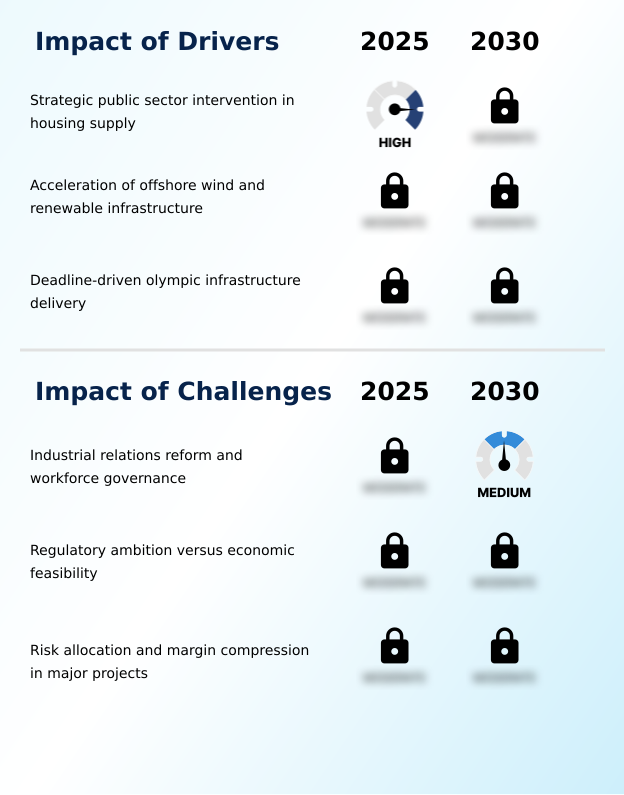
- Strategic public sector intervention in housing supply, characterized by direct government funding and project mobilization, is a primary driver for the Australian construction market.
- Government intervention is a primary driver, with large-scale funding for urban regeneration and social housing stimulating activity and favoring a build-to-rent model, which now accounts for 10% of new multi-family projects.
- This public capital injection provides long-term certainty for contractors engaged in infrastructure development. Simultaneously, the acceleration of renewable energy infrastructure projects to meet national decarbonization targets is creating a surge in demand for specialized civil engineering services.
- These initiatives, often managed through collaborative contracting models, require sophisticated project management software to handle complex scopes.
- The push for net-zero buildings and climate resilience is also influencing project specifications, with ESG reporting becoming a standard requirement, impacting project bids by at least 5%.
What are the market trends shaping the Australia Construction Industry?
- The Australian construction market is experiencing a structural shift toward Modern Methods of Construction (MMC), with prefabrication and modular building techniques moving from niche alternatives to mainstream strategies.
- The mainstreaming of Modern Methods of Construction (MMC) is reshaping project delivery, with a 30% increase in the use of prefabrication and modular construction to combat labor shortages. This shift to off-site manufacturing is driven by the need for faster project timelines and improved quality assurance.
- Digital twin technology is also gaining traction, enabling predictive analytics for asset lifecycle management and reducing operational errors by up to 15%. The integration of AI project governance and parametric design is automating workflows, while augmented reality for construction provides on-site teams with real-time data overlays.
- This industrialization of construction treats buildings as manufactured products, altering supply chain dynamics and emphasizing logistics efficiency over traditional on-site trades.
What challenges does the Australia Construction Industry face during its growth?
- Industrial relations reform and new workforce governance frameworks present a significant challenge to the Australian construction industry, impacting labor stability and operational continuity.
- The construction market faces significant challenges in skilled labor management, with productivity on high-rise construction projects declining by 5% due to workforce instability. The overhaul of industrial relations frameworks has complicated enterprise bargaining agreements and introduced volatility into workforce planning and site safety protocols. This uncertainty exacerbates the risk of project cost overruns, particularly under rigid fixed-price contracts.
- Firms are now exploring new risk allocation models and using robotics process automation to offset labor gaps. The governance crisis within key unions has forced contractors to invest over 20% more in compliance and legal resources, while some are exploring blockchain for supply chain transparency to secure material delivery and mitigate disputes.
Exclusive Technavio Analysis on Customer Landscape
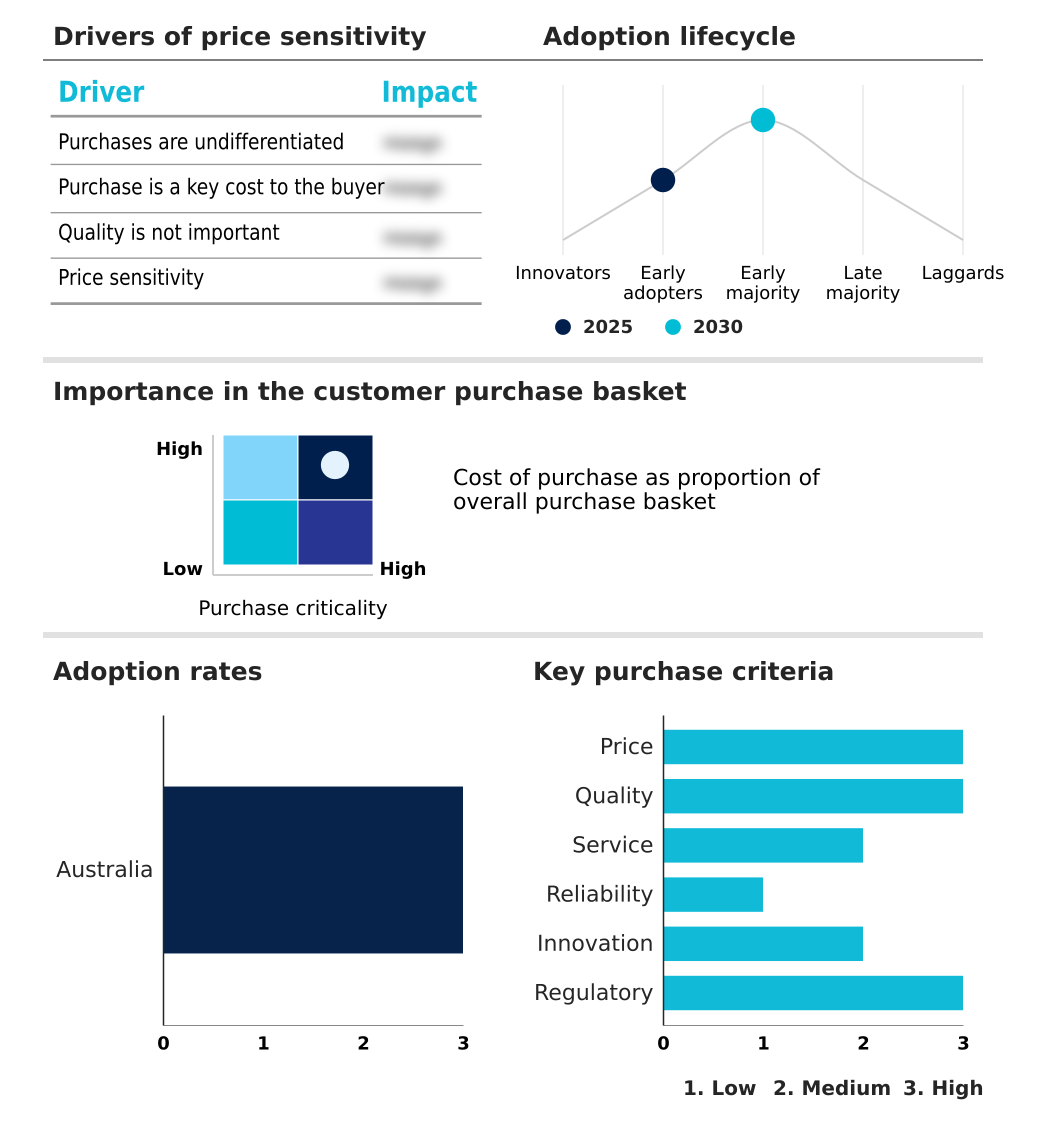
The australia construction market forecasting report includes the adoption lifecycle of the market, covering from the innovator’s stage to the laggard’s stage. It focuses on adoption rates in different regions based on penetration. Furthermore, the australia construction market report also includes key purchase criteria and drivers of price sensitivity to help companies evaluate and develop their market growth analysis strategies.
Customer Landscape of Australia Construction Industry
Competitive Landscape
Companies are implementing various strategies, such as strategic alliances, australia construction market forecast, partnerships, mergers and acquisitions, geographical expansion, and product/service launches, to enhance their presence in the industry.
ABC Group - Offers specialized building certification, defect reporting, and remedial project management services, focusing on quality assurance and regulatory compliance for construction assets.
The industry research and growth report includes detailed analyses of the competitive landscape of the market and information about key companies, including:
- ABC Group
- ADCO Constructions Pty Ltd.
- AECOM
- Alchemy Construct
- Altrad Group
- Arup Group Ltd.
- Barker Ryan Stewart
- Built Holdings Pty Ltd.
- BY Group
- CPB Contractors Pty Ltd.
- Fulton Hogan Ltd.
- Grimshaw Architects
- Inspired Built
- J Hutchinson Pty Ltd.
- John Holland Group Pty Ltd.
- Kapitol Group
- Lendlease Corp. Ltd.
- Multiplex
- Taylor
- Vaughan Constructions
Qualitative and quantitative analysis of companies has been conducted to help clients understand the wider business environment as well as the strengths and weaknesses of key industry players. Data is qualitatively analyzed to categorize companies as pure play, category-focused, industry-focused, and diversified; it is quantitatively analyzed to categorize companies as dominant, leading, strong, tentative, and weak.
Market Intelligence Radar: High-Impact Developments & Growth Signals
- In the Construction and Engineering industry, the widespread government mandate for smart city initiatives is channeling significant investment into urban infrastructure, directly boosting demand for advanced civil engineering and construction services in the construction market.
- The increasing adoption of digital transformation technologies, such as building information modeling (BIM) and digital twins, is fundamentally altering project management and execution, forcing construction firms to invest in new software and skilled personnel to remain competitive.
- Heightened volatility in raw material pricing, with steel and lumber costs fluctuating by over 20% in some quarters, is compelling a supply chain pivot toward long-term supplier agreements and the integration of recycled and sustainable building materials to mitigate project cost overruns.
- Persistent skilled labor shortages across developed economies are accelerating the adoption of off-site manufacturing and robotics process automation on construction sites, creating a 15% improvement in productivity for early adopters but also requiring significant capital expenditure.
Dive into Technavio’s robust research methodology, blending expert interviews, extensive data synthesis, and validated models for unparalleled Australia Construction Market insights. See full methodology.
| Market Scope | |
|---|---|
| Page number | 171 |
| Base year | 2025 |
| Historic period | 2020-2024 |
| Forecast period | 2026-2030 |
| Growth momentum & CAGR | Accelerate at a CAGR of 3.4% |
| Market growth 2026-2030 | USD 40.2 billion |
| Market structure | Fragmented |
| YoY growth 2025-2026(%) | 3.3% |
| Key countries | Australia |
| Competitive landscape | Leading Companies, Market Positioning of Companies, Competitive Strategies, and Industry Risks |
Research Analyst Overview
- The ecosystem of the construction market in Australia is a complex network where government agencies act as the largest client, commissioning over 60% of new large-scale projects. Material suppliers, providing essentials like steel and concrete, wield significant influence due to supply chain concentrations, impacting project costs by as much as 25% during periods of volatility.
- Tier-1 contractors and specialized engineering firms execute these projects, interacting with regulatory bodies that enforce stringent safety and environmental standards. The value chain extends to technology providers offering building information modeling and project management software, which have become critical for efficiency. Distribution channels are managed through complex logistics, while end-users include public commuters, residents of new housing, and commercial tenants.
- Supporting entities like R&D institutions and trade unions also shape industry practices and labor availability, completing a highly interdependent system.
What are the Key Data Covered in this Australia Construction Market Research and Growth Report?
-
What is the expected growth of the Australia Construction Market between 2026 and 2030?
-
The Australia Construction Market is expected to grow by USD 40.2 billion during 2026-2030, registering a CAGR of 3.4%. Year-over-year growth in 2026 is estimated at 3.3%%. This acceleration is shaped by strategic public sector intervention in housing supply, which is intensifying demand across multiple end-use verticals covered in the report.
-
-
What segmentation does the market report cover?
-
The report is segmented by Sector (Building construction, Infrastructure construction, and Industrial construction), End-user (Engineering, Residential, and Non-residential), Type (New construction, and Redevelopment) and Geography (APAC). Among these, the Building construction segment is estimated to witness significant growth during the forecast period, driven by rising adoption across key application areas. Each segment includes detailed qualitative and quantitative analysis, along with historical data from 2020-2024 and forecasts through 2030 with year-over-year growth rates.
-
-
Which regions are analyzed in the report?
-
The report covers APAC. Country-level analysis includes Australia, with dedicated market size tables and year-over-year growth for each.
-
-
What are the key growth drivers and market challenges?
-
The primary driver is strategic public sector intervention in housing supply, which is accelerating investment and industry demand. The main challenge is industrial relations reform and workforce governance, creating operational barriers for key market participants. The report quantifies the impact of each driver and challenge across 2026 and 2030 with comparative analysis.
-
-
Who are the major players in the Australia Construction Market?
-
Key vendors include ABC Group, ADCO Constructions Pty Ltd., AECOM, Alchemy Construct, Altrad Group, Arup Group Ltd., Barker Ryan Stewart, Built Holdings Pty Ltd., BY Group, CPB Contractors Pty Ltd., Fulton Hogan Ltd., Grimshaw Architects, Inspired Built, J Hutchinson Pty Ltd., John Holland Group Pty Ltd., Kapitol Group, Lendlease Corp. Ltd., Multiplex, Taylor and Vaughan Constructions. The report provides qualitative and quantitative analysis categorizing companies as dominant, leading, strong, tentative, and weak based on their market positioning. Company profiles include business segment analysis, SWOT assessment, key offerings, and recent strategic developments.
-
Market Research Insights
- The competitive landscape of the construction market in Australia is defined by intense rivalry among Tier-1 contractors, who compete for approximately 70% of the value of major public infrastructure projects. Key vendors like CPB Contractors and John Holland are leveraging digital engineering tools to gain a competitive edge.
- Recent vendor activities reflect a strategic pivot toward digitalization and sustainability, with Lendlease, for instance, refocusing on domestic projects with high ESG credentials. These actions are a direct response to government procurement criteria that now weigh sustainable practices as 20% of the total bid value. Firms are integrating modular construction and AI-powered site monitoring to meet these demands.
- The primary challenge remains navigating complex enterprise agreements and skilled labor shortages, forcing companies to innovate not just in construction methods but also in workforce management.
We can help! Our analysts can customize this australia construction market research report to meet your requirements.
 RIA -
RIA - 
