Automatic Autonomous Emergency Braking Market Analysis, Size, and Forecast 2026-2030: APAC (China, India, and Japan), Europe (Germany, UK, and France), North America (US, Canada, and Mexico), South America (Brazil, Argentina, and Colombia), Middle East and Africa (Saudi Arabia, UAE, and South Africa), and Rest of World (ROW)

Automatic Autonomous Emergency Braking Market Analysis, Size, and Forecast 2026-2030:
APAC (China, India, and Japan), Europe (Germany, UK, and France), North America (US, Canada, and Mexico), South America (Brazil, Argentina, and Colombia), Middle East and Africa (Saudi Arabia, UAE, and South Africa), and Rest of World (ROW)

Published: Dec 2025 315 Pages SKU: IRTNTR81206

Market Overview at a Glance

$66.84 B
Market Opportunity
18.5%
CAGR 2025 - 2030
39.6%
APAC Growth
$
Lows speed AEB segment 2024

Automatic Autonomous Emergency Braking Market Size 2026-2030

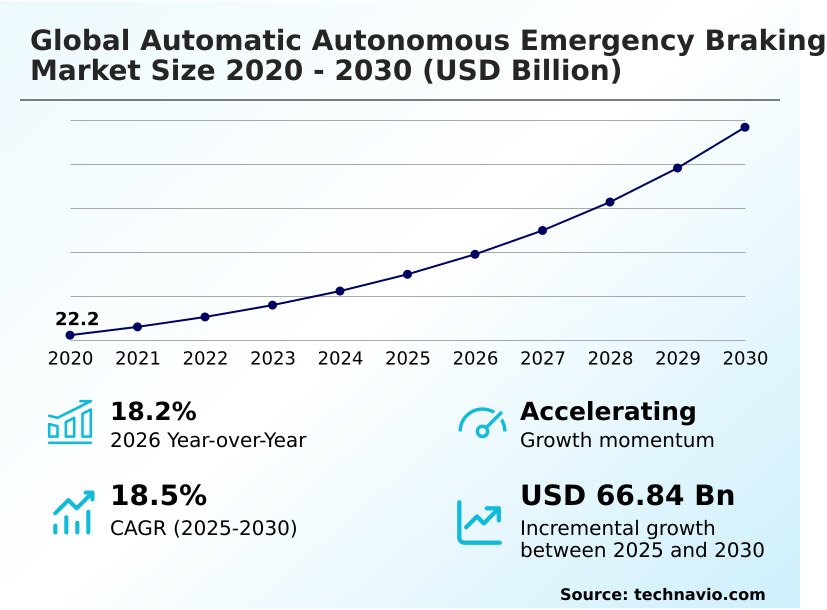
The automatic autonomous emergency braking market size is valued to increase by USD 66.84 billion, at a CAGR of 18.5% from 2025 to 2030. Stringent government regulations and proactive safety mandates will drive the automatic autonomous emergency braking market.

Major Market Trends & Insights

  • APAC dominated the market and accounted for a 39.6% growth during the forecast period.
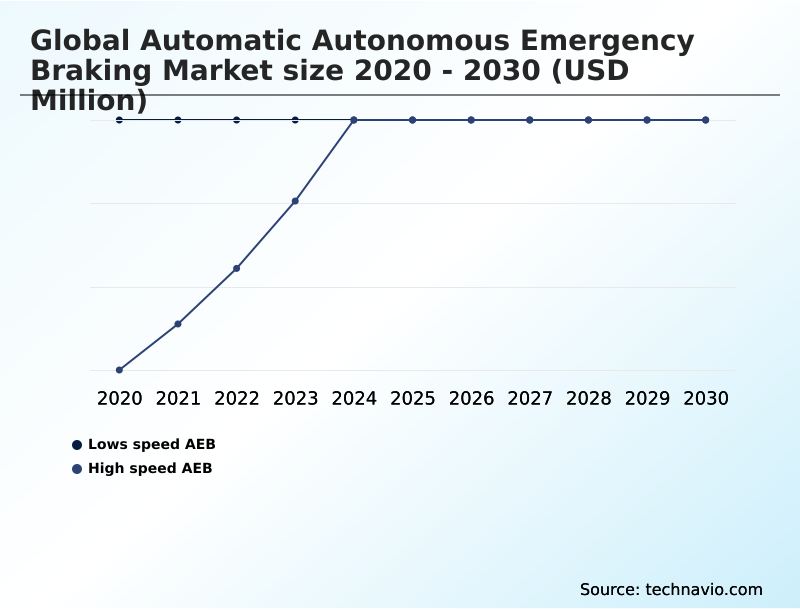
  • By Type - Lows speed AEB segment was valued at in 2024
  • By Technology - Radar based AEB segment accounted for the largest market revenue share in 2024

Market Size & Forecast

  • Market Opportunities: USD 94.51 billion
  • Market Future Opportunities: USD 66.84 billion
  • CAGR from 2025 to 2030 : 18.5%

Market Summary

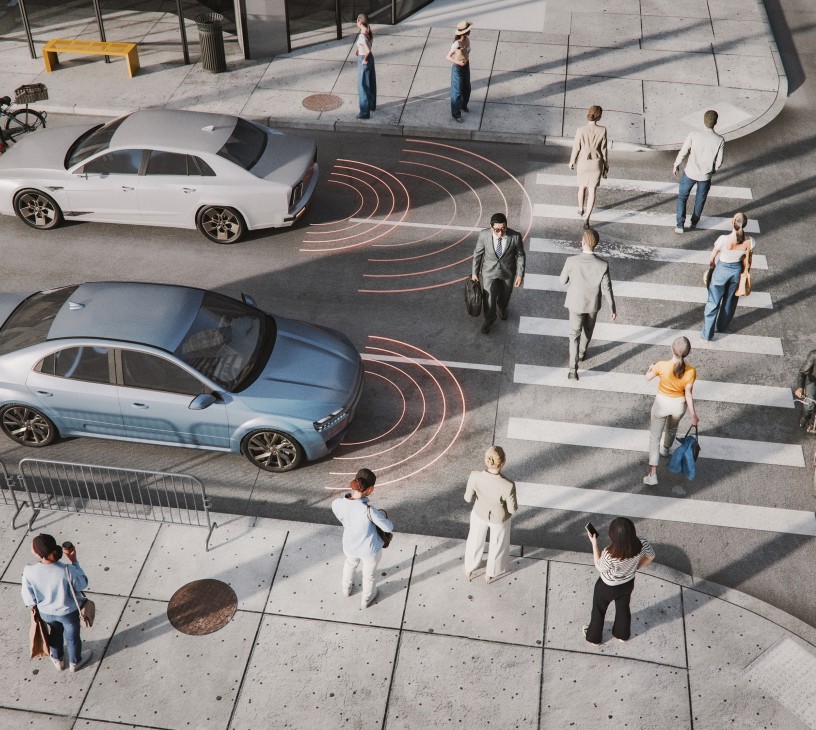
  • The automatic autonomous emergency braking market is experiencing profound growth, driven by a powerful confluence of stringent global regulations, rapid technological innovation, and escalating consumer demand for safety. This expansion is transforming AEB from a standalone feature into a foundational element of the broader ecosystem of advanced driver assistance systems and the progression toward fully autonomous driving.
  • The industry is witnessing a decisive shift toward sophisticated sensor fusion architectures, where data from high-resolution cameras, 4D imaging radar, and increasingly affordable solid-state LiDAR are intelligently combined. For instance, fleet management operations are leveraging these advancements to reduce accident rates, which directly lowers insurance premiums and vehicle downtime.
  • This focus on tangible safety outcomes and operational efficiency underscores the technology's critical role in both new passenger vehicles and the rapidly expanding commercial vehicle sector, where mandates are creating a non-negotiable demand floor.

What will be the Size of the Automatic Autonomous Emergency Braking Market during the forecast period?

Get Key Insights on Market Forecast (PDF) Request Free Sample

How is the Automatic Autonomous Emergency Braking Market Segmented?

The automatic autonomous emergency braking industry research report provides comprehensive data (region-wise segment analysis), with forecasts and estimates in "USD million" for the period 2026-2030, as well as historical data from 2020-2024 for the following segments.

  • Type
    • Low speed AEB
    • High speed AEB
  • Technology
    • Radar based AEB
    • Camera based AEB
    • LiDAR based AEB
    • Ultrasonic based AEB
    • Others
  • Vehicle type
    • Passenger cars
    • Commercial vehicles
    • Others
  • Geography
    • APAC
      • China
      • India
      • Japan
    • Europe
      • Germany
      • UK
      • France
    • North America
      • US
      • Canada
      • Mexico
    • South America
      • Brazil
      • Argentina
      • Colombia
    • Middle East and Africa
      • Saudi Arabia
      • UAE
      • South Africa
    • Rest of World (ROW)

By Type Insights

The low speed aeb segment is estimated to witness significant growth during the forecast period.

The low speed AEB segment is crucial for mitigating collisions in urban settings, where systems are optimized for speeds where most accidents with vulnerable road users occur.

These systems utilize a multi-sensor redundancy approach, fusing data from radar based AEB, camera based AEB, and ultrasonic based AEB, with LiDAR based AEB becoming more common in premium applications.

This architecture is essential for improving autonomous braking performance metrics and avoiding false activations in cluttered environments.

A recent pilot program demonstrated a 60% reduction in near-miss incidents with cyclists by incorporating vehicle to everything communication, highlighting a future where connected infrastructure provides another critical layer of safety and enhances system effectiveness.

Request Free Sample

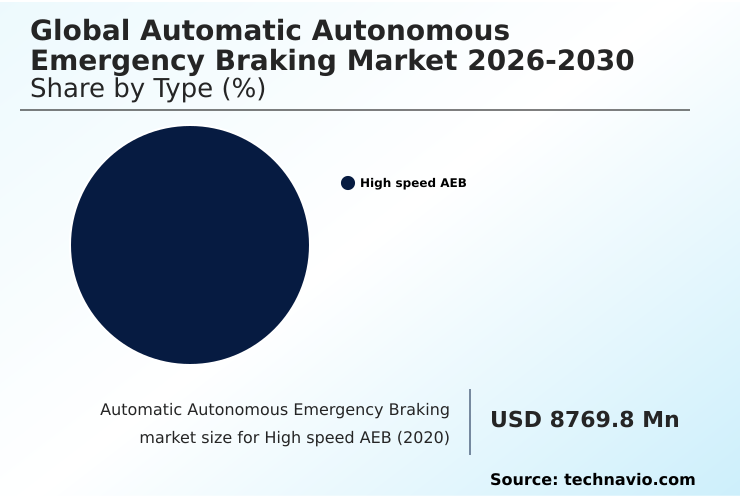
The Low speed AEB segment was valued at in 2024 and showed a gradual increase during the forecast period.

Request Free Sample

Regional Analysis

APAC is estimated to contribute 39.6% to the growth of the global market during the forecast period.Technavio’s analysts have elaborately explained the regional trends and drivers that shape the market during the forecast period.

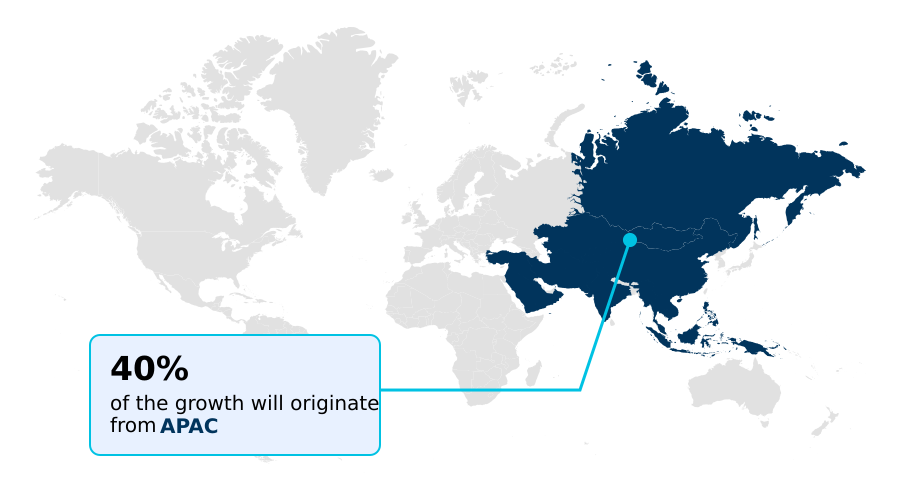
See How Automatic Autonomous Emergency Braking Market Demand is Rising in APAC Request Free Sample

The geographic landscape for automatic autonomous emergency braking is diverse, with APAC poised to contribute nearly 40% of the market's incremental growth.

Mature markets in Europe and North America focus on refining advanced driver assistance systems for vulnerable road user protection, driven by robust safety programs that emphasize nighttime AEB effectiveness and stringent pedestrian emergency braking standards.

In contrast, emerging economies are shaped by government mandates and cost sensitivity, particularly for AEB for commercial vehicles.

The pedestrian detection algorithm and cyclist detection system must be calibrated for unique regional traffic, such as the high density of two-wheelers in certain APAC nations, which challenges cyclist detection in urban environments.

The rollout of advanced features like junction turn assist varies significantly by region.

Market Dynamics

Our researchers analyzed the data with 2025 as the base year, along with the key drivers, trends, and challenges. A holistic analysis of drivers will help companies refine their marketing strategies to gain a competitive advantage.

  • The strategic landscape of the automatic autonomous emergency braking market is increasingly defined by complex technical challenges and specialized use cases. A primary focus for developers is ensuring reliable aeb system performance in adverse weather conditions and developing robust aeb for complex edge cases.
  • This is achieved through advanced sensor fusion algorithms for vulnerable road user detection and sophisticated ai models for predictive emergency braking intent. The impact of 4d imaging radar on aeb accuracy has been significant, though questions around radar versus lidar effectiveness in aeb systems persist.
  • The industry is also grappling with the total cost of ownership for aeb systems, where challenges in aeb system post-collision repair are a major concern. Addressing cybersecurity vulnerabilities in connected aeb platforms and clarifying liability frameworks for autonomous braking failures are critical for market acceptance.
  • Architecturally, the trend is toward aeb integration into centralized vehicle architectures and brake-by-wire integration for faster aeb response, which is vital for both high-speed aeb performance for highway scenarios and low-speed aeb effectiveness in stop-and-go traffic.
  • New performance standards for aeb on heavy trucks are creating a distinct sub-market, while improving the real-world performance of pedestrian detection systems and aeb system validation for motorcycle detection remains a priority. This includes enhancing aeb functionality for intersection turning assist and reducing false positives in camera-based aeb, often through enhancing aeb with vehicle-to-everything data.

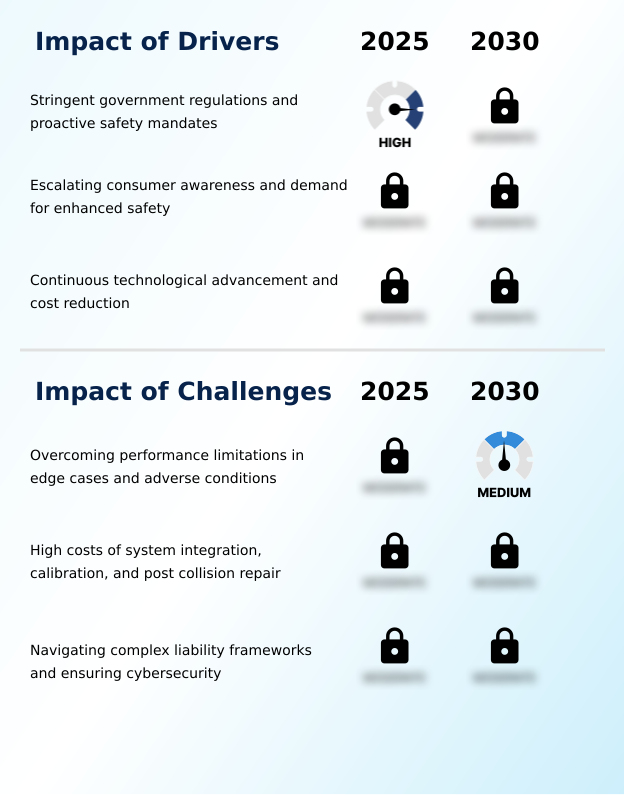
What are the key market drivers leading to the rise in the adoption of Automatic Autonomous Emergency Braking Industry?

  • Stringent government regulations and proactive safety mandates, designed to reduce traffic fatalities, are key drivers propelling market expansion and technological adoption.

  • Relentless technological innovation is a critical driver, with predictive AEB software transforming system capabilities. Modern advanced driver assistance systems depend on the performance and affordability of their underlying components.
  • AI powered perception, in compliance with ISO 26262 functional safety standards, has revolutionized automotive perception software, allowing systems to move from reactive to predictive capability.
  • Sensor fusion combines data from multiple sources, with some chipsets delivering a fourfold increase in angular resolution.
  • This enables effective high-speed AEB managed by a centralized domain controller that orchestrates everything from sensor inputs to brake-by-wire systems for the 2028 model year and beyond, ensuring that the final AEB system calibration delivers optimal and safe performance.

What are the market trends shaping the Automatic Autonomous Emergency Braking Industry?

  • The proliferation of sensor fusion and AI-powered perception represents a transformative market trend. This evolution enhances system capabilities by integrating multiple data streams for more reliable and nuanced environmental interpretation.

  • The market is rapidly advancing beyond single-sensor systems toward a sophisticated sensor fusion architecture powered by AI. Where early systems had weaknesses, the current trend involves the collision avoidance technology integration of data from 8-megapixel cameras, 4D imaging radar, and solid-state LiDAR for a detailed environmental model. This approach enhances object classification accuracy and system confidence before braking.
  • The use of specialized processors with a dedicated neural processing unit provides an efficient computational backbone. The evolution includes advancements like thermal imaging for AEB to improve performance and enabling over the air updates for AEB, which is critical for the continuous improvement of systems, particularly in AEB for electric vehicles where software-defined features are paramount.

What challenges does the Automatic Autonomous Emergency Braking Industry face during its growth?

  • A key challenge restraining market growth involves overcoming system performance limitations, particularly in handling unpredictable edge cases and maintaining reliability in adverse environmental conditions.

  • Performance variability in non-ideal conditions remains a primary challenge, as achieving full all-weather system capabilities is difficult. Edge case scenario handling is another significant hurdle, as systems may fail to react to unique situations, compromising reliability. This can lead to a need for AEB false positive reduction.
  • The high cost of the sensor recalibration process post-collision significantly impacts ownership, with some data showing repair costs surging over 30%. Furthermore, ensuring robust cybersecurity for AEB systems through measures like end-to-end encryption is paramount as vehicles become more connected. These challenges affect both low-speed AEB in urban areas and reverse AEB functionality, requiring adherence to stringent regulatory test protocols.

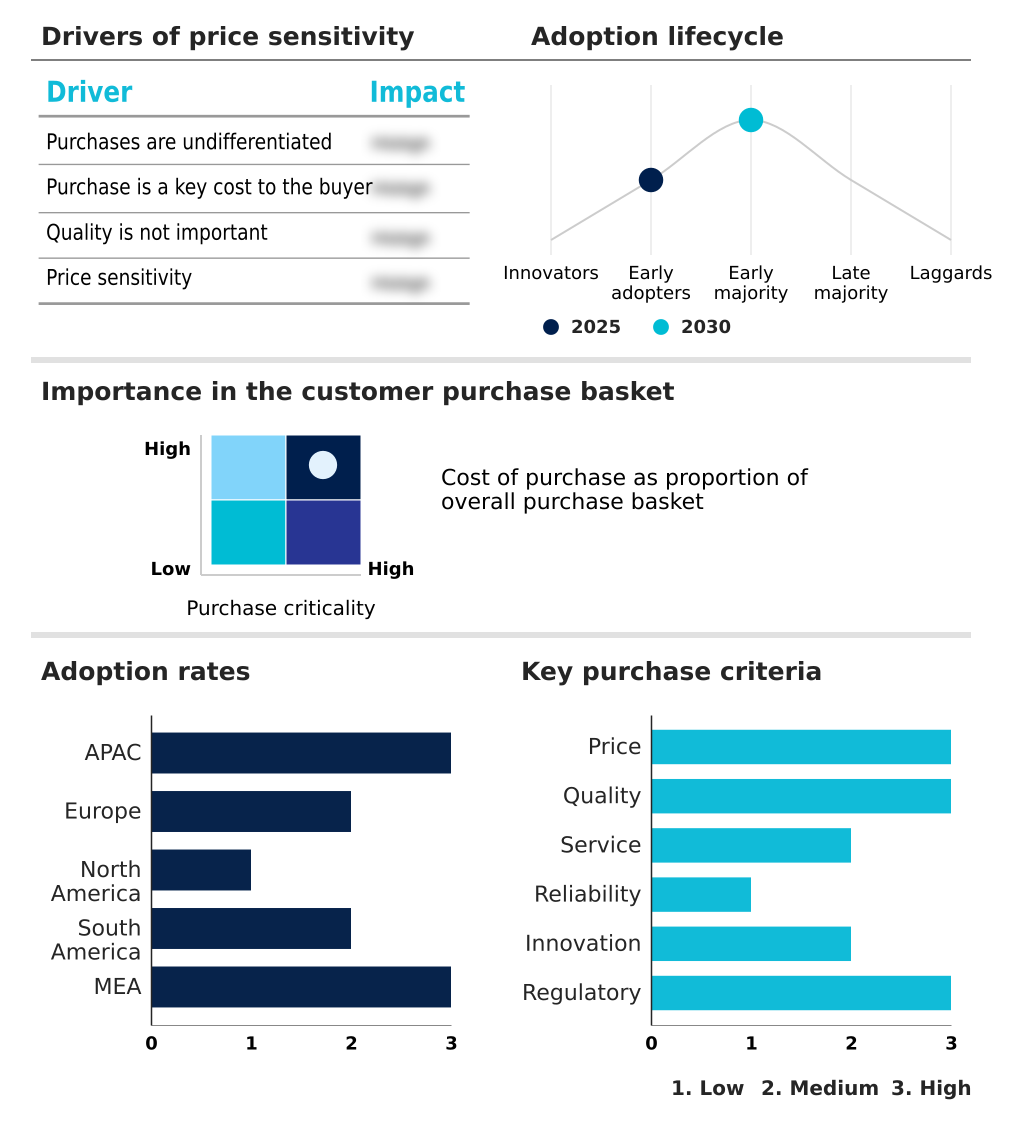
Exclusive Technavio Analysis on Customer Landscape

The automatic autonomous emergency braking market forecasting report includes the adoption lifecycle of the market, covering from the innovator’s stage to the laggard’s stage. It focuses on adoption rates in different regions based on penetration. Furthermore, the automatic autonomous emergency braking market report also includes key purchase criteria and drivers of price sensitivity to help companies evaluate and develop their market growth analysis strategies.

Customer Landscape of Automatic Autonomous Emergency Braking Industry

Competitive Landscape

Companies are implementing various strategies, such as strategic alliances, automatic autonomous emergency braking market forecast, partnerships, mergers and acquisitions, geographical expansion, and product/service launches, to enhance their presence in the industry.

AISIN Corp. - Analyzes offerings of radar and camera-based AEB systems designed for comprehensive collision mitigation, providing critical warnings and full emergency braking to protect vehicles, pedestrians, and cyclists.

The industry research and growth report includes detailed analyses of the competitive landscape of the market and information about key companies, including:

  • AISIN Corp.
  • Analog Devices Inc.
  • Aptiv Plc
  • Autoliv Inc.
  • Continental AG
  • DENSO Corp.
  • HELLA GmbH and Co. KGaA
  • Hitachi Astemo Ltd.
  • Hyundai Mobis Co. Ltd.
  • Infineon Technologies AG
  • Magna International Inc.
  • Mobileye Technologies Ltd.
  • NXP Semiconductors NV
  • Robert Bosch GmbH
  • Teledyne FLIR LLC
  • Texas Instruments Inc.
  • Valeo SA
  • Veoneer Inc.
  • ZF Friedrichshafen AG

Qualitative and quantitative analysis of companies has been conducted to help clients understand the wider business environment as well as the strengths and weaknesses of key industry players. Data is qualitatively analyzed to categorize companies as pure play, category-focused, industry-focused, and diversified; it is quantitatively analyzed to categorize companies as dominant, leading, strong, tentative, and weak.

Recent Development and News in Automatic autonomous emergency braking market

  • In August, 2025, Aptiv Plc demonstrated a new predictive AEB software architecture at a major industry trade show, using a deep learning model to analyze pedestrian posture and gait to predict roadway entry.
  • In April, 2025, Infineon Technologies AG announced the volume production of its next-generation automotive radar chipset, which offers a fourfold increase in angular resolution compared to its predecessor.
  • In March, 2025, NXP Semiconductors NV officially launched its next-generation S32 family of automotive processors, featuring a dedicated neural processing unit to accelerate real-time sensor fusion and AI-based object recognition.
  • In December, 2025, Magna International Inc. unveiled an innovative and highly integrated front fascia module for electric vehicles, which seamlessly incorporates an 8-megapixel camera, a solid-state LiDAR sensor, and an imaging radar.

Dive into Technavio’s robust research methodology, blending expert interviews, extensive data synthesis, and validated models for unparalleled Automatic Autonomous Emergency Braking Market insights. See full methodology.

Market Scope
Page number 315
Base year 2025
Historic period 2020-2024
Forecast period 2026-2030
Growth momentum & CAGR Accelerate at a CAGR of 18.5%
Market growth 2026-2030 USD 66835.3 million
Market structure Fragmented
YoY growth 2025-2026(%) 18.2%
Key countries China, India, Japan, South Korea, Australia, Indonesia, Germany, UK, France, Italy, The Netherlands, Spain, US, Canada, Mexico, Brazil, Argentina, Colombia, Saudi Arabia, UAE, South Africa, Israel and Turkey
Competitive landscape Leading Companies, Market Positioning of Companies, Competitive Strategies, and Industry Risks

Request Free Sample

Research Analyst Overview

  • The automatic autonomous emergency braking market is defined by a complex interplay of technologies. A modern sensor fusion architecture is now standard, integrating radar based aeb, camera based aeb, and increasingly, lidar based aeb and ultrasonic based aeb for different scenarios. The goal is to enhance vulnerable road user protection through superior object classification accuracy.
  • This requires sophisticated ai powered perception and predictive aeb software, managed by a centralized domain controller that also commands brake by wire systems. For automakers, the focus is on both high speed aeb for highways and low speed aeb for urban safety, including junction turn assist and reverse aeb functionality.
  • However, achieving flawless all weather system capabilities and robust edge case scenario handling remains a challenge, with some systems demonstrating a fourfold increase in resolution to address this. The sensor recalibration process after minor incidents adds to ownership costs.
  • Ensuring the performance of the pedestrian detection algorithm and cyclist detection system is critical for top safety ratings within the broader advanced driver assistance systems landscape.

What are the Key Data Covered in this Automatic Autonomous Emergency Braking Market Research and Growth Report?

  • What is the expected growth of the Automatic Autonomous Emergency Braking Market between 2026 and 2030?

    • USD 66.84 billion, at a CAGR of 18.5%

  • What segmentation does the market report cover?

    • The report is segmented by Type (Lows speed AEB, and High speed AEB), Technology (Radar based AEB, Camera based AEB, LiDAR based AEB, Ultrasonic based AEB, and Others), Vehicle Type (Passenger cars, Commercial vehicles, and Others) and Geography (APAC, Europe, North America, South America, Middle East and Africa)

  • Which regions are analyzed in the report?

    • APAC, Europe, North America, South America and Middle East and Africa

  • What are the key growth drivers and market challenges?

    • Stringent government regulations and proactive safety mandates, Overcoming performance limitations in edge cases and adverse conditions

  • Who are the major players in the Automatic Autonomous Emergency Braking Market?

    • AISIN Corp., Analog Devices Inc., Aptiv Plc, Autoliv Inc., Continental AG, DENSO Corp., HELLA GmbH and Co. KGaA, Hitachi Astemo Ltd., Hyundai Mobis Co. Ltd., Infineon Technologies AG, Magna International Inc., Mobileye Technologies Ltd., NXP Semiconductors NV, Robert Bosch GmbH, Teledyne FLIR LLC, Texas Instruments Inc., Valeo SA, Veoneer Inc. and ZF Friedrichshafen AG

Market Research Insights

  • Market dynamics are shaped by the need for robust active safety system validation and precise AEB system calibration. The collision avoidance technology integration is advancing rapidly, with an ongoing AEB sensor technology comparison driving innovation in radar, camera, and LiDAR.
  • Key areas of focus include improving nighttime AEB effectiveness and ensuring AEB for commercial vehicles meets stringent AEB regulatory test protocols. Pedestrian emergency braking standards and enhancing cyclist detection in urban environments are paramount.
  • Firms are leveraging over the air updates for AEB to improve automotive perception software and achieve AEB false positive reduction, which is critical for AEB system reliability testing.
  • With connectivity, vehicle to everything communication and thermal imaging for AEB are emerging as key enablers, while strong cybersecurity for AEB systems and adherence to ISO 26262 functional safety are non-negotiable, especially in AEB for electric vehicles where multi-sensor AEB redundancy is critical.

We can help! Our analysts can customize this automatic autonomous emergency braking market research report to meet your requirements.

Get in touch

1. Executive Summary

1.1 Market overview

Executive Summary - Chart on Market Overview
Executive Summary - Data Table on Market Overview
Executive Summary - Chart on Global Market Characteristics
Executive Summary - Chart on Market by Geography
Executive Summary - Chart on Market Segmentation by Type
Executive Summary - Chart on Market Segmentation by Technology
Executive Summary - Chart on Market Segmentation by Vehicle Type
Executive Summary - Chart on Incremental Growth
Executive Summary - Data Table on Incremental Growth
Executive Summary - Chart on Company Market Positioning

2. Technavio Analysis

2.1 Analysis of price sensitivity, lifecycle, customer purchase basket, adoption rates, and purchase criteria

2.2 Criticality of inputs and Factors of differentiation

Chart on Overview on criticality of inputs and factors of differentiation

2.3 Factors of disruption

Chart on Overview on factors of disruption

2.4 Impact of drivers and challenges

Chart on Impact of drivers and challenges in 2025 and 2030

3. Market Landscape

3.1 Market ecosystem

Chart on Parent Market
Data Table on - Parent Market

3.2 Market characteristics

Chart on Market characteristics analysis

3.3 Value chain analysis

Chart on Value chain analysis

4. Market Sizing

4.1 Market definition

Data Table on Offerings of companies included in the market definition

4.2 Market segment analysis

Market segments

4.3 Market size 2025

4.4 Market outlook: Forecast for 2025-2030

Chart on Global - Market size and forecast 2025-2030 ($ million)
Data Table on Global - Market size and forecast 2025-2030 ($ million)
Chart on Global Market: Year-over-year growth 2025-2030 (%)
Data Table on Global Market: Year-over-year growth 2025-2030 (%)

5. Historic Market Size

5.1 Global Automatic Autonomous Emergency Braking Market 2020 - 2024

Historic Market Size - Data Table on Global Automatic Autonomous Emergency Braking Market 2020 - 2024 ($ million)

5.2 Type segment analysis 2020 - 2024

Historic Market Size - Type Segment 2020 - 2024 ($ million)

5.3 Technology segment analysis 2020 - 2024

Historic Market Size - Technology Segment 2020 - 2024 ($ million)

5.4 Vehicle Type segment analysis 2020 - 2024

Historic Market Size - Vehicle Type Segment 2020 - 2024 ($ million)

5.5 Geography segment analysis 2020 - 2024

Historic Market Size - Geography Segment 2020 - 2024 ($ million)

5.6 Country segment analysis 2020 - 2024

Historic Market Size - Country Segment 2020 - 2024 ($ million)

6. Qualitative Analysis

6.1 The AI impact on global automatic autonomous emergency braking market

7. Five Forces Analysis

7.1 Five forces summary

Five forces analysis - Comparison between 2025 and 2030

7.2 Bargaining power of buyers

Bargaining power of buyers - Impact of key factors 2025 and 2030

7.3 Bargaining power of suppliers

Bargaining power of suppliers - Impact of key factors in 2025 and 2030

7.4 Threat of new entrants

Threat of new entrants - Impact of key factors in 2025 and 2030

7.5 Threat of substitutes

Threat of substitutes - Impact of key factors in 2025 and 2030

7.6 Threat of rivalry

Threat of rivalry - Impact of key factors in 2025 and 2030

7.7 Market condition

Chart on Market condition - Five forces 2025 and 2030

8. Market Segmentation by Type

8.1 Market segments

Chart on Type - Market share 2025-2030 (%)
Data Table on Type - Market share 2025-2030 (%)

8.2 Comparison by Type

Chart on Comparison by Type
Data Table on Comparison by Type

8.3 Low speed AEB - Market size and forecast 2025-2030

Chart on Low speed AEB - Market size and forecast 2025-2030 ($ million)
Data Table on Low speed AEB - Market size and forecast 2025-2030 ($ million)
Chart on Low speed AEB - Year-over-year growth 2025-2030 (%)
Data Table on Low speed AEB - Year-over-year growth 2025-2030 (%)

8.4 High speed AEB - Market size and forecast 2025-2030

Chart on High speed AEB - Market size and forecast 2025-2030 ($ million)
Data Table on High speed AEB - Market size and forecast 2025-2030 ($ million)
Chart on High speed AEB - Year-over-year growth 2025-2030 (%)
Data Table on High speed AEB - Year-over-year growth 2025-2030 (%)

8.5 Market opportunity by Type

Market opportunity by Type ($ million)
Data Table on Market opportunity by Type ($ million)

9. Market Segmentation by Technology

9.1 Market segments

Chart on Technology - Market share 2025-2030 (%)
Data Table on Technology - Market share 2025-2030 (%)

9.2 Comparison by Technology

Chart on Comparison by Technology
Data Table on Comparison by Technology

9.3 Radar based AEB - Market size and forecast 2025-2030

Chart on Radar based AEB - Market size and forecast 2025-2030 ($ million)
Data Table on Radar based AEB - Market size and forecast 2025-2030 ($ million)
Chart on Radar based AEB - Year-over-year growth 2025-2030 (%)
Data Table on Radar based AEB - Year-over-year growth 2025-2030 (%)

9.4 Camera based AEB - Market size and forecast 2025-2030

Chart on Camera based AEB - Market size and forecast 2025-2030 ($ million)
Data Table on Camera based AEB - Market size and forecast 2025-2030 ($ million)
Chart on Camera based AEB - Year-over-year growth 2025-2030 (%)
Data Table on Camera based AEB - Year-over-year growth 2025-2030 (%)

9.5 LiDAR based AEB - Market size and forecast 2025-2030

Chart on LiDAR based AEB - Market size and forecast 2025-2030 ($ million)
Data Table on LiDAR based AEB - Market size and forecast 2025-2030 ($ million)
Chart on LiDAR based AEB - Year-over-year growth 2025-2030 (%)
Data Table on LiDAR based AEB - Year-over-year growth 2025-2030 (%)

9.6 Ultrasonic based AEB - Market size and forecast 2025-2030

Chart on Ultrasonic based AEB - Market size and forecast 2025-2030 ($ million)
Data Table on Ultrasonic based AEB - Market size and forecast 2025-2030 ($ million)
Chart on Ultrasonic based AEB - Year-over-year growth 2025-2030 (%)
Data Table on Ultrasonic based AEB - Year-over-year growth 2025-2030 (%)

9.7 Others - Market size and forecast 2025-2030

Chart on Others - Market size and forecast 2025-2030 ($ million)
Data Table on Others - Market size and forecast 2025-2030 ($ million)
Chart on Others - Year-over-year growth 2025-2030 (%)
Data Table on Others - Year-over-year growth 2025-2030 (%)

9.8 Market opportunity by Technology

Market opportunity by Technology ($ million)
Data Table on Market opportunity by Technology ($ million)

10. Market Segmentation by Vehicle Type

10.1 Market segments

Chart on Vehicle Type - Market share 2025-2030 (%)
Data Table on Vehicle Type - Market share 2025-2030 (%)

10.2 Comparison by Vehicle Type

Chart on Comparison by Vehicle Type
Data Table on Comparison by Vehicle Type

10.3 Passenger cars - Market size and forecast 2025-2030

Chart on Passenger cars - Market size and forecast 2025-2030 ($ million)
Data Table on Passenger cars - Market size and forecast 2025-2030 ($ million)
Chart on Passenger cars - Year-over-year growth 2025-2030 (%)
Data Table on Passenger cars - Year-over-year growth 2025-2030 (%)

10.4 Commercial vehicles - Market size and forecast 2025-2030

Chart on Commercial vehicles - Market size and forecast 2025-2030 ($ million)
Data Table on Commercial vehicles - Market size and forecast 2025-2030 ($ million)
Chart on Commercial vehicles - Year-over-year growth 2025-2030 (%)
Data Table on Commercial vehicles - Year-over-year growth 2025-2030 (%)

10.5 Others - Market size and forecast 2025-2030

Chart on Others - Market size and forecast 2025-2030 ($ million)
Data Table on Others - Market size and forecast 2025-2030 ($ million)
Chart on Others - Year-over-year growth 2025-2030 (%)
Data Table on Others - Year-over-year growth 2025-2030 (%)

10.6 Market opportunity by Vehicle Type

Market opportunity by Vehicle Type ($ million)
Data Table on Market opportunity by Vehicle Type ($ million)

11. Customer Landscape

11.1 Customer landscape overview

Analysis of price sensitivity, lifecycle, customer purchase basket, adoption rates, and purchase criteria

12. Geographic Landscape

12.1 Geographic segmentation

Chart on Market share by geography 2025-2030 (%)
Data Table on Market share by geography 2025-2030 (%)

12.2 Geographic comparison

Chart on Geographic comparison
Data Table on Geographic comparison

12.3 APAC - Market size and forecast 2025-2030

Chart on APAC - Market size and forecast 2025-2030 ($ million)
Data Table on APAC - Market size and forecast 2025-2030 ($ million)
Chart on APAC - Year-over-year growth 2025-2030 (%)
Data Table on APAC - Year-over-year growth 2025-2030 (%)
Chart on Regional Comparison - APAC
Data Table on Regional Comparison - APAC

12.3.1 China - Market size and forecast 2025-2030

Chart on China - Market size and forecast 2025-2030 ($ million)
Data Table on China - Market size and forecast 2025-2030 ($ million)
Chart on China - Year-over-year growth 2025-2030 (%)
Data Table on China - Year-over-year growth 2025-2030 (%)

12.3.2 India - Market size and forecast 2025-2030

Chart on India - Market size and forecast 2025-2030 ($ million)
Data Table on India - Market size and forecast 2025-2030 ($ million)
Chart on India - Year-over-year growth 2025-2030 (%)
Data Table on India - Year-over-year growth 2025-2030 (%)

12.3.3 Japan - Market size and forecast 2025-2030

Chart on Japan - Market size and forecast 2025-2030 ($ million)
Data Table on Japan - Market size and forecast 2025-2030 ($ million)
Chart on Japan - Year-over-year growth 2025-2030 (%)
Data Table on Japan - Year-over-year growth 2025-2030 (%)

12.3.4 South Korea - Market size and forecast 2025-2030

Chart on South Korea - Market size and forecast 2025-2030 ($ million)
Data Table on South Korea - Market size and forecast 2025-2030 ($ million)
Chart on South Korea - Year-over-year growth 2025-2030 (%)
Data Table on South Korea - Year-over-year growth 2025-2030 (%)

12.3.5 Australia - Market size and forecast 2025-2030

Chart on Australia - Market size and forecast 2025-2030 ($ million)
Data Table on Australia - Market size and forecast 2025-2030 ($ million)
Chart on Australia - Year-over-year growth 2025-2030 (%)
Data Table on Australia - Year-over-year growth 2025-2030 (%)

12.3.6 Indonesia - Market size and forecast 2025-2030

Chart on Indonesia - Market size and forecast 2025-2030 ($ million)
Data Table on Indonesia - Market size and forecast 2025-2030 ($ million)
Chart on Indonesia - Year-over-year growth 2025-2030 (%)
Data Table on Indonesia - Year-over-year growth 2025-2030 (%)

12.4 Europe - Market size and forecast 2025-2030

Chart on Europe - Market size and forecast 2025-2030 ($ million)
Data Table on Europe - Market size and forecast 2025-2030 ($ million)
Chart on Europe - Year-over-year growth 2025-2030 (%)
Data Table on Europe - Year-over-year growth 2025-2030 (%)
Chart on Regional Comparison - Europe
Data Table on Regional Comparison - Europe

12.4.1 Germany - Market size and forecast 2025-2030

Chart on Germany - Market size and forecast 2025-2030 ($ million)
Data Table on Germany - Market size and forecast 2025-2030 ($ million)
Chart on Germany - Year-over-year growth 2025-2030 (%)
Data Table on Germany - Year-over-year growth 2025-2030 (%)

12.4.2 UK - Market size and forecast 2025-2030

Chart on UK - Market size and forecast 2025-2030 ($ million)
Data Table on UK - Market size and forecast 2025-2030 ($ million)
Chart on UK - Year-over-year growth 2025-2030 (%)
Data Table on UK - Year-over-year growth 2025-2030 (%)

12.4.3 France - Market size and forecast 2025-2030

Chart on France - Market size and forecast 2025-2030 ($ million)
Data Table on France - Market size and forecast 2025-2030 ($ million)
Chart on France - Year-over-year growth 2025-2030 (%)
Data Table on France - Year-over-year growth 2025-2030 (%)

12.4.4 Italy - Market size and forecast 2025-2030

Chart on Italy - Market size and forecast 2025-2030 ($ million)
Data Table on Italy - Market size and forecast 2025-2030 ($ million)
Chart on Italy - Year-over-year growth 2025-2030 (%)
Data Table on Italy - Year-over-year growth 2025-2030 (%)

12.4.5 The Netherlands - Market size and forecast 2025-2030

Chart on The Netherlands - Market size and forecast 2025-2030 ($ million)
Data Table on The Netherlands - Market size and forecast 2025-2030 ($ million)
Chart on The Netherlands - Year-over-year growth 2025-2030 (%)
Data Table on The Netherlands - Year-over-year growth 2025-2030 (%)

12.4.6 Spain - Market size and forecast 2025-2030

Chart on Spain - Market size and forecast 2025-2030 ($ million)
Data Table on Spain - Market size and forecast 2025-2030 ($ million)
Chart on Spain - Year-over-year growth 2025-2030 (%)
Data Table on Spain - Year-over-year growth 2025-2030 (%)

12.5 North America - Market size and forecast 2025-2030

Chart on North America - Market size and forecast 2025-2030 ($ million)
Data Table on North America - Market size and forecast 2025-2030 ($ million)
Chart on North America - Year-over-year growth 2025-2030 (%)
Data Table on North America - Year-over-year growth 2025-2030 (%)
Chart on Regional Comparison - North America
Data Table on Regional Comparison - North America

12.5.1 US - Market size and forecast 2025-2030

Chart on US - Market size and forecast 2025-2030 ($ million)
Data Table on US - Market size and forecast 2025-2030 ($ million)
Chart on US - Year-over-year growth 2025-2030 (%)
Data Table on US - Year-over-year growth 2025-2030 (%)

12.5.2 Canada - Market size and forecast 2025-2030

Chart on Canada - Market size and forecast 2025-2030 ($ million)
Data Table on Canada - Market size and forecast 2025-2030 ($ million)
Chart on Canada - Year-over-year growth 2025-2030 (%)
Data Table on Canada - Year-over-year growth 2025-2030 (%)

12.5.3 Mexico - Market size and forecast 2025-2030

Chart on Mexico - Market size and forecast 2025-2030 ($ million)
Data Table on Mexico - Market size and forecast 2025-2030 ($ million)
Chart on Mexico - Year-over-year growth 2025-2030 (%)
Data Table on Mexico - Year-over-year growth 2025-2030 (%)

12.6 South America - Market size and forecast 2025-2030

Chart on South America - Market size and forecast 2025-2030 ($ million)
Data Table on South America - Market size and forecast 2025-2030 ($ million)
Chart on South America - Year-over-year growth 2025-2030 (%)
Data Table on South America - Year-over-year growth 2025-2030 (%)
Chart on Regional Comparison - South America
Data Table on Regional Comparison - South America

12.6.1 Brazil - Market size and forecast 2025-2030

Chart on Brazil - Market size and forecast 2025-2030 ($ million)
Data Table on Brazil - Market size and forecast 2025-2030 ($ million)
Chart on Brazil - Year-over-year growth 2025-2030 (%)
Data Table on Brazil - Year-over-year growth 2025-2030 (%)

12.6.2 Argentina - Market size and forecast 2025-2030

Chart on Argentina - Market size and forecast 2025-2030 ($ million)
Data Table on Argentina - Market size and forecast 2025-2030 ($ million)
Chart on Argentina - Year-over-year growth 2025-2030 (%)
Data Table on Argentina - Year-over-year growth 2025-2030 (%)

12.6.3 Colombia - Market size and forecast 2025-2030

Chart on Colombia - Market size and forecast 2025-2030 ($ million)
Data Table on Colombia - Market size and forecast 2025-2030 ($ million)
Chart on Colombia - Year-over-year growth 2025-2030 (%)
Data Table on Colombia - Year-over-year growth 2025-2030 (%)

12.7 Middle East and Africa - Market size and forecast 2025-2030

Chart on Middle East and Africa - Market size and forecast 2025-2030 ($ million)
Data Table on Middle East and Africa - Market size and forecast 2025-2030 ($ million)
Chart on Middle East and Africa - Year-over-year growth 2025-2030 (%)
Data Table on Middle East and Africa - Year-over-year growth 2025-2030 (%)
Chart on Regional Comparison - Middle East and Africa
Data Table on Regional Comparison - Middle East and Africa

12.7.1 Saudi Arabia - Market size and forecast 2025-2030

Chart on Saudi Arabia - Market size and forecast 2025-2030 ($ million)
Data Table on Saudi Arabia - Market size and forecast 2025-2030 ($ million)
Chart on Saudi Arabia - Year-over-year growth 2025-2030 (%)
Data Table on Saudi Arabia - Year-over-year growth 2025-2030 (%)

12.7.2 UAE - Market size and forecast 2025-2030

Chart on UAE - Market size and forecast 2025-2030 ($ million)
Data Table on UAE - Market size and forecast 2025-2030 ($ million)
Chart on UAE - Year-over-year growth 2025-2030 (%)
Data Table on UAE - Year-over-year growth 2025-2030 (%)

12.7.3 South Africa - Market size and forecast 2025-2030

Chart on South Africa - Market size and forecast 2025-2030 ($ million)
Data Table on South Africa - Market size and forecast 2025-2030 ($ million)
Chart on South Africa - Year-over-year growth 2025-2030 (%)
Data Table on South Africa - Year-over-year growth 2025-2030 (%)

12.7.4 Israel - Market size and forecast 2025-2030

Chart on Israel - Market size and forecast 2025-2030 ($ million)
Data Table on Israel - Market size and forecast 2025-2030 ($ million)
Chart on Israel - Year-over-year growth 2025-2030 (%)
Data Table on Israel - Year-over-year growth 2025-2030 (%)

12.7.5 Turkey - Market size and forecast 2025-2030

Chart on Turkey - Market size and forecast 2025-2030 ($ million)
Data Table on Turkey - Market size and forecast 2025-2030 ($ million)
Chart on Turkey - Year-over-year growth 2025-2030 (%)
Data Table on Turkey - Year-over-year growth 2025-2030 (%)

12.8 Market opportunity by geography

Market opportunity by geography ($ million)
Data Tables on Market opportunity by geography ($ million)

13. Drivers, Challenges, and Opportunity

13.1 Market drivers

Stringent government regulations and proactive safety mandates
Escalating consumer awareness and demand for enhanced safety
Continuous technological advancement and cost reduction

13.2 Market challenges

Overcoming performance limitations in edge cases and adverse conditions
High costs of system integration, calibration, and post collision repair
Navigating complex liability frameworks and ensuring cybersecurity

13.3 Impact of drivers and challenges

Impact of drivers and challenges in 2025 and 2030

13.4 Market opportunities

Proliferation of sensor fusion and AI powered perception
Expanding AEB functionality to protect vulnerable road users (VRUs)
Deeper integration into holistic ADAS and automated driving platforms

14. Competitive Landscape

14.1 Overview

14.2

Overview on criticality of inputs and factors of differentiation

14.3 Landscape disruption

Overview on factors of disruption

14.4 Industry risks

Impact of key risks on business

15. Competitive Analysis

15.1 Companies profiled

Companies covered

15.2 Company ranking index

15.3 Market positioning of companies

Matrix on companies position and classification

15.4 AISIN Corp.

AISIN Corp. - Overview
AISIN Corp. - Business segments
AISIN Corp. - Key news
AISIN Corp. - Key offerings
AISIN Corp. - Segment focus
SWOT

15.5 Analog Devices Inc.

Analog Devices Inc. - Overview
Analog Devices Inc. - Business segments
Analog Devices Inc. - Key news
Analog Devices Inc. - Key offerings
Analog Devices Inc. - Segment focus
SWOT

15.6 Aptiv Plc

Aptiv Plc - Overview
Aptiv Plc - Business segments
Aptiv Plc - Key news
Aptiv Plc - Key offerings
Aptiv Plc - Segment focus
SWOT

15.7 Autoliv Inc.

Autoliv Inc. - Overview
Autoliv Inc. - Product / Service
Autoliv Inc. - Key news
Autoliv Inc. - Key offerings
SWOT

15.8 Continental AG

Continental AG - Overview
Continental AG - Business segments
Continental AG - Key news
Continental AG - Key offerings
Continental AG - Segment focus
SWOT

15.9 DENSO Corp.

DENSO Corp. - Overview
DENSO Corp. - Business segments
DENSO Corp. - Key news
DENSO Corp. - Key offerings
DENSO Corp. - Segment focus
SWOT

15.10 HELLA GmbH and Co. KGaA

HELLA GmbH and Co. KGaA - Overview
HELLA GmbH and Co. KGaA - Business segments
HELLA GmbH and Co. KGaA - Key news
HELLA GmbH and Co. KGaA - Key offerings
HELLA GmbH and Co. KGaA - Segment focus
SWOT

15.11 Hyundai Mobis Co. Ltd.

Hyundai Mobis Co. Ltd. - Overview
Hyundai Mobis Co. Ltd. - Business segments
Hyundai Mobis Co. Ltd. - Key offerings
Hyundai Mobis Co. Ltd. - Segment focus
SWOT

15.12 Infineon Technologies AG

Infineon Technologies AG - Overview
Infineon Technologies AG - Business segments
Infineon Technologies AG - Key news
Infineon Technologies AG - Key offerings
Infineon Technologies AG - Segment focus
SWOT

15.13 Magna International Inc.

Magna International Inc. - Overview
Magna International Inc. - Business segments
Magna International Inc. - Key news
Magna International Inc. - Key offerings
Magna International Inc. - Segment focus
SWOT

15.14 NXP Semiconductors NV

NXP Semiconductors NV - Overview
NXP Semiconductors NV - Product / Service
NXP Semiconductors NV - Key offerings
SWOT

15.15 Robert Bosch GmbH

Robert Bosch GmbH - Overview
Robert Bosch GmbH - Product / Service
Robert Bosch GmbH - Key news
Robert Bosch GmbH - Key offerings
SWOT

15.16 Texas Instruments Inc.

Texas Instruments Inc. - Overview
Texas Instruments Inc. - Business segments
Texas Instruments Inc. - Key offerings
Texas Instruments Inc. - Segment focus
SWOT

15.17 Valeo SA

Valeo SA - Overview
Valeo SA - Business segments
Valeo SA - Key news
Valeo SA - Key offerings
Valeo SA - Segment focus
SWOT

15.18 ZF Friedrichshafen AG

ZF Friedrichshafen AG - Overview
ZF Friedrichshafen AG - Business segments
ZF Friedrichshafen AG - Key news
ZF Friedrichshafen AG - Key offerings
ZF Friedrichshafen AG - Segment focus
SWOT

16. Appendix

16.1 Scope of the report

Market definition
Objectives
Notes and caveats

16.2 Inclusions and exclusions checklist

Inclusions checklist
Exclusions checklist

16.3 Currency conversion rates for US$

16.4 Research methodology

16.5 Data procurement

Information sources

16.6 Data validation

16.7 Validation techniques employed for market sizing

16.8 Data synthesis

16.9 360 degree market analysis

16.10 List of abbreviations

Research Methodology

Technavio presents a detailed picture of the market by way of study, synthesis, and summation of data from multiple sources. The analysts have presented the various facets of the market with a particular focus on identifying the key industry influencers. The data thus presented is comprehensive, reliable, and the result of extensive research, both primary and secondary.

INFORMATION SOURCES

Primary sources

  • Manufacturers and suppliers
  • Channel partners
  • Industry experts
  • Strategic decision makers

Secondary sources

  • Industry journals and periodicals
  • Government data
  • Financial reports of key industry players
  • Historical data
  • Press releases

DATA ANALYSIS

Data Synthesis

  • Collation of data
  • Estimation of key figures
  • Analysis of derived insights

Data Validation

  • Triangulation with data models
  • Reference against proprietary databases
  • Corroboration with industry experts

REPORT WRITING

Qualitative

  • Market drivers
  • Market challenges
  • Market trends
  • Five forces analysis

Quantitative

  • Market size and forecast
  • Market segmentation
  • Geographical insights
  • Competitive landscape

Interested in this report?

Get your sample now to see our research methodology and insights!

Download Now

Frequently Asked Questions

Automatic Autonomous Emergency Braking market growth will increase by USD 66835.3 million during 2026-2030 .

The Automatic Autonomous Emergency Braking market is expected to grow at a CAGR of 18.5% during 2026-2030 .

Automatic Autonomous Emergency Braking market is segmented by Type (Low speed AEB, High speed AEB) Technology (Radar based AEB, Camera based AEB, LiDAR based AEB, Ultrasonic based AEB, Others) Vehicle type (Passenger cars, Commercial vehicles, Others)

AISIN Corp., Analog Devices Inc., Aptiv Plc, Autoliv Inc., Continental AG, DENSO Corp., HELLA GmbH and Co. KGaA, Hitachi Astemo Ltd., Hyundai Mobis Co. Ltd., Infineon Technologies AG, Magna International Inc., Mobileye Technologies Ltd., NXP Semiconductors NV, Robert Bosch GmbH, Teledyne FLIR LLC, Texas Instruments Inc., Valeo SA, Veoneer Inc., ZF Friedrichshafen AG are a few of the key vendors in the Automatic Autonomous Emergency Braking market.

APAC will register the highest growth rate of 39.6% among the other regions. Therefore, the Automatic Autonomous Emergency Braking market in APAC is expected to garner significant business opportunities for the vendors during the forecast period.

China, India, Japan, South Korea, Australia, Indonesia, Germany, UK, France, Italy, The Netherlands, Spain, US, Canada, Mexico, Brazil, Argentina, Colombia, Saudi Arabia, UAE, South Africa, Israel, Turkey

  • Stringent government regulations and proactive safety mandates is the driving factor this market.

The Automatic Autonomous Emergency Braking market vendors should focus on grabbing business opportunities from the Type segment as it accounted for the largest market share in the base year.