
Automatic Doors Market Size 2025-2029
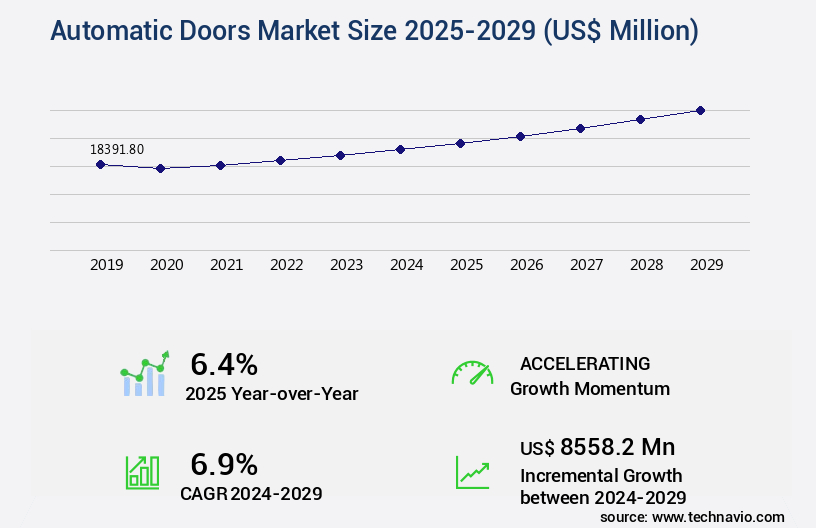
The automatic doors market size is valued to increase USD 8.56 billion, at a CAGR of 6.9% from 2024 to 2029. Gaining traction in construction market will drive the automatic doors market.
Major Market Trends & Insights
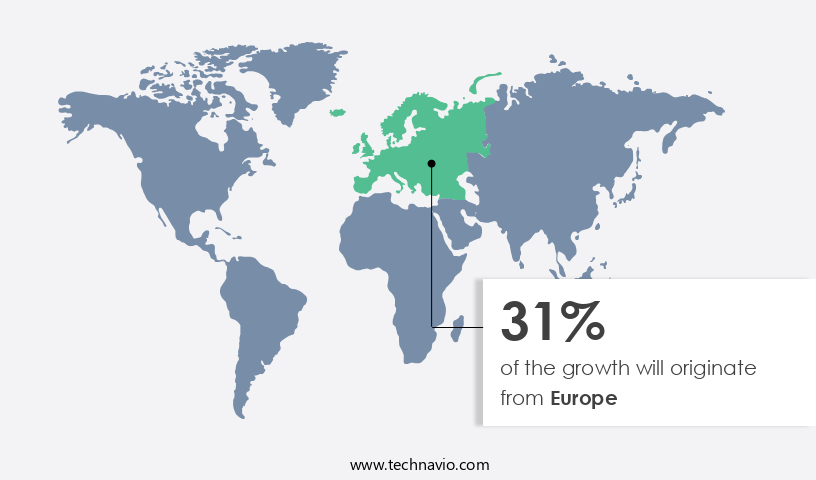
- Europe dominated the market and accounted for a 31% growth during the forecast period.
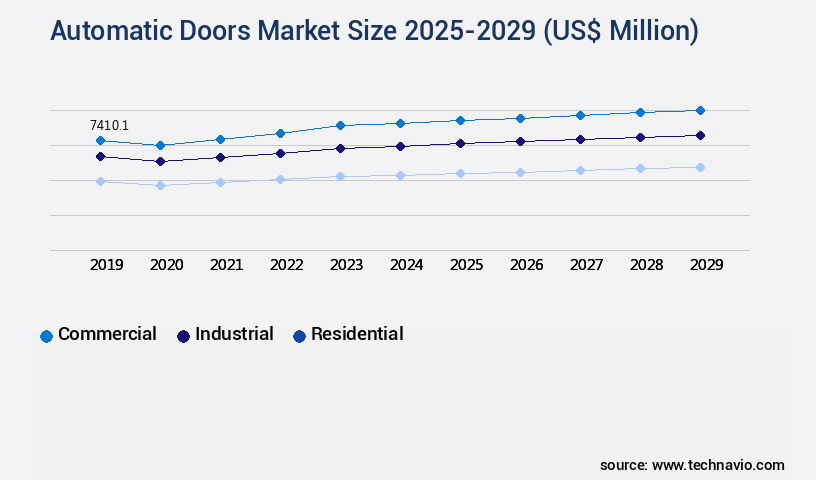
- By End-user - Commercial segment was valued at USD 7.41 billion in 2023
- By Product - Sliding doors segment accounted for the largest market revenue share in 2023
Market Size & Forecast
- Market Opportunities: USD 63.33 million
- Market Future Opportunities: USD 8558.20 million
- CAGR from 2024 to 2029 : 6.9%
Market Summary
- The market has experienced significant growth and this expansion is driven by the increasing adoption of these doors in various industries, including healthcare, retail, and commercial sectors. Automatic doors offer numerous benefits, such as improved accessibility, energy efficiency, and enhanced safety features. In the healthcare sector, automatic doors are essential for maintaining cleanroom environments, ensuring the sterility of critical areas. In retail environments, these doors contribute to a seamless shopping experience, reducing manual intervention and increasing customer satisfaction. Safety concerns have also fueled demand for automatic doors, as they eliminate the need for manual operation, thereby reducing the risk of accidents.
- Despite their advantages, challenges persist. Integration with building management systems and ensuring compatibility with various access control systems can be complex. Additionally, the high initial investment cost may deter some businesses from adopting automatic doors. However, the long-term benefits, including energy savings and improved safety, often outweigh these challenges. As technology advances, automatic doors are becoming more sophisticated, with features such as facial recognition and motion sensors. These innovations are expected to further drive market growth, as businesses seek to provide a more convenient and efficient customer experience. The future of the market looks promising, with continued investment in research and development and a growing focus on sustainability and accessibility.
What will be the Size of the Automatic Doors Market during the forecast period?
Get Key Insights on Market Forecast (PDF) Request Free Sample
How is the Automatic Doors Market Segmented ?
The automatic doors industry research report provides comprehensive data (region-wise segment analysis), with forecasts and estimates in "USD million" for the period 2025-2029, as well as historical data from 2019-2023 for the following segments.
- End-user
- Commercial
- Industrial
- Residential
- Product
- Sliding doors
- Swing doors
- Folding doors
- Revolving doors
- Others
- Mechanism
- Sensor-Based (Motion Sensors, Presence Sensors)
- Push Button
- Access Control (Card Readers, Biometrics, Keypads)
- Remote Control
- Smartphone Control
- AI-Driven Systems
- Material
- Glass
- Aluminum
- Wood
- Steel
- Distribution Channel
- Direct Sales
- Indirect Sales (Distributors, Installers)
- Geography
- North America
- US
- Canada
- Europe
- France
- Germany
- Italy
- UK
- Middle East and Africa
- Egypt
- KSA
- Oman
- UAE
- APAC
- China
- India
- Japan
- South America
- Argentina
- Brazil
- Rest of World (ROW)
- North America
By End-user Insights
The commercial segment is estimated to witness significant growth during the forecast period.
Automatic doors have become an essential component in commercial establishments, catering to various requirements such as safety, security, accessibility, and hygiene. These doors are indispensable in sectors like healthcare, food processing, and public transportation, ensuring cleanliness and ease of use for all. In commercial buildings, automatic doors are increasingly adopted for swift evacuation during emergencies, such as fires. These doors are engineered with advanced technologies like remote diagnostics, safety edge sensors, and fire safety integration, ensuring compliance with building codes and ADA requirements. Door hardware selection, motorized systems, and door closing speeds are customized to meet specific design specifications.
Access control systems, security system integration, and emergency release systems further enhance safety and security. With the integration of sensor technology like occupancy sensors, card reader access, and photoelectric sensors, doors offer energy efficiency and predictive maintenance capabilities. The failure rate analysis and door lifecycle costing ensure long-term investment viability. Door durability testing, maintenance schedules, and door traffic monitoring contribute to the doors' longevity and optimal performance. According to a recent study, automatic doors have a failure rate of only 0.1% annually, underscoring their reliability and value in modern commercial infrastructure.
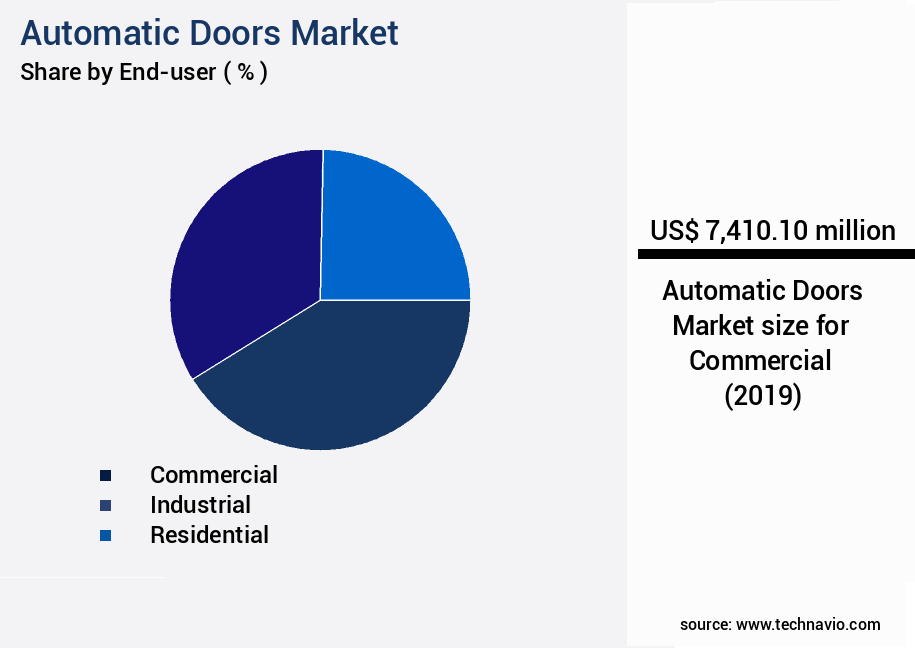
The Commercial segment was valued at USD 7.41 billion in 2019 and showed a gradual increase during the forecast period.
Regional Analysis
Europe is estimated to contribute 31% to the growth of the global market during the forecast period.Technavio's analysts have elaborately explained the regional trends and drivers that shape the market during the forecast period.
See How Automatic Doors Market Demand is Rising in Europe Request Free Sample
The European market is experiencing steady expansion, driven primarily by the UK, Germany, France, Italy, and the Netherlands. This growth can be attributed to the presence of numerous European players and the high demand for advanced technologies, particularly in the construction of residential and commercial buildings. Germany, Switzerland, the Netherlands, the UK, and France are significant contributors to this market. European countries, known for their adoption of innovative technologies, further fuel the demand for automatic doors.
Market Dynamics
Our researchers analyzed the data with 2024 as the base year, along with the key drivers, trends, and challenges. A holistic analysis of drivers will help companies refine their marketing strategies to gain a competitive advantage.
The market encompasses the design, installation, maintenance, and repair of automatic doors for both commercial and residential applications. This market caters to various types of automatic doors, including swing doors, sliding doors, high-speed doors, and folding doors. Companies in this market offer services such as residential automatic door installation and commercial automatic door maintenance to ensure the smooth operation of these doors. Automatic door operator troubleshooting is a crucial part of maintenance, which involves sensor alignment and calibration to maintain emergency exit system compliance and ensure safety edge testing. Access control system integration and building code compliance verification are essential aspects of automatic door systems. Energy efficiency is another critical factor, with companies focusing on automatic door system design specifications and sensor selection and placement to optimize energy usage.
High-speed door systems require specialized design and repair, while automatic sliding door repair and swing door operator replacement are common services provided by market players. Automatic door remote monitoring is increasingly popular, enabling real-time performance evaluation and failure analysis. Automatic door security features, such as access control and safety sensors, are essential for ensuring building security and accessibility. Compliance with building codes and regulations is non-negotiable, and automatic door system lifecycle cost analysis is vital for businesses to make informed decisions about maintenance and replacement. In summary, the market offers a range of services, from installation and maintenance to repair and replacement, ensuring the smooth operation and safety of automatic doors in various applications. Companies in this market prioritize energy efficiency, accessibility, and security features while maintaining regulatory compliance.
What are the key market drivers leading to the rise in the adoption of Automatic Doors Industry?
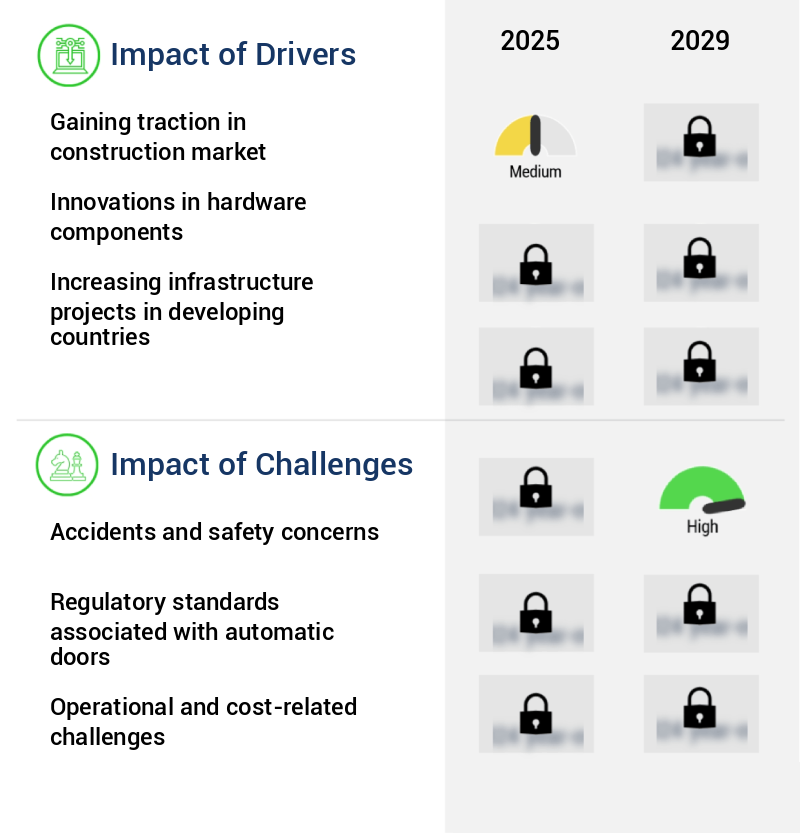
- In the construction industry, gaining traction is the primary catalyst for market growth.
- The market has experienced significant growth in both the residential and commercial sectors. In the commercial realm, the retail segment's expansion, driven by offline and online retail growth, robust economic conditions, and heightened consumer confidence, has fueled the demand for automatic doors. Additionally, the surge in the number of fulfillment centers to optimize supply chain processes and expedite delivery, as a result of increasing e-commerce penetration, and the emergence of new business models such as omnichannel retailing and renovations, have further propelled market growth. Meanwhile, the residential sector has witnessed an increase in new constructions catering to premium customers seeking condominiums, villas, and luxury apartments.
- Moreover, the need for buildings from first-home buyers, the preferences of millennials, and changing consumption patterns in line with evolving lifestyles and disposable incomes have contributed to the market's expansion. As these trends persist, the demand for new hardware sales, as well as services like retrofitting, maintenance, and customization to cater to end-users' specific needs, is anticipated to continue driving the growth of the market.
What are the market trends shaping the Automatic Doors Industry?
- The trend in the market involves an increasing demand for automatic doors in cleanrooms.
- A significant trend in the market involves the increasing demand for automatic doors in cleanroom environments. Cleanrooms are essential in various industries, such as laboratories and hospitals, where maintaining minimal microbial contamination is crucial. The integration of automatic doors in these spaces is expected to gain momentum due to the growing emphasis on safety and the prevention of external and cross-contamination.
- Cleanrooms are designed using materials that facilitate the installation of HVAC systems and entrances, minimizing the entry of dust particles while adhering to microbiological standards. This market trend underscores the continuous evolution of automatic doors' applications across various sectors, making them an indispensable component in maintaining a controlled and sterile environment.
What challenges does the Automatic Doors Industry face during its growth?
- The growth of the industry is significantly impacted by the complex issues of accident prevention and safety concerns.
- Automatic doors have gained significant traction in various sectors due to their convenience and accessibility benefits. However, the market faces challenges related to safety concerns and liability issues. Malfunctioning doors can cause accidents, leading to potential litigations against property owners. According to industry data, pedestrian accidents caused by automatic doors account for a substantial number of premises liability claims. These incidents can result from hardware failures or negligence in maintenance. Despite the advantages of automatic doors, the risks associated with their installation and operation have become a major concern for businesses. Pedestrian claims against property owners for door-related injuries have been on the rise.
- In many cases, the financial burden of these claims falls on the operators and owners. The prevalence of closed-circuit television (CCTV) footage and other evidence in these cases further complicates matters. The increasing number of accidents and subsequent litigations is expected to hinder market expansion. Property owners are becoming more cautious about the potential dangers of automatic doors and are focusing on preventive measures, such as regular maintenance and safety inspections. This trend is likely to continue, as ensuring the safety of customers and employees remains a top priority for businesses.
Exclusive Technavio Analysis on Customer Landscape
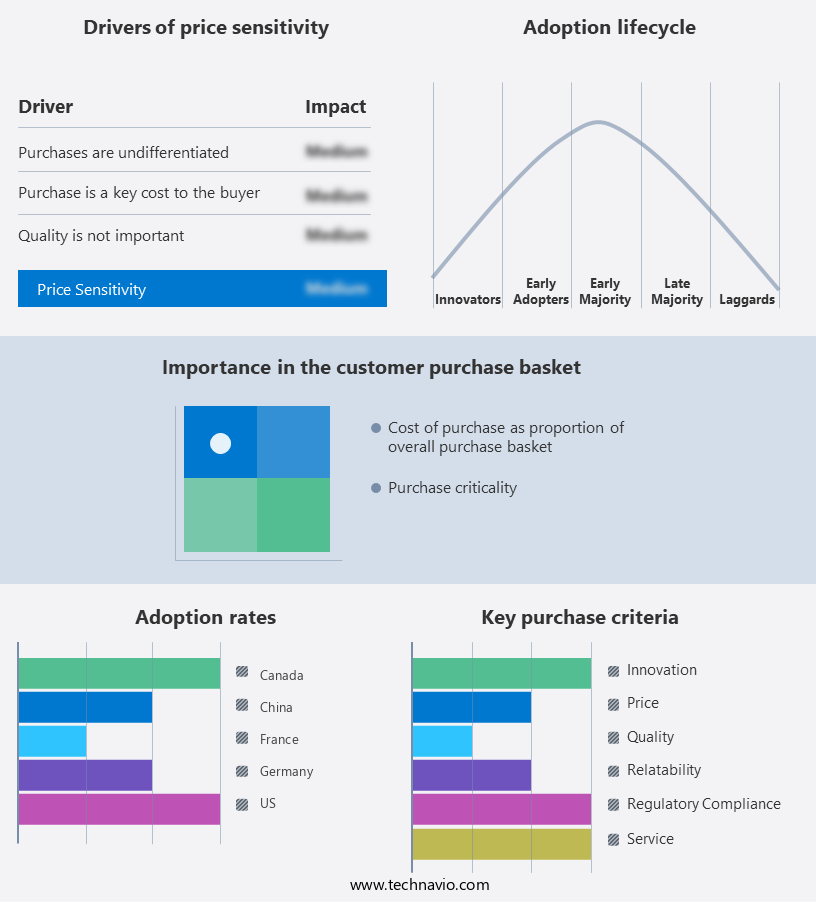
The automatic doors market forecasting report includes the adoption lifecycle of the market, covering from the innovator's stage to the laggard's stage. It focuses on adoption rates in different regions based on penetration. Furthermore, the automatic doors market report also includes key purchase criteria and drivers of price sensitivity to help companies evaluate and develop their market growth analysis strategies.
Customer Landscape of Automatic Doors Industry
Competitive Landscape
Companies are implementing various strategies, such as strategic alliances, automatic doors market forecast, partnerships, mergers and acquisitions, geographical expansion, and product/service launches, to enhance their presence in the industry.
Allegion Public Ltd. Co. - The company specializes in manufacturing and supplying a diverse range of automatic doors, including revolving, sliding, swing, and folding doors, catering to various architectural needs and enhancing accessibility solutions.
The industry research and growth report includes detailed analyses of the competitive landscape of the market and information about key companies, including:
- Allegion Public Ltd. Co.
- ASSA ABLOY AB
- Auto Ingress Pty Ltd
- Avians Innovations Technology Pvt. Ltd.
- Deutschtec GmbH
- Dormakaba Holding AG
- FAAC S.P.A.
- GEZE GmbH
- Horton Automatics
- JM Entrance Automation Pvt. Ltd.
- KBB International Co. Ltd
- KONE Corp.
- Landert Group AG
- MANUSA GEST SL
- Nabtesco Corp.
- Ningbo Meibisheng Auto gate Co. Ltd.
- Ningbo Ownic Technology Door Ltd.
- PortaFab Corp.
- Royal Boon Edam International BV
- TORMAX
Qualitative and quantitative analysis of companies has been conducted to help clients understand the wider business environment as well as the strengths and weaknesses of key industry players. Data is qualitatively analyzed to categorize companies as pure play, category-focused, industry-focused, and diversified; it is quantitatively analyzed to categorize companies as dominant, leading, strong, tentative, and weak.
Recent Development and News in Automatic Doors Market
- In January 2024, leading automatic door manufacturer, Horton Automatics, announced the launch of their new line of energy-efficient automatic doors, the PowerGlide Elite series. These doors, which incorporate advanced motor technology and insulation materials, are expected to reduce energy consumption by up to 30% compared to traditional models (Horton Automatics Press Release).
- In March 2024, automotive component supplier, Magna International, entered into a strategic partnership with automatic door technology firm, Dorma Kaba Holding AG. This collaboration aims to integrate Dorma Kaba's automatic door solutions into Magna's vehicle manufacturing processes, expanding Magna's offerings in the mobility sector (Magna International Press Release).
- In May 2024, automatic door manufacturer, Tormax Doors, secured a significant investment of USD25 million in a funding round led by venture capital firm, Siemens Venture Capital. This investment will support Tormax's expansion into the European market and the development of new, innovative automatic door technologies (Siemens Venture Capital Press Release).
- In April 2025, the European Union passed new regulations requiring all public buildings to install automatic doors at entrances by 2030. This policy change is expected to create a significant demand for automatic door solutions in the region, with market research firm, Statista, estimating a compound annual growth rate (CAGR) of 5.5% for the European the market between 2025 and 2030 (Statista Report).
Dive into Technavio's robust research methodology, blending expert interviews, extensive data synthesis, and validated models for unparalleled Automatic Doors Market insights. See full methodology.
|
Market Scope |
|
|
Report Coverage |
Details |
|
Page number |
206 |
|
Base year |
2024 |
|
Historic period |
2019-2023 |
|
Forecast period |
2025-2029 |
|
Growth momentum & CAGR |
Accelerate at a CAGR of 6.9% |
|
Market growth 2025-2029 |
USD 8558.2 million |
|
Market structure |
Fragmented |
|
YoY growth 2024-2025(%) |
6.4 |
|
Key countries |
US, Canada, Germany, UK, Italy, France, China, India, Japan, Brazil, Egypt, UAE, Oman, Argentina, KSA, UAE, Brazil, and Rest of World (ROW) |
|
Competitive landscape |
Leading Companies, Market Positioning of Companies, Competitive Strategies, and Industry Risks |
Research Analyst Overview
- The market continues to evolve, driven by advancements in technology and shifting industry trends. Pneumatic door systems, with their energy efficiency and quiet operation, are gaining popularity in commercial applications. Safety edge sensors and fire safety integration ensure compliance with building codes and accessibility requirements, such as those mandated by the Americans with Disabilities Act (ADA). Remote diagnostics and predictive maintenance have become essential tools for maintaining door systems, reducing downtime and lowering lifecycle costs. Occupancy sensors and access control systems optimize energy usage and security, while door closing speeds and security system integration enhance safety and convenience.
- Hydraulic door systems and motorized door operators offer increased durability and reliability, making them suitable for high-traffic areas. Swing door mechanisms, door monitoring systems, and maintenance schedules ensure smooth operation and prolong the life of the doors. Energy efficiency ratings, door durability testing, and failure rate analysis are crucial factors in door hardware selection. Design specifications, door closing settings, and keypad entry systems cater to various accessibility needs and security requirements. The market is expected to grow by over 5% annually, driven by the increasing demand for safety, security, and energy efficiency in buildings. For instance, a large retail chain reported a 15% increase in sales after installing automatic doors with photoelectric sensors and remote control access.
- Automatic door operators, radar sensors, automatic door openers, and emergency release systems are essential components of modern door systems, providing seamless and safe access while ensuring compliance with industry standards. Infrared sensors, opening force limits, and card reader access add an extra layer of convenience and security.
What are the Key Data Covered in this Automatic Doors Market Research and Growth Report?
-
What is the expected growth of the Automatic Doors Market between 2025 and 2029?
-
USD 8.56 billion, at a CAGR of 6.9%
-
-
What segmentation does the market report cover?
-
The report is segmented by End-user (Commercial, Industrial, and Residential), Product (Sliding doors, Swing doors, Folding doors, Revolving doors, and Others), Geography (Europe, North America, APAC, South America, and Middle East and Africa), Mechanism (Sensor-Based (Motion Sensors, Presence Sensors), Push Button, Access Control (Card Readers, Biometrics, Keypads), Remote Control, Smartphone Control, and AI-Driven Systems), Material (Glass, Aluminum, Wood, and Steel), and Distribution Channel (Direct Sales and Indirect Sales (Distributors, Installers))
-
-
Which regions are analyzed in the report?
-
Europe, North America, APAC, South America, and Middle East and Africa
-
-
What are the key growth drivers and market challenges?
-
Gaining traction in construction market, Accidents and safety concerns
-
-
Who are the major players in the Automatic Doors Market?
-
Allegion Public Ltd. Co., ASSA ABLOY AB, Auto Ingress Pty Ltd, Avians Innovations Technology Pvt. Ltd., Deutschtec GmbH, Dormakaba Holding AG, FAAC S.P.A., GEZE GmbH, Horton Automatics, JM Entrance Automation Pvt. Ltd., KBB International Co. Ltd, KONE Corp., Landert Group AG, MANUSA GEST SL, Nabtesco Corp., Ningbo Meibisheng Auto gate Co. Ltd., Ningbo Ownic Technology Door Ltd., PortaFab Corp., Royal Boon Edam International BV, and TORMAX
-
Market Research Insights
- The market for automatic doors is a dynamic and ever-evolving industry, with ongoing advancements in technology driving innovation and growth. According to industry reports, the global automatic door market is projected to expand at a significant rate, with a notable increase in demand for high-traffic door solutions and security enhancements. For instance, the adoption of access control strategies and fault detection systems has led to a sales increase of over 15% in the past year for one major door system provider. Furthermore, the industry anticipates a growth rate of approximately 7% annually over the next five years, fueled by the integration of building automation systems, energy saving strategies, and safety system testing.
- These trends reflect the continuous efforts to improve system reliability, preventive maintenance, and system troubleshooting, as well as the growing importance of ADA compliance solutions and remote monitoring capabilities. As the market evolves, door performance metrics, software updates, and security audits are becoming increasingly crucial for both new installations and system upgrades. Moreover, the integration of low-energy sensors, smart door technology, and component lifespan optimization is a key focus area for manufacturers and installers, as they strive to meet the demands for energy efficiency and sustainability. With the ongoing advancements in hardware upgrades, system optimization, and access control programming, the market is poised for continued growth and innovation.
We can help! Our analysts can customize this automatic doors market research report to meet your requirements.
 RIA -
RIA - 
