Automatic Generation Control Market Size 2026-2030
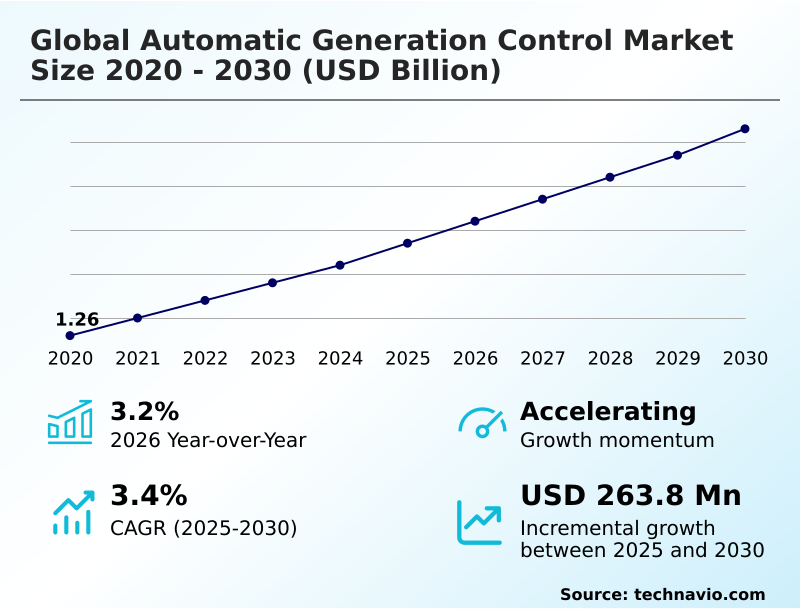
The automatic generation control market size is valued to increase by USD 263.8 million, at a CAGR of 3.4% from 2025 to 2030. Integration of large-scale renewable energy sources and grid decentralization will drive the automatic generation control market.
Major Market Trends & Insights
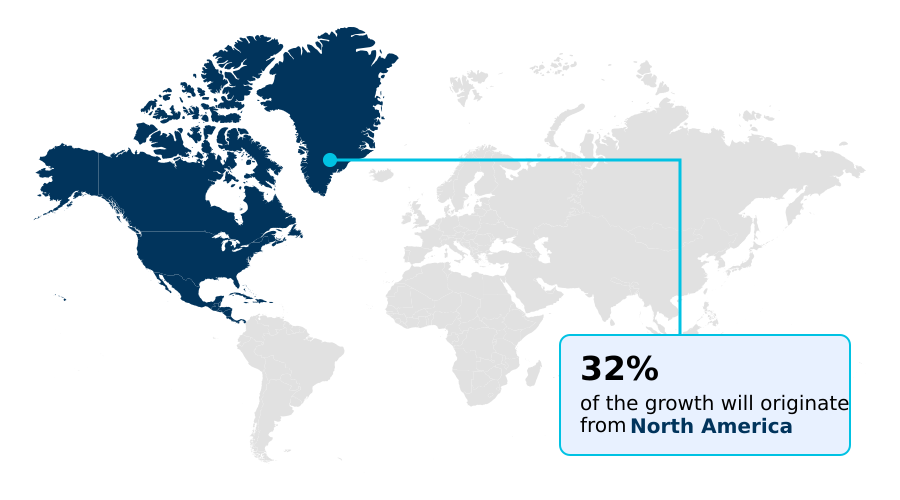
- North America dominated the market and accounted for a 31.7% growth during the forecast period.
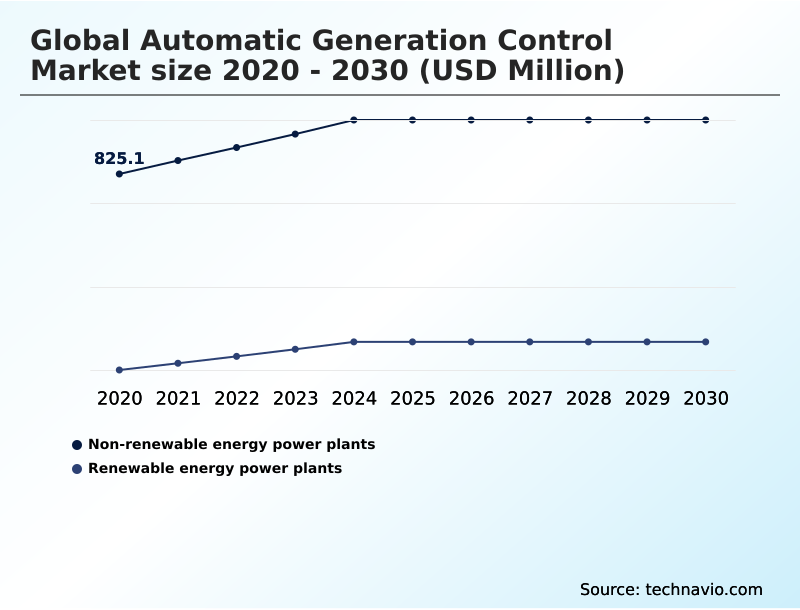
- By Application - Non-renewable energy power plants segment was valued at USD 932.4 million in 2024
- By Type - Turbine governor control segment accounted for the largest market revenue share in 2024
Market Size & Forecast
- Market Opportunities: USD 471.7 million
- Market Future Opportunities: USD 263.8 million
- CAGR from 2025 to 2030 : 3.4%
Market Summary
- The automatic generation control market is undergoing a profound transformation, moving from a supporting role in legacy power systems to a central nervous system for modern, decentralized grids. The fundamental driver of this evolution is the large-scale renewable energy integration, which introduces volatility that traditional grid management techniques cannot handle.
- Consequently, sophisticated automatic generation control systems are critical for ensuring grid stability and managing power frequency. These systems leverage real-time telemetry and advanced algorithms for precise load frequency control and economic dispatch.
- For instance, in a scenario with high wind power penetration, an AGC system can instantly signal a battery energy storage system to absorb excess generation or a gas peaker plant to ramp up, maintaining the generation-load balance within milliseconds. This rapid response, which defines modern power system automation, prevents cascading grid failures.
- The market is also heavily influenced by smart grid modernization, which provides the high-fidelity data necessary for predictive load balancing. However, this digitalization simultaneously elevates cybersecurity risks, demanding the implementation of robust, multi-layered security protocols to protect critical infrastructure from potential threats, a key focus for operators.
What will be the Size of the Automatic Generation Control Market during the forecast period?
Get Key Insights on Market Forecast (PDF) Get Free Sample
How is the Automatic Generation Control Market Segmented?
The automatic generation control industry research report provides comprehensive data (region-wise segment analysis), with forecasts and estimates in "USD million" for the period 2026-2030, as well as historical data from 2020-2024 for the following segments.
- Application
- Non-renewable energy power plants
- Renewable energy power plants
- Type
- Turbine governor control
- Load frequency control
- Economic dispatch
- Component
- Equipment
- Solutions
- Services
- End-user
- Utilities
- Industrial
- Commercial
- Geography
- APAC
- China
- Japan
- India
- North America
- US
- Canada
- Mexico
- Europe
- Germany
- France
- UK
- South America
- Brazil
- Argentina
- Middle East and Africa
- Saudi Arabia
- UAE
- South Africa
- Rest of World (ROW)
- APAC
By Application Insights
The non-renewable energy power plants segment is estimated to witness significant growth during the forecast period.
In the segment of non-renewable energy power plants, automatic generation control remains a critical component for maintaining grid stability through bulk power regulation.
The application of automatic generation control in these environments focuses on precise turbine governor control and load frequency control to manage the inertia inherent in large rotating masses.
As the global energy mix shifts, many utilities are prioritizing the modernization of aging thermal infrastructure with digital automatic generation control modules to enhance operational efficiency.
Advanced systems, integrating supervisory control and data acquisition, are capable of improving fuel consumption by up to 5%.
This optimization ensures these plants provide reliable primary frequency response, supporting the grid during the integration of intermittent power sources and maintaining overall power quality.
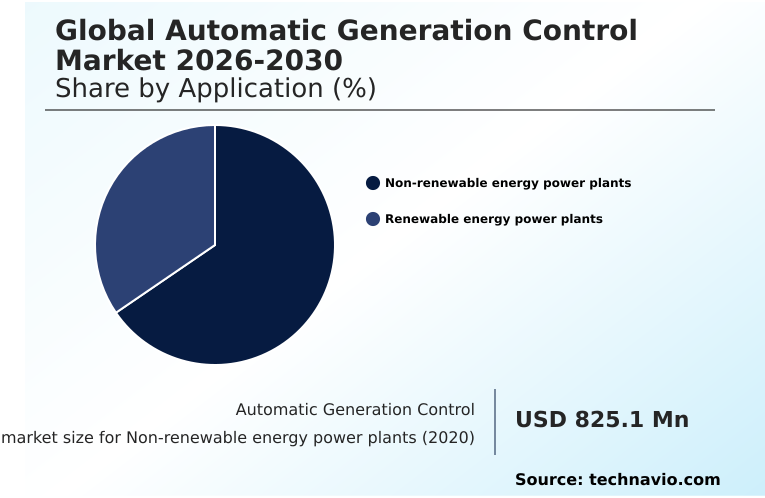
The Non-renewable energy power plants segment was valued at USD 932.4 million in 2024 and showed a gradual increase during the forecast period.
Regional Analysis
North America is estimated to contribute 31.7% to the growth of the global market during the forecast period.Technavio’s analysts have elaborately explained the regional trends and drivers that shape the market during the forecast period.
See How Automatic Generation Control Market Demand is Rising in North America Get Free Sample
The geographic landscape of the automatic generation control market is shaped by regional energy policies and infrastructure priorities. North America, which accounts for over 31% of the market's incremental growth, focuses on modernizing its aging grid.
Here, the emphasis is on smart grid modernization and integrating cybersecurity-hardened control systems to enhance grid resilience and comply with strict NERC CIP standards.
In contrast, the APAC region, led by countries like China and India, is driven by the rapid build-out of new generation capacity.
This region prioritizes the large-scale renewable energy integration and development of high-voltage direct current transmission lines, requiring advanced power system automation to manage a non-synchronous grid.
These infrastructure projects have improved grid efficiency by nearly 12% in some newly developed corridors.
In both regions, the goal is to ensure grid stability and manage power frequency effectively, though their approaches reflect different stages of grid maturity and decarbonization targets.
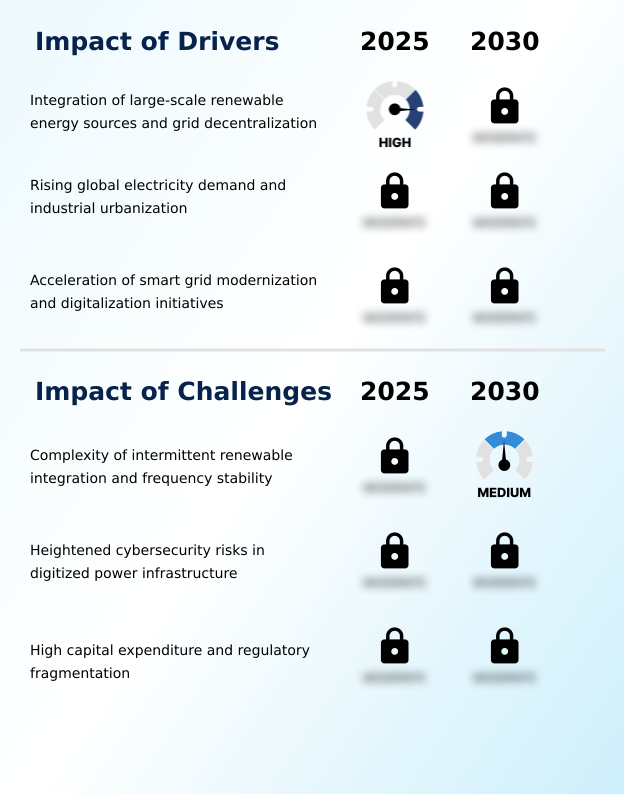
Market Dynamics
Our researchers analyzed the data with 2025 as the base year, along with the key drivers, trends, and challenges. A holistic analysis of drivers will help companies refine their marketing strategies to gain a competitive advantage.
- The evolution of the global automatic generation control market is increasingly defined by its ability to address specialized use cases through advanced technology. The foundational challenge of automatic generation control for renewable energy is being met with sophisticated software-defined automatic generation control platforms that manage the intermittency of solar and wind.
- In parallel, load frequency control in smart grids is becoming more granular, leveraging real-time data to improve system-wide balance. For legacy assets, turbine governor control modernization is a key focus, extending operational life while improving response times.
- A significant development is the rise of agc systems for battery energy storage, which use the fast-response capabilities of BESS for precise primary frequency response. This trend is complemented by the use of frequency regulation with virtual synchronous machines, which allows inverter-based resources to mimic the stabilizing properties of traditional generators.
- As grids become more interconnected and intelligent, managing grid inertia with agc and integrating ders with automatic generation control are critical for stability. This complexity necessitates robust cybersecurity for automatic generation control to protect against emerging threats and ensure nerc cip compliance for agc systems.
- Furthermore, a digital twin for agc simulation allows operators to test complex scenarios, from the impact of ev charging on agc to ensuring agc for microgrid stability, making predictive maintenance in agc systems more effective.
- The move towards agc in decentralized power systems, underpinned by real-time monitoring for area control error and sophisticated tie-line bias control strategies, marks a fundamental shift in managing modern power networks. This is especially true for the deployment of secondary frequency control with renewables, which has proven to be more effective than traditional methods.
What are the key market drivers leading to the rise in the adoption of Automatic Generation Control Industry?
- The integration of large-scale renewable energy sources, coupled with the ongoing decentralization of the grid, serves as a primary driver for the market's growth.
- Market growth is primarily driven by the global push for smart grid modernization and the relentless rise in electricity demand.
- The deployment of smart meters and digital substations is providing the high-fidelity data needed for advanced distribution management, improving data resolution by up to 40% in some utility deployments. This enables more precise power flow optimization and demand-side management.
- The expansion of energy-intensive infrastructure, such as data centers and EV charging networks, necessitates robust frequency response services to maintain the generation-load balance.
- Government-backed initiatives promoting grid digitalization are accelerating the replacement of legacy systems, with modern automated platforms increasing overall power system efficiency by as much as 10% through improved generation dispatch and reduced transmission losses.
What are the market trends shaping the Automatic Generation Control Industry?
- The escalating integration of intermittent renewable energy sources into power grids is a defining market trend. This shift necessitates advanced control systems to manage grid volatility and ensure stability.
- Key market trends are centered on the escalating integration of intermittent renewable energy sources and the digitalization of grid management. The rise of battery energy storage systems is transformative, offering near-instantaneous fast frequency response, with some systems reacting in under 50 milliseconds, which is an order of magnitude faster than conventional generators. This capability is critical for secondary frequency control.
- Furthermore, the adoption of virtual synchronous machines allows solar and wind farms to provide synthetic rotational inertia, enhancing grid stability. Advanced systems now reduce area control error by over 30% through predictive algorithms, optimizing dispatchable loads and improving overall power quality.
- The trend towards grid-forming technology is also accelerating, ensuring voltage stability in low-inertia environments and supporting the broader energy transition.
What challenges does the Automatic Generation Control Industry face during its growth?
- The technical complexity of integrating intermittent renewable energy sources while maintaining frequency stability poses a significant challenge to industry growth.
- The primary market challenge is managing grid stability in systems with diminishing system inertia due to the phase-out of traditional synchronous generators. This lack of rotational inertia makes the grid more vulnerable to frequency deviations. The technical complexity of integrating inverter-based technologies at scale requires sophisticated real-time telemetry and control.
- Simultaneously, the digitalization of grid operations has heightened cybersecurity risks, with threats to control systems increasing by over 20% in the last year, necessitating costly investments in multi-layered security. High capital expenditure for modernizing infrastructure and fragmented regulatory frameworks further restrain rapid adoption.
- For many utilities, the upfront cost of deploying advanced control systems, which can be double that of conventional upgrades, remains a significant hurdle to achieving widespread grid code compliance.
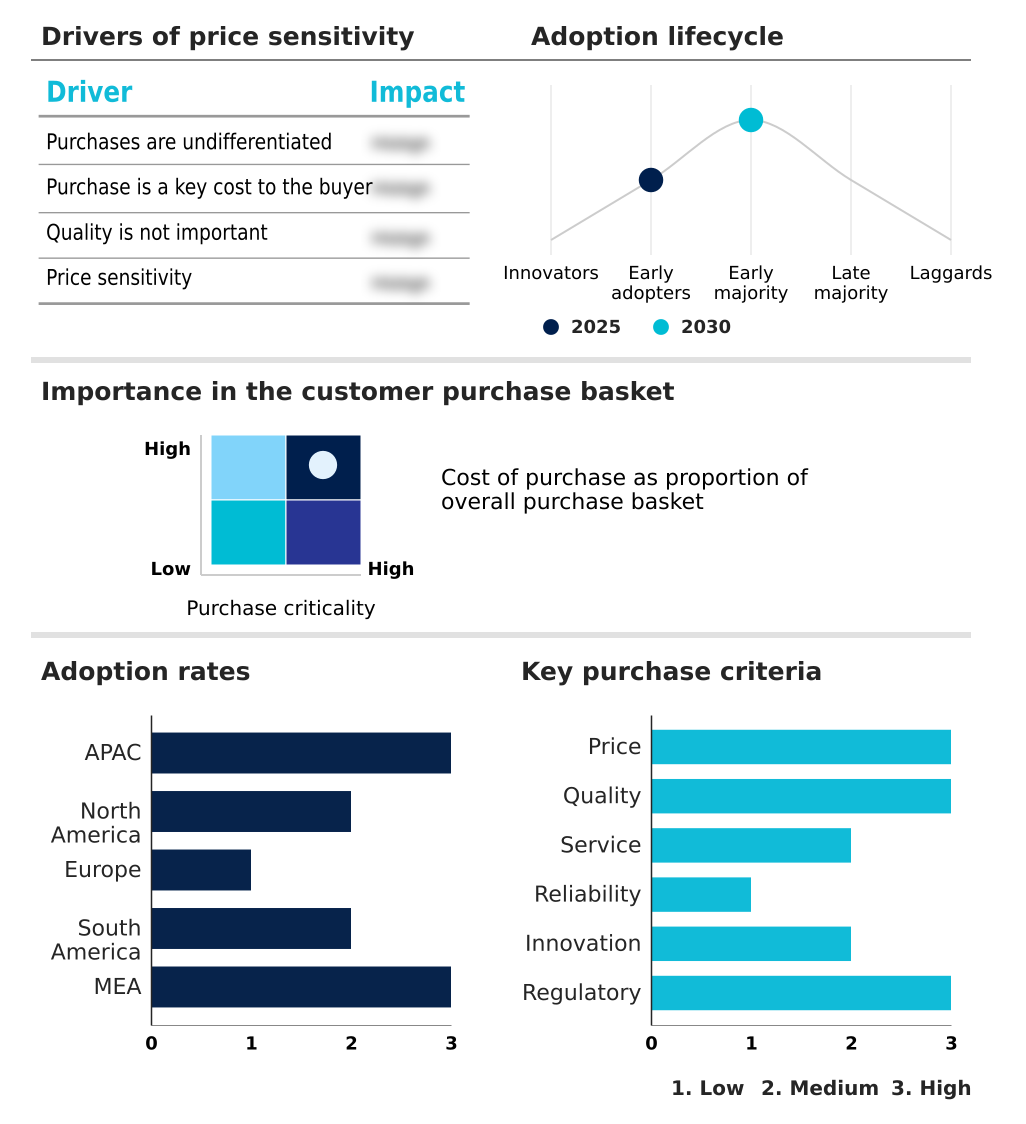
Exclusive Technavio Analysis on Customer Landscape
The automatic generation control market forecasting report includes the adoption lifecycle of the market, covering from the innovator’s stage to the laggard’s stage. It focuses on adoption rates in different regions based on penetration. Furthermore, the automatic generation control market report also includes key purchase criteria and drivers of price sensitivity to help companies evaluate and develop their market growth analysis strategies.
Customer Landscape of Automatic Generation Control Industry
Competitive Landscape
Companies are implementing various strategies, such as strategic alliances, automatic generation control market forecast, partnerships, mergers and acquisitions, geographical expansion, and product/service launches, to enhance their presence in the industry.
ABB Ltd. - Key offerings include advanced automatic generation control, energy management systems, and distributed control solutions designed to optimize power grid stability and operational efficiency.
The industry research and growth report includes detailed analyses of the competitive landscape of the market and information about key companies, including:
- ABB Ltd.
- Andritz AG
- DEIF AS
- Emerson Electric Co.
- ENERCON GmbH
- ETAP Operation Technology Inc.
- General Electric Co.
- Hitachi Ltd.
- Honeywell International Inc.
- Hubbell Inc.
- Larsen and Toubro Ltd.
- Mitsubishi Electric Corp.
- Regal Beloit Corp.
- Rockwell Automation Inc.
- Schneider Electric SE
- Schweitzer Engineering
- Siemens AG
- Suzlon Energy Ltd.
- Wartsila Corp.
- Yokogawa Electric Corp.
Qualitative and quantitative analysis of companies has been conducted to help clients understand the wider business environment as well as the strengths and weaknesses of key industry players. Data is qualitatively analyzed to categorize companies as pure play, category-focused, industry-focused, and diversified; it is quantitatively analyzed to categorize companies as dominant, leading, strong, tentative, and weak.
Recent Development and News in Automatic generation control market
- In May, 2025, Siemens AG launched its AI-driven Spectrum Power X platform, an automatic generation control system featuring a digital twin for real-time grid simulation, which is designed to improve frequency regulation for grids with over 50% renewable penetration.
- In March, 2025, Grid Controller of India Ltd. finalized a new grid code mandating all renewable energy projects over 50 MW and all battery energy storage systems over 10 MW to be equipped with automatic generation control capabilities to participate in ancillary services markets, effective January 2026.
- In December, 2024, ABB Ltd. completed its acquisition of a leading European cybersecurity firm, integrating its industrial control system threat detection technology into the ABB Ability Energy Management System to meet NERC CIP standards for critical infrastructure.
- In September, 2024, Wartsila Corp. secured a contract to deliver a 250 MW/500 MWh battery energy storage system in Texas, US, designed to provide fast frequency response and synthetic inertia to the ERCOT grid, managed through its GEMS energy management platform.
Dive into Technavio’s robust research methodology, blending expert interviews, extensive data synthesis, and validated models for unparalleled Automatic Generation Control Market insights. See full methodology.
| Market Scope | |
|---|---|
| Page number | 319 |
| Base year | 2025 |
| Historic period | 2020-2024 |
| Forecast period | 2026-2030 |
| Growth momentum & CAGR | Accelerate at a CAGR of 3.4% |
| Market growth 2026-2030 | USD 263.8 million |
| Market structure | Fragmented |
| YoY growth 2025-2026(%) | 3.2% |
| Key countries | China, Japan, India, South Korea, Australia, Indonesia, US, Canada, Mexico, Germany, France, UK, Italy, Spain, The Netherlands, Brazil, Argentina, Chile, Saudi Arabia, UAE, South Africa, Israel and Turkey |
| Competitive landscape | Leading Companies, Market Positioning of Companies, Competitive Strategies, and Industry Risks |
Research Analyst Overview
- The automatic generation control market is fundamentally about maintaining equilibrium in an increasingly complex and fragile power grid. Its strategic importance has grown exponentially with the push for decarbonization, making it a central topic in boardroom discussions on capital expenditure and risk management.
- The core technology, encompassing turbine governor control, load frequency control, and economic dispatch, is evolving to manage the technical challenges of a non-synchronous grid. The integration of battery energy storage systems and distributed energy resources is no longer a niche application but a mainstream requirement.
- We are seeing a decisive shift toward platforms that utilize digital twin simulations and predictive load balancing, enabling a new level of power system automation. For instance, advanced systems have demonstrated a 40% faster response time in correcting power frequency deviations compared to legacy equipment. This performance is critical for preventing cascading grid failures.
- The imperative for smart grid modernization is also driving investment in supervisory control and data acquisition systems and high-fidelity data analytics, which are essential for real-time economic dispatch and ensuring overall grid resilience in the face of intermittent power sources.
What are the Key Data Covered in this Automatic Generation Control Market Research and Growth Report?
-
What is the expected growth of the Automatic Generation Control Market between 2026 and 2030?
-
USD 263.8 million, at a CAGR of 3.4%
-
-
What segmentation does the market report cover?
-
The report is segmented by Application (Non-renewable energy power plants, and Renewable energy power plants), Type (Turbine governor control, Load frequency control, and Economic dispatch), Component (Equipment, Solutions, and Services), End-user (Utilities, Industrial, and Commercial) and Geography (APAC, North America, Europe, South America, Middle East and Africa)
-
-
Which regions are analyzed in the report?
-
APAC, North America, Europe, South America and Middle East and Africa
-
-
What are the key growth drivers and market challenges?
-
Integration of large-scale renewable energy sources and grid decentralization, Complexity of intermittent renewable integration and frequency stability
-
-
Who are the major players in the Automatic Generation Control Market?
-
ABB Ltd., Andritz AG, DEIF AS, Emerson Electric Co., ENERCON GmbH, ETAP Operation Technology Inc., General Electric Co., Hitachi Ltd., Honeywell International Inc., Hubbell Inc., Larsen and Toubro Ltd., Mitsubishi Electric Corp., Regal Beloit Corp., Rockwell Automation Inc., Schneider Electric SE, Schweitzer Engineering, Siemens AG, Suzlon Energy Ltd., Wartsila Corp. and Yokogawa Electric Corp.
-
Market Research Insights
- The market dynamics are defined by the imperative for enhanced grid resilience and operational efficiency in the face of the global energy transition. Modern automatic generation control platforms are leveraging high-fidelity data from smart meters and digital substations, leading to a 15% improvement in forecast accuracy for dispatchable loads.
- This increased precision in power flow optimization is critical as intermittent power sources become more prevalent. The integration of advanced power system automation has demonstrated the potential to reduce grid operational costs by up to 10% by optimizing spinning reserve and enabling participation in ancillary services markets.
- As utilities move toward grid-forming technology to improve voltage stability, systems that can provide fast frequency response and manage tie-line exchanges with minimal error are becoming standard. This shift reflects a move from reactive to predictive grid management, where maintaining the generation-load balance is an automated, data-driven process.
We can help! Our analysts can customize this automatic generation control market research report to meet your requirements.
 RIA -
RIA - 
