Uninterruptible Power Supply (UPS) Market Size 2025-2029
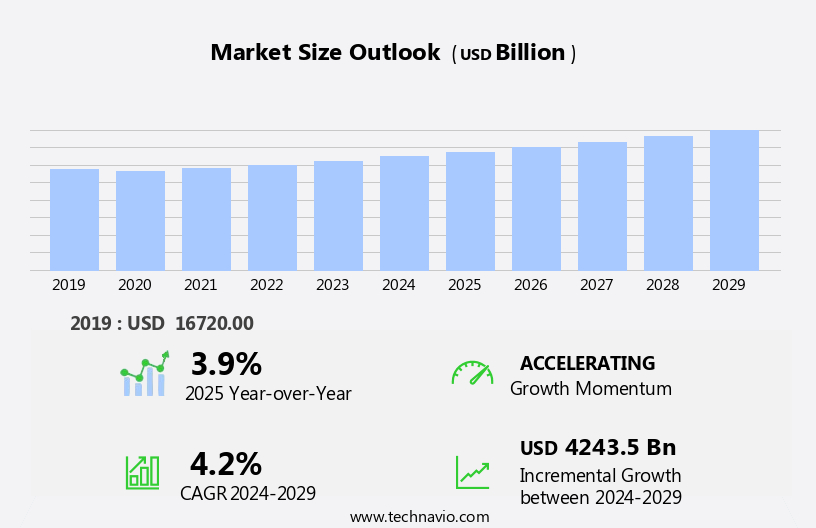
The uninterruptible power supply (ups) market size is forecast to increase by USD 4243.5 billion, at a CAGR of 4.2% between 2024 and 2029.
- The market experiences significant growth, driven by the expanding infrastructure of data centers. The increasing reliance on digital technologies and the need for uninterrupted power to support critical operations have fueled this expansion. Advancements in UPS technology continue to shape the market, with innovations such as lithium-ion batteries and energy-efficient designs enhancing performance and reducing total cost of ownership. However, the risks associated with UPS failure pose a considerable challenge to market participants. Downtime due to power outages or UPS malfunctions can result in substantial financial losses, reputational damage, and potential harm to business continuity.
- Ensuring high reliability and maintaining UPS systems efficiently are crucial priorities for organizations to mitigate these risks and maintain operational resilience. Companies seeking to capitalize on market opportunities and navigate challenges effectively must stay informed of technological advancements and invest in robust maintenance strategies.
What will be the Size of the Uninterruptible Power Supply (UPS) Market during the forecast period?
Explore in-depth regional segment analysis with market size data - historical 2019-2023 and forecasts 2025-2029 - in the full report.
Request Free Sample
The market continues to evolve, driven by the dynamic needs of various sectors and the ongoing integration of advanced technologies. UPS systems, which provide power conditioning and backup during power outages or voltage fluctuations, are essential for critical infrastructure protection in industries such as healthcare and financial services. Flywheel UPS systems, with their high power density and long run time, have gained popularity due to their energy efficiency and reduced environmental impact. Input voltage regulation and compliance with IEC standards are crucial considerations for UPS applications, particularly in the context of renewable energy integration and power conditioning. Fault tolerance and redundant power are key features of UPS systems, ensuring uninterrupted power supply to critical loads.
Double conversion UPS systems, which convert AC input to DC and then back to AC output, offer superior power quality and protection against power surges. Battery backup, a critical component of UPS systems, is available in various types, including lead-acid and lithium-ion batteries, each with their unique advantages. Power consumption and battery capacity are essential factors in selecting the right UPS solution for specific applications. Power inverters and voltage regulation are integral to UPS systems, enabling seamless conversion between DC and AC power. Artificial intelligence (AI) and machine learning are increasingly being integrated into UPS systems, enhancing power management and network monitoring capabilities.
Network management software, cloud-based monitoring, and remote monitoring are essential features of modern UPS systems, providing real-time insights and enabling proactive maintenance. N+1 redundancy, hot-swappable components, and surge protection are other critical features ensuring uninterrupted power supply and optimal system performance. UPS systems are essential for power protection in various applications, including data centers, industrial automation, and server protection. As power consumption and environmental regulations continue to evolve, UPS systems will remain a crucial component of power management solutions for businesses and critical infrastructure.
How is this UPS Industry segmented?
The uninterruptible power supply (ups) industry research report provides comprehensive data (region-wise segment analysis), with forecasts and estimates in "USD billion" for the period 2025-2029, as well as historical data from 2019-2023 for the following segments.
- End-user
- Non-residential
- Residential
- Type
- Online or double conversion
- Line-interactive
- Off-line or standby
- Application
- Industrial
- Data centers
- Telecommunications
- Healthcare
- Others
- Capacity
- Above 1000 kVA
- Below 500 kVA
- 500-1000 kVA
- Geography
- North America
- US
- Canada
- Europe
- France
- Germany
- Russia
- UK
- APAC
- China
- India
- Japan
- South Korea
- Rest of World (ROW).
- North America
By End-user Insights
The non-residential segment is estimated to witness significant growth during the forecast period.
UPS systems play a vital role in the non-residential sector, including commercial, industrial, and public infrastructure applications. These systems ensure power continuity, preventing revenue loss due to power disruptions and enabling value addition. UPS designs for non-residential use are engineered for robustness, as they operate in harsher environments compared to residential systems. Market participants prioritize enhancing the performance and efficiency of their non-residential UPS offerings. The non-residential UPS market encompasses both single-phase and three-phase configurations. Compliance with safety regulations is crucial, as is power conditioning for industrial automation applications. Battery life and capacity are essential considerations, with lithium-ion batteries and lead-acid batteries being popular choices.
Offline UPS and line interactive UPS are common solutions for non-residential applications. Online UPS, with its double conversion technology, offers voltage regulation and frequency conversion for critical infrastructure protection. UPS systems are increasingly integrated with renewable energy sources, ensuring power stability during grid fluctuations. Network management software and power management tools enable remote monitoring and control. Redundant power systems, such as N+1 redundancy, ensure fault tolerance and minimize downtime. UL certification is a standard requirement for power protection in various industries. UPS systems are essential for healthcare applications and financial services, where power outages can have severe consequences.
Artificial intelligence and machine learning are being integrated into UPS systems for predictive maintenance and energy efficiency. Power consumption is a critical concern, with energy efficiency and power factor optimization being key focus areas. UPS systems are also employed in data centers and server protection, with cloud-based monitoring and battery chargers ensuring uninterrupted operations. Flywheel UPS and power inverters are alternative solutions for specific applications. Modular design and hot-swappable components facilitate easy maintenance and upgrades. Environmental regulations and sustainability are driving the adoption of green power solutions and the integration of renewable energy sources into UPS systems. UPS systems are evolving to meet the demands of various industries, with a focus on improving efficiency, reliability, and adaptability.
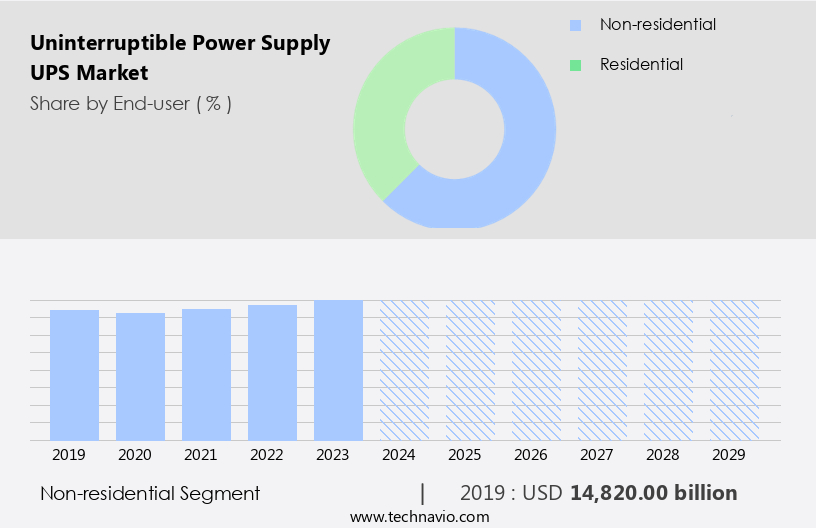
The Non-residential segment was valued at USD 14820.00 billion in 2019 and showed a gradual increase during the forecast period.
Regional Analysis
APAC is estimated to contribute 34% to the growth of the global market during the forecast period.Technavio's analysts have elaborately explained the regional trends and drivers that shape the market during the forecast period.
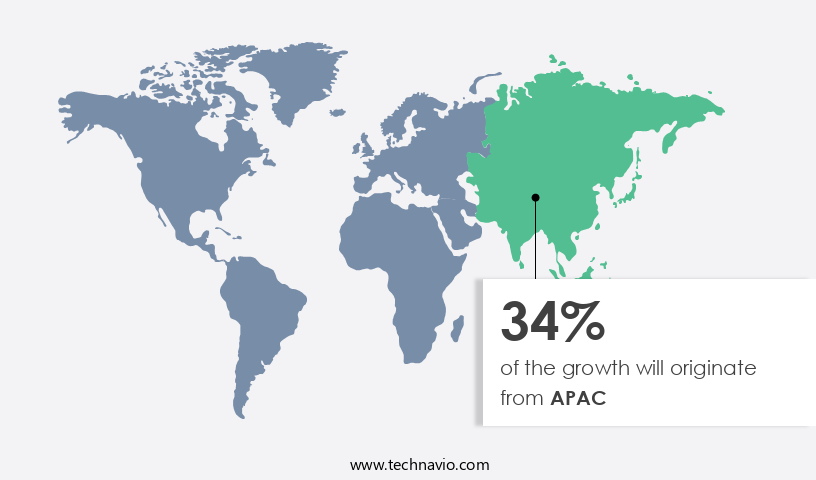
UPS are essential components in ensuring power continuity for critical industrial and commercial operations, particularly in regions with unreliable power grids. In 2024, the Asia Pacific (APAC) market held the largest share of the global UPS market, driven by countries like Cambodia, India, Myanmar, and Pakistan, which face severe power deficits and frequent outages. UPS systems provide backup power, protecting against power surges and ensuring voltage regulation, frequency conversion, and power conditioning. Compliance with safety regulations and standards, such as UL Certification and IEC Standards, is crucial for UPS systems. In the industrial automation sector, UPS systems ensure the continuity of manufacturing processes and protect sensitive equipment from power fluctuations.
Renewable energy integration and critical infrastructure protection are emerging trends, with UPS systems facilitating the integration of green power solutions and ensuring power backup for critical infrastructure. Online UPS systems, which provide continuous power protection, are gaining popularity due to their energy efficiency and high load capacity. Modular designs enable scalability and flexibility, while network management software and cloud-based monitoring offer remote control and real-time monitoring capabilities. Lithium-ion batteries offer longer battery life and faster recharge times compared to traditional lead-acid batteries. Power consumption and environmental regulations are key considerations for UPS systems. Energy efficiency and power factor optimization are essential to minimize energy waste and reduce carbon emissions.
UPS systems also play a crucial role in data center applications, where power outages can result in significant revenue losses. UPS systems are also integral to the financial services sector, healthcare applications, and telecom sectors, where data protection and security are paramount. Power inverters, surge protection, and power management software are essential components of UPS systems. Machine learning and artificial intelligence (AI) are being integrated into UPS systems to optimize performance and improve fault tolerance. UPS systems provide redundant power, ensuring business continuity during power outages. Voltage regulation and double conversion UPS systems ensure stable power output, while N+1 redundancy ensures uninterrupted power supply even during maintenance or system failures.
Flywheel UPS systems offer high power density and fast response times, making them suitable for applications requiring quick power backup. Battery backup and battery chargers are essential components of UPS systems, ensuring that the batteries are always charged and ready for use. Maintenance contracts and regular maintenance are crucial to ensure the longevity and optimal performance of UPS systems.
Market Dynamics
Our researchers analyzed the data with 2024 as the base year, along with the key drivers, trends, and challenges. A holistic analysis of drivers will help companies refine their marketing strategies to gain a competitive advantage.
What are the key market drivers leading to the rise in the adoption of Uninterruptible Power Supply (UPS) Industry?
- The expansion of data center infrastructure serves as the primary catalyst for market growth.
- Uninterruptible Power Supplies (UPS) are essential components in data center infrastructure, safeguarding sensitive computing equipment such as servers and routers from power quality issues and disturbances. The increasing value of data centers as critical assets for businesses of all sizes and industries, providing services like data storage and cloud computing, has fueled the growth of these infrastructures. UPS systems come in various designs, including Rotary and Modular, with varying Load Capacities and Output Voltages. Online UPS systems offer Frequency Conversion and Energy Efficiency, while Hybrid UPS systems combine the benefits of both Online and Offline UPS.
- Network Management Software enables remote monitoring and control, and Lithium-ion Batteries ensure high power density and longer life. N+1 Redundancy provides unparalleled power protection, and UL Certification ensures safety and compliance. Cloud-based Monitoring and Management Systems offer real-time insights. UPS systems are indispensable in maintaining the continuity and reliability of data center operations.
What are the market trends shaping the Uninterruptible Power Supply (UPS) Industry?
- Advances in Uninterruptible Power Supply (UPS) technology represent a significant market trend. UPS technology continues to evolve, offering improved efficiency, reliability, and capacity for businesses and organizations.
- Uninterruptible Power Supply (UPS) systems are essential for various applications across numerous industries, including healthcare, financial services, and data centers. These systems ensure fault tolerance and redundant power, safeguarding against power outages and voltage fluctuations. Two common types of UPS systems are Flywheel UPS and Double Conversion UPS. Flywheel UPS, utilizing a large rotating mass, stores energy and delivers power during power failures or voltage dips. In contrast, Double Conversion UPS converts AC input to DC and then back to AC, providing constant voltage and frequency output, adhering to IEC standards. Environmental regulations mandate the use of UPS systems to maintain power continuity and prevent data loss, particularly in critical applications.
- Voltage regulation is crucial in maintaining optimal power conditions, preventing damage to sensitive equipment. Power inverters and battery backup systems are integral components of UPS systems, ensuring seamless power transitions. Artificial Intelligence (AI) integration in UPS systems enhances efficiency, predictive maintenance, and energy management, making them more cost-effective and reliable. Input Voltage fluctuations can cause significant downtime and potential data loss, making UPS systems an indispensable investment for businesses.
What challenges does the Uninterruptible Power Supply (UPS) Industry face during its growth?
- The risks posed by UPS (Uninterruptible Power Supply) failures represent a significant challenge to the growth of various industries, as the reliability of power sources is essential for maintaining business continuity and preventing potential data loss or damage to equipment.
- Uninterruptible Power Supply (UPS) systems are essential for businesses to ensure the continuity of power to critical infrastructure, particularly in data centers. However, these systems require regular maintenance to ensure optimal performance and longevity of components. Two primary components, batteries and fans, are prone to failure due to various factors. Batteries, which provide backup power during power outages, can be affected by factors such as incorrect UPS placement, cycling frequency, ambient temperature, and lack of maintenance. Prolonged exposure to high temperatures and frequent cycling can significantly reduce their lifespan. Fans, responsible for cooling the UPS to maintain its operating temperature, can get affected by high loads, ambient temperature, and prolonged usage.
- Dust and debris can also impact their efficiency, leading to potential system failures. To mitigate these risks, businesses can invest in UPS systems with hot-swappable components, allowing for seamless replacement without disrupting the power supply. Surge protection and power management software are also crucial features that can help extend the life of batteries and fans. Moreover, power factor correction technology and machine learning algorithms can optimize energy usage, reducing the load on the UPS and extending the life of its components. Remote monitoring and maintenance contracts can also help businesses identify and address potential issues before they escalate, ensuring the reliability and resiliency of their power systems.
- Battery chargers, typically included with UPS systems, can also help maintain battery health by keeping them fully charged and ready for use. Businesses must prioritize the maintenance and upkeep of their UPS systems to ensure their continued operation and minimize the risk of component failures. By investing in features such as hot-swappable components, surge protection, power management software, and remote monitoring, businesses can extend the life of their UPS systems and safeguard their critical infrastructure.
Exclusive Customer Landscape
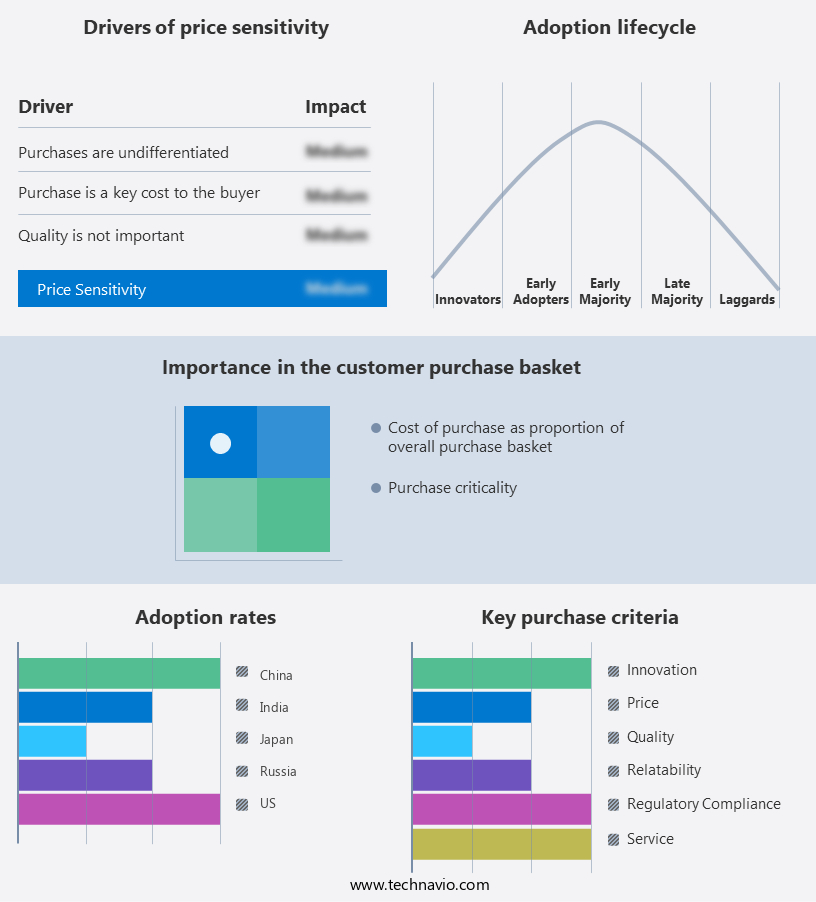
The uninterruptible power supply (ups) market forecasting report includes the adoption lifecycle of the market, covering from the innovator's stage to the laggard's stage. It focuses on adoption rates in different regions based on penetration. Furthermore, the uninterruptible power supply (ups) market report also includes key purchase criteria and drivers of price sensitivity to help companies evaluate and develop their market growth analysis strategies.
Customer Landscape
Key Companies & Market Insights
Companies are implementing various strategies, such as strategic alliances, uninterruptible power supply (ups) market forecast, partnerships, mergers and acquisitions, geographical expansion, and product/service launches, to enhance their presence in the industry.
ABB Ltd. - The company specializes in Data Performance Analytics (DPA) solutions, providing advanced technologies such as UPScale ST, DPA 500, PowerLine DPA, and MegaFlex DPA. These offerings enhance data processing capabilities, optimizing performance and scalability for businesses. By leveraging innovative data analytics techniques, companies can gain valuable insights to inform strategic decision-making and drive operational efficiency. Our DPA solutions cater to diverse industries and applications, enabling organizations to unlock the full potential of their data assets.
The industry research and growth report includes detailed analyses of the competitive landscape of the market and information about key companies, including:
- ABB Ltd.
- Active Power Solutions Ltd.
- Ablerex Electronics Co. Ltd
- AMETEK Inc.
- Delta Electronics Inc.
- East Penn Manufacturing Co. Inc.
- Eaton Corp. plc
- EnerSys
- Exide Industries Ltd.
- Hitachi Ltd.
- Huawei Technologies Co. Ltd.
- Legrand SA
- Metartec Ltd.
- Mitsubishi Electric Corp.
- Power Innovations International Inc.
- RTX Corp.
- Schneider Electric SE
- Siemens AG
- Toshiba Corp.
- Vertiv Holdings Co.
Qualitative and quantitative analysis of companies has been conducted to help clients understand the wider business environment as well as the strengths and weaknesses of key industry players. Data is qualitatively analyzed to categorize companies as pure play, category-focused, industry-focused, and diversified; it is quantitatively analyzed to categorize companies as dominant, leading, strong, tentative, and weak.
Recent Development and News in Uninterruptible Power Supply (UPS) Market
- In February 2023, Schneider Electric, a global energy management and automation company, announced the launch of its new MasterPact MTZ UPS system, which offers up to 4 MW of power capacity and a record-breaking 99.68% efficiency level. This innovation sets a new standard in the UPS market for power density and efficiency (Schneider Electric Press Release, 2023).
- In March 2024, ABB, a leading technology provider, entered into a strategic partnership with Microsoft to integrate ABB's UPS systems with Microsoft's Azure IoT Edge platform. This collaboration aims to enhance the reliability and efficiency of data centers by enabling predictive maintenance and real-time monitoring (ABB Press Release, 2024).
- In July 2024, Eaton, a power management company, completed the acquisition of Moeller Electric, a German electrical equipment manufacturer. This acquisition strengthened Eaton's position in the European market and expanded its product portfolio, particularly in the power distribution and circuit protection segments (Eaton Press Release, 2024).
- In November 2025, the European Union announced the approval of new regulations to mandate the installation of UPS systems in all new data centers and critical infrastructure projects. This policy change is expected to boost the demand for UPS systems in Europe and create significant growth opportunities for market players (European Commission Press Release, 2025).
Research Analyst Overview
- The market experiences dynamic growth, driven by the increasing demand for high availability and power outage mitigation solutions. Edge computing and the proliferation of edge data centers necessitate UPS systems for power quality and harmonic distortion management. Battery recycling is gaining traction as a sustainable solution for UPS systems, reducing the carbon footprint. Wind power integration and solar power integration require UPS systems for network security and power system optimization. Mobile power solutions cater to off-grid power applications, ensuring business continuity. Power system design incorporates UPS systems for critical load analysis and power factor correction.
- Cloud computing and IoT integration necessitate UPS systems for data security and data center infrastructure protection. Energy audit and power system design considerations include load shedding and smart grid integration for efficient power usage. UPS systems play a crucial role in disaster recovery, ensuring minimal downtime during power outages. UPS systems contribute to reducing carbon footprint through energy storage and power system optimization. Transient suppression and power quality maintenance are essential for maintaining optimal power conditions. Overall, the UPS market continues to evolve, addressing diverse power needs across industries.
Dive into Technavio's robust research methodology, blending expert interviews, extensive data synthesis, and validated models for unparalleled Uninterruptible Power Supply (UPS) Market insights. See full methodology.
|
Market Scope |
|
|
Report Coverage |
Details |
|
Page number |
249 |
|
Base year |
2024 |
|
Historic period |
2019-2023 |
|
Forecast period |
2025-2029 |
|
Growth momentum & CAGR |
Accelerate at a CAGR of 4.2% |
|
Market growth 2025-2029 |
USD 4243.5 billion |
|
Market structure |
Fragmented |
|
YoY growth 2024-2025(%) |
3.9 |
|
Key countries |
US, China, India, Russia, Japan, UK, Germany, Canada, South Korea, and France |
|
Competitive landscape |
Leading Companies, Market Positioning of Companies, Competitive Strategies, and Industry Risks |
What are the Key Data Covered in this Uninterruptible Power Supply (UPS) Market Research and Growth Report?
- CAGR of the Uninterruptible Power Supply (UPS) industry during the forecast period
- Detailed information on factors that will drive the growth and forecasting between 2025 and 2029
- Precise estimation of the size of the market and its contribution of the industry in focus to the parent market
- Accurate predictions about upcoming growth and trends and changes in consumer behaviour
- Growth of the market across APAC, Europe, North America, Middle East and Africa, and South America
- Thorough analysis of the market's competitive landscape and detailed information about companies
- Comprehensive analysis of factors that will challenge the uninterruptible power supply (ups) market growth of industry companies
We can help! Our analysts can customize this uninterruptible power supply (ups) market research report to meet your requirements.
 RIA -
RIA - 
