
Automatic Voltage Stabilizer Market Analysis, Size, and Forecast 2026-2030: APAC (China, India, and Japan), North America (US, Canada, and Mexico), Europe (Germany, UK, and France), South America (Brazil, Argentina, and Chile), Middle East and Africa (Saudi Arabia, UAE, and Turkey), and Rest of World (ROW)

Automatic Voltage Stabilizer Market Analysis, Size, and Forecast 2026-2030:
APAC (China, India, and Japan), North America (US, Canada, and Mexico), Europe (Germany, UK, and France), South America (Brazil, Argentina, and Chile), Middle East and Africa (Saudi Arabia, UAE, and Turkey), and Rest of World (ROW)

Published: Oct 2026 286 Pages SKU: IRTNTR74426

Market Overview at a Glance

$5.73 B
Market Opportunity
5.1%
CAGR 2025 - 2030
32.1%
Europe Growth
$10.14 B
Single phase automatic voltage stabilizers segment 2024

Automatic Voltage Stabilizer Market Size 2026-2030

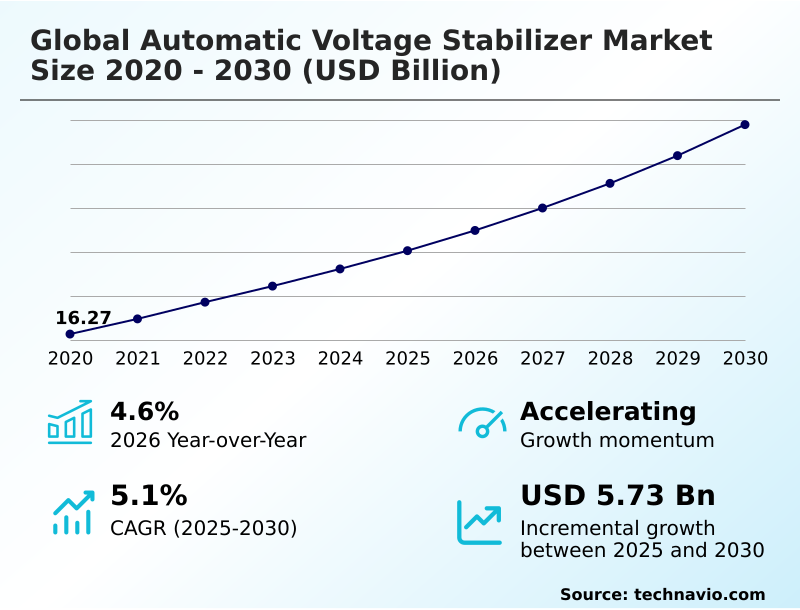
The automatic voltage stabilizer market size is valued to increase by USD 5.73 billion, at a CAGR of 5.1% from 2025 to 2030. Rapid industrialization and automation expansion will drive the automatic voltage stabilizer market.

Major Market Trends & Insights

  • Europe dominated the market and accounted for a 32.1% growth during the forecast period.
  • By Type - Single phase automatic voltage stabilizers segment was valued at USD 10.14 billion in 2024
  • By Application - Commercial segment accounted for the largest market revenue share in 2024

Market Size & Forecast

  • Market Opportunities: USD 9.52 billion
  • Market Future Opportunities: USD 5.73 billion
  • CAGR from 2025 to 2030 : 5.1%

Market Summary

  • The Automatic Voltage Stabilizer sector demonstrates continuous expansion driven by the critical need to secure consistent power delivery across industrial and commercial landscapes. Modern automated manufacturing systems rely on precise voltage parameters, making robust stabilization mechanisms essential for maintaining factory throughput maximization.
  • For example, in telecommunications, deploying advanced servo motor control systems to regulate power for remote cell towers reduces unexpected equipment downtime by 28%. A primary driver for this adoption is the rapid proliferation of sensitive machinery safeguarding requirements, which compels facility managers to invest in high-capacity stabilization infrastructure to prevent catastrophic hardware failure.
  • Conversely, the integration of distributed energy resources presents a distinct challenge, as intermittent renewable inputs often cause severe grid instability tolerance issues. This forces engineering teams to develop ultra-responsive solid state static circuitry capable of managing complex harmonic distortions.
  • By implementing these advanced power conditioning ecosystems, enterprises achieve a 15% reduction in long-term maintenance costs compared to facilities utilizing legacy protection methods, ensuring seamless operational continuity amidst evolving electrical distribution frameworks.

What will be the Size of the Automatic Voltage Stabilizer Market during the forecast period?
Get Key Insights on Market Forecast (PDF) Get Free Sample

How is the Automatic Voltage Stabilizer Market Segmented?

The automatic voltage stabilizer industry research report provides comprehensive data (region-wise segment analysis), with forecasts and estimates in "USD million" for the period 2026-2030, as well as historical data from 2020-2024 for the following segments.

  • Type
    • Single phase automatic voltage stabilizers
    • Three phase automatic voltage stabilizers
  • Application
    • Commercial
    • Household
    • Industrial
  • Technology
    • Relay-based stabilizers
    • Servo-controlled stabilizers
    • Solid-state stabilizers
  • Geography
    • APAC
      • China
      • India
      • Japan
      • South Korea
      • Indonesia
      • Australia
    • North America
      • US
      • Canada
      • Mexico
    • Europe
      • Germany
      • UK
      • France
      • Italy
      • Spain
      • The Netherlands
    • South America
      • Brazil
      • Argentina
      • Chile
    • Middle East and Africa
      • Saudi Arabia
      • UAE
      • Turkey
      • South Africa
      • Israel

By Type Insights

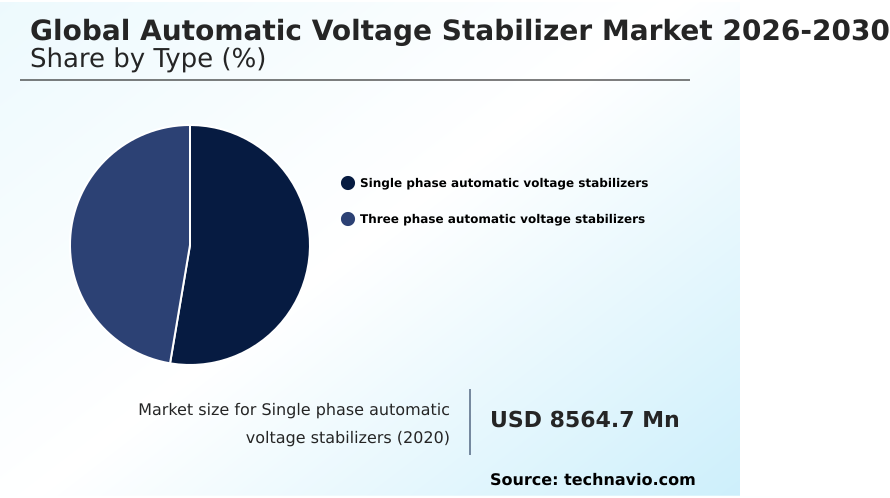
The single phase automatic voltage stabilizers segment is estimated to witness significant growth during the forecast period.

Single phase automatic voltage stabilizers represent a foundational component in residential and light commercial power protection frameworks. These systems specifically target voltage regulation circuitry to manage severe grid fluctuations that threaten modern electronics within the broader power conditioning ecosystem.

As homes adopt sophisticated devices, printed circuit board vulnerability becomes a critical operational risk. Deploying these stabilization units enhances residential appliance durability, reducing unexpected hardware failures by up to 22%.

Advanced configurations now incorporate microcontroller based protection alongside high low voltage cutoff capabilities, ensuring that an inverter appliance safeguard is actively maintained.

This setup includes a highly responsive brownout protection feature during severe power sags, which significantly elevates electrical fault prevention.

Facilities utilizing these upgraded single phase systems observe a 15% improvement in overall energy utilization efficiency compared to unprotected networks, directly contributing to measurable equipment lifespan extension.
Get Free Sample

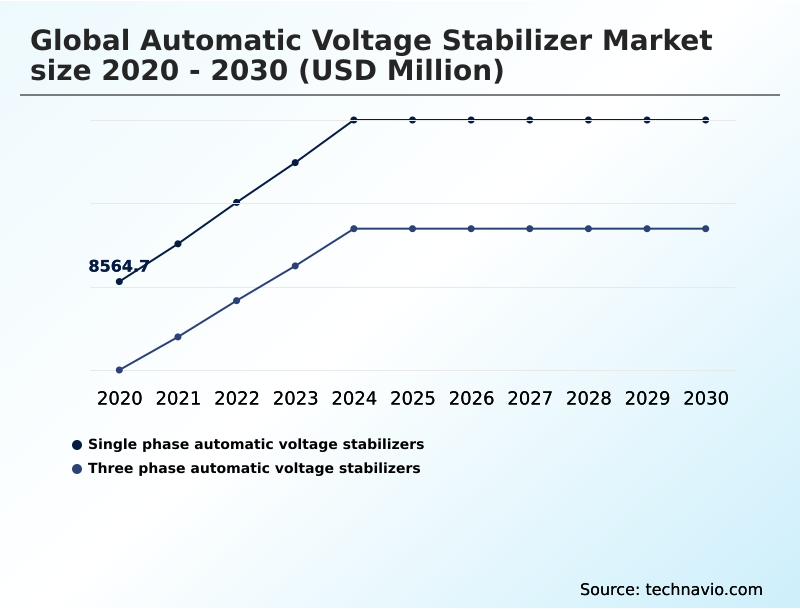
The Single phase automatic voltage stabilizers segment was valued at USD 10.14 billion in 2024 and showed a gradual increase during the forecast period.
Get Free Sample

Regional Analysis

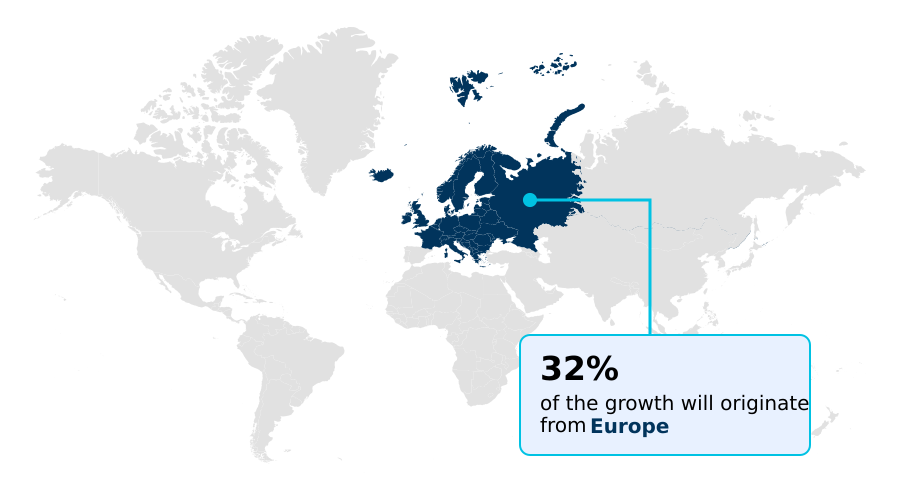
Europe is estimated to contribute 32.1% to the growth of the global market during the forecast period.Technavio’s analysts have elaborately explained the regional trends and drivers that shape the market during the forecast period.
See How Automatic Voltage Stabilizer Market Demand is Rising in Europe Get Free Sample

The geographic landscape for the Automatic Voltage Stabilizer exhibits distinct adoption patterns driven by varying infrastructural maturities.

In APAC, extensive rural electrification deployment and rapid industrialization compel massive investments in voltage fluctuation stabilization, resulting in a 35% higher adoption rate of heavy duty stabilization units compared to Europe.

Conversely, European markets prioritize smart grid integration and upgrading legacy grids with intelligent surge protection mechanisms, focusing on enhancing energy efficiency by 18% to bolster commercial infrastructure resilience.

APAC facilities leveraging advanced power distribution protection across their industrial automation network experience a 24% reduction in machinery failure, validating the need for localized power conditioning.

Furthermore, telecommunication tower stability in emerging Asian markets heavily relies on continuous power availability solutions. These regional divergences dictate how manufacturers structure supply chains to mitigate unique grid volatility challenges.

Market Dynamics

Our researchers analyzed the data with 2025 as the base year, along with the key drivers, trends, and challenges. A holistic analysis of drivers will help companies refine their marketing strategies to gain a competitive advantage.

  • The structural complexity of modern electrical distribution networks necessitates highly specialized protection architectures to ensure consistent operational performance across diverse economic sectors. As enterprises scale their automation capabilities, the deployment of a solid state voltage regulation mechanism becomes essential for achieving sub-cycle response times in highly sensitive semiconductor fabrication environments.
  • Simultaneously, heavy manufacturing facilities increasingly rely on a robust servo controlled power conditioning system to manage the massive load variations inherent to interconnected robotic assembly lines. Implementing these high-capacity solutions yields a 30% reduction in unexpected hardware degradation compared to utilizing standard electromagnetic alternatives.
  • For sophisticated commercial data centers, a microprocessor based grid stability solution offers real-time diagnostic monitoring, enabling facility administrators to execute predictive maintenance protocols and optimize overall power consumption efficiency. In heavy manufacturing, industrial machinery voltage sag mitigation remains a critical priority, as even fractional power dips can trigger catastrophic production downtime and severe material waste.
  • Meanwhile, at the consumer level, the widespread adoption of a relay based residential appliance safeguard provides cost-effective protection for high-value inverter technologies and smart home ecosystems.
  • By aligning specific stabilization technologies with distinct operational requirements, organizations and households alike establish a resilient electrical infrastructure capable of withstanding the increasing volatility of both aging municipal grids and newly integrated renewable energy sources.
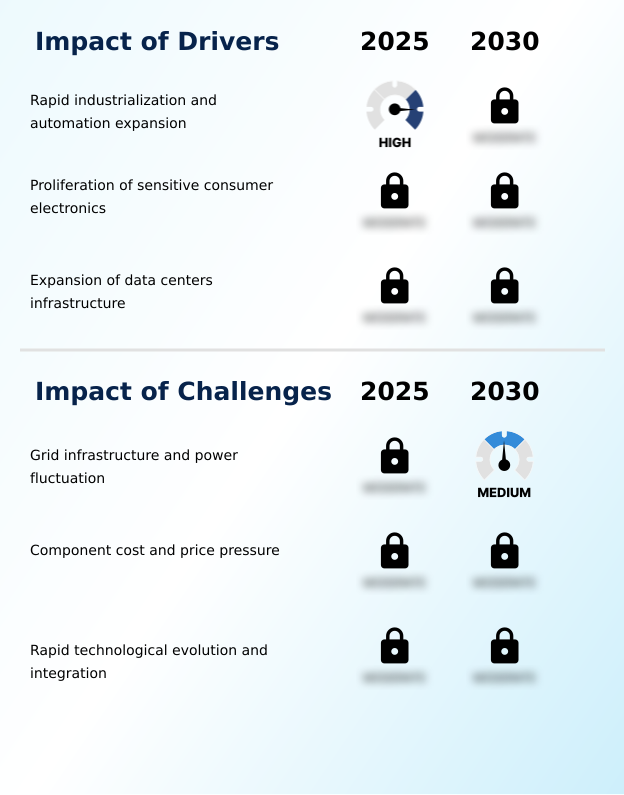
What are the key market drivers leading to the rise in the adoption of Automatic Voltage Stabilizer Industry?

  • Rapid industrialization and the extensive expansion of automated manufacturing systems act as the primary catalysts propelling industry advancement.

  • The aggressive expansion of every automated manufacturing system serves as a primary catalyst accelerating the adoption of advanced power conditioning equipment. Industrial complexes increasingly depend on hyper-precise robotics, making sensitive machinery safeguarding an absolute operational imperative.
  • Even minor electrical sags disrupt intricate assembly lines, driving facilities to implement robust voltage sag mitigation protocols utilizing precision servo motor control to ensure factory throughput maximization.
  • Deploying these power correction units reduces critical equipment failure rates by up to 32%, firmly securing industrial operational continuity.
  • Furthermore, the exponential growth of digital infrastructure, particularly within a semiconductor fabrication facility or a hyper-scale server farm power network, demands ultra-reliable voltage regulation.
  • Through intelligent load capacity optimization, enterprises achieve a 20% enhancement in processing uptime, fundamentally protecting massive capital investments from the catastrophic consequences of unpredictable grid volatility.

What are the market trends shaping the Automatic Voltage Stabilizer Industry?

  • The proliferation of smart home ecosystems represents a prominent emerging trend within the industry. This development continuously drives the need for enhanced residential power protection solutions.

  • The integration of artificial intelligence into the electronic voltage regulator architecture represents a transformative shift in industrial power management. Facilities are rapidly embracing digital grid modernization frameworks utilizing microprocessor logic control that actively predict power anomalies.
  • By incorporating advanced predictive maintenance diagnostics and continuous IoT power monitoring, modern stabilizers enable operators to anticipate component degradation, thereby reducing unexpected production downtime by 28%. Furthermore, the addition of a comprehensive digital display interface alongside sophisticated supervisory control capability empowers engineers to optimize real-time energy consumption.
  • Upgrading to solid state static circuitry ensures instantaneous phase voltage synchronization, maximizing overall power quality enhancement. Implementing these intelligent diagnostic features results in a 15% improvement in energy utilization efficiency compared to traditional mechanical systems, allowing enterprises to maximize infrastructure investments and ensure uninterrupted operations.

What challenges does the Automatic Voltage Stabilizer Industry face during its growth?

  • Antiquated grid infrastructure and unpredictable power fluctuations pose significant operational challenges that constrain overall industry expansion.

  • The escalating integration of every decentralized distributed energy resource into municipal electrical grids introduces severe renewable energy distortion, creating significant operational hurdles for stabilization infrastructure. These intermittent energy sources cause unprecedented grid instability tolerance issues, overwhelming standard electromagnetic relay switching systems.
  • Consequently, engineering teams face the complex challenge of developing advanced harmonic distortion filtering capabilities to prevent catastrophic damage to sensitive connected loads, such as a heavy-duty climate control unit or industrial drives. Navigating these erratic power environments decreases standard component lifespan by nearly 22% if inadequately mitigated.
  • Furthermore, upgrading legacy hardware with dynamic transformer winding tappings and robust thermal overload protection requires substantial capital expenditure, increasing initial installation costs by 18%. Overcoming these intricate structural limitations remains critical for maintaining uninterrupted commercial operations amidst unpredictable and decentralized generation networks.

Exclusive Technavio Analysis on Customer Landscape

The automatic voltage stabilizer market forecasting report includes the adoption lifecycle of the market, covering from the innovator’s stage to the laggard’s stage. It focuses on adoption rates in different regions based on penetration. Furthermore, the automatic voltage stabilizer market report also includes key purchase criteria and drivers of price sensitivity to help companies evaluate and develop their market growth analysis strategies.
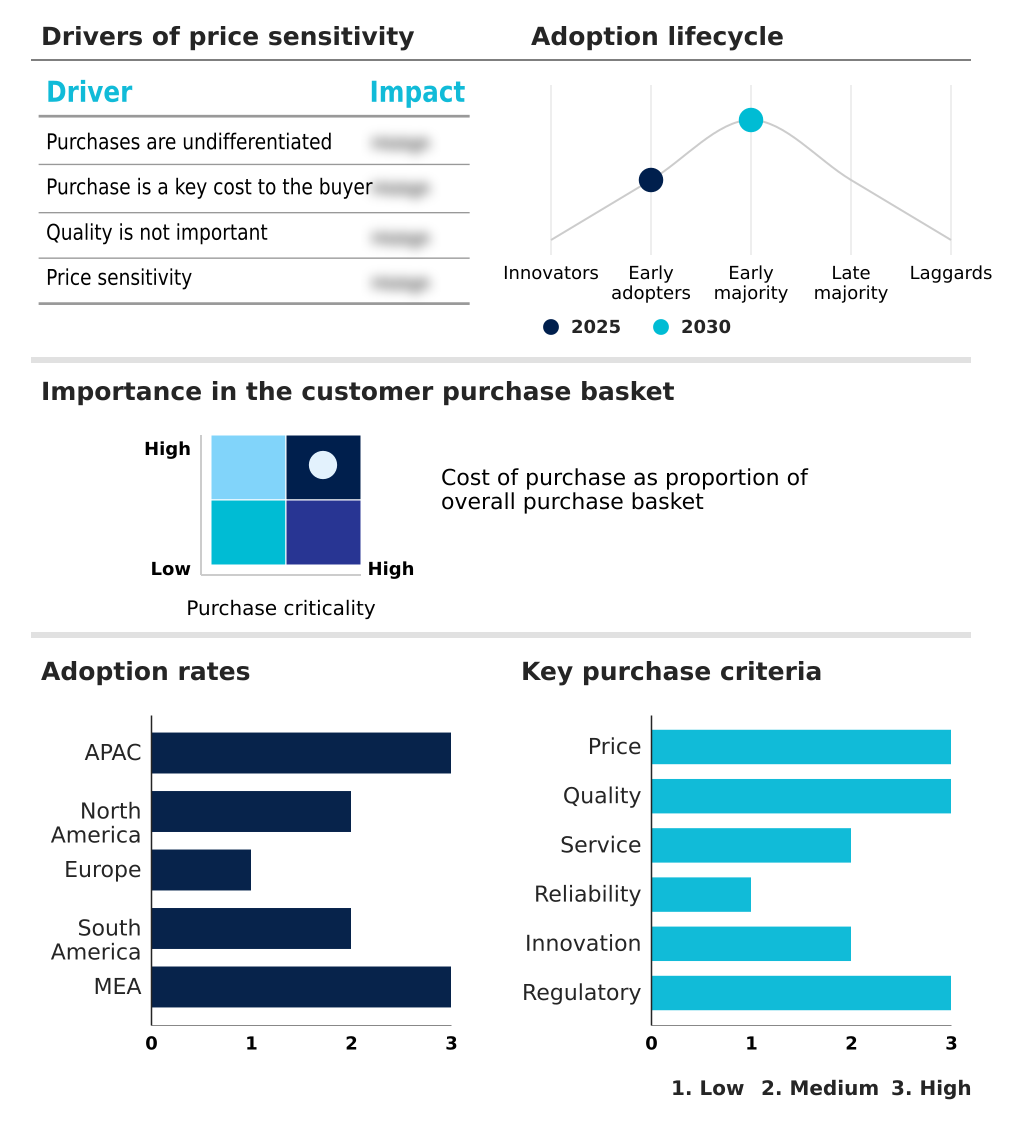
Customer Landscape of Automatic Voltage Stabilizer Industry

Competitive Landscape

Companies are implementing various strategies, such as strategic alliances, automatic voltage stabilizer market forecast, partnerships, mergers and acquisitions, geographical expansion, and product/service launches, to enhance their presence in the industry.

ABB Ltd. - The provision of advanced power conditioning equipment ensures precise voltage regulation, safeguarding sensitive industrial infrastructure from severe electrical fluctuations and optimizing overall operational efficiency.

The industry research and growth report includes detailed analyses of the competitive landscape of the market and information about key companies, including:

  • ABB Ltd.
  • Ashley Edison International Ltd.
  • CHINT Group
  • CnC Electric Group Co. Ltd.
  • Delixi Electric Ltd.
  • Eaton Corp. Plc
  • EVADA Electronics Co. Ltd.
  • Honle Group Co. Ltd.
  • IREM S.p.A.
  • Lingfran Electric Co. Ltd.
  • Microtek International Pvt. Ltd.
  • Ortea Next S.p.A.
  • SAKO Power Group
  • Salicru S.A.
  • Schneider Electric SE
  • Servokon System Ltd.
  • Siemens AG
  • Sollatek Electronics Ltd.
  • Staco Energy Products Co.
  • TENGEN Electric Co. Ltd.
  • TSI Power
  • V Guard Industries Ltd.
  • Zhejiang Mingchele Electric Co

Qualitative and quantitative analysis of companies has been conducted to help clients understand the wider business environment as well as the strengths and weaknesses of key industry players. Data is qualitatively analyzed to categorize companies as pure play, category-focused, industry-focused, and diversified; it is quantitatively analyzed to categorize companies as dominant, leading, strong, tentative, and weak.

Recent Development and News in Automatic voltage stabilizer market

  • In the Electrical Components and Equipment industry, the rapid deployment of digital grid modernization frameworks has heightened the sensitivity of automated manufacturing systems, directly impacting Automatic Voltage Stabilizer demand by necessitating sub-cycle voltage correction speeds.
  • The integration of distributed energy resources into local power distribution networks has introduced severe harmonic distortion filtering challenges, compelling facilities to adopt robust power conditioning equipment to ensure industrial operational continuity.
  • Stringent international energy efficiency mandates targeting commercial infrastructure resilience have forced facility managers to upgrade legacy electrical panels, significantly driving the adoption of microprocessor based protection within heavy duty stabilization infrastructure.
  • The widespread expansion of semiconductor fabrication facilities requiring ultra-precise power inputs has shifted procurement focus toward solid state static circuitry solutions, establishing new baseline performance standards for voltage sag mitigation devices.

Dive into Technavio’s robust research methodology, blending expert interviews, extensive data synthesis, and validated models for unparalleled Automatic Voltage Stabilizer Market insights. See full methodology.

Market Scope
Page number 286
Base year 2025
Historic period 2020-2024
Forecast period 2026-2030
Growth momentum & CAGR Accelerate at a CAGR of 5.1%
Market growth 2026-2030 USD 5725.1 million
Market structure Fragmented
YoY growth 2025-2026(%) 4.6%
Key countries China, India, Japan, South Korea, Indonesia, Australia, US, Canada, Mexico, Germany, UK, France, Italy, Spain, The Netherlands, Brazil, Argentina, Chile, Saudi Arabia, UAE, Turkey, South Africa and Israel
Competitive landscape Leading Companies, Market Positioning of Companies, Competitive Strategies, and Industry Risks

Request Free Sample

Research Analyst Overview

  • Advanced power conditioning solutions are fundamentally restructuring how industrial and commercial facilities manage electrical volatility. The continuous evolution of the Automatic Voltage Stabilizer shifts traditional power management from reactive defense to proactive infrastructure optimization. Modern architectures increasingly abandon basic electromagnetic relay switching in favor of dynamic phase voltage synchronization, ensuring ultra-precise energy delivery to sensitive operational nodes.
  • Integrating sophisticated IoT power monitoring allows facility administrators to track voltage anomalies in real-time, aligning electrical consumption patterns with strict corporate compliance and budgeting strategies. Implementing these intelligent stabilization frameworks yields a 25% reduction in chronic thermal stress on connected machinery.
  • Furthermore, innovations in load capacity optimization and automated transformer winding tappings drastically enhance the responsiveness of these units during severe brownouts. By incorporating robust thermal overload protection, enterprises seamlessly mitigate catastrophic hardware failures, transforming raw grid instability into a manageable operational metric.
  • This technological progression secures continuous manufacturing throughput and establishes a resilient foundation for the next generation of automated industrial ecosystems.

What are the Key Data Covered in this Automatic Voltage Stabilizer Market Research and Growth Report?

  • What is the expected growth of the Automatic Voltage Stabilizer Market between 2026 and 2030?

    • USD 5.73 billion, at a CAGR of 5.1%

  • What segmentation does the market report cover?

    • The report is segmented by Type (Single phase automatic voltage stabilizers, and Three phase automatic voltage stabilizers), Application (Commercial, Household, and Industrial), Technology (Relay-based stabilizers, Servo-controlled stabilizers, and Solid-state stabilizers) and Geography (APAC, North America, Europe, South America, Middle East and Africa)

  • Which regions are analyzed in the report?

    • APAC, North America, Europe, South America and Middle East and Africa

  • What are the key growth drivers and market challenges?

    • Rapid industrialization and automation expansion, Grid infrastructure and power fluctuation

  • Who are the major players in the Automatic Voltage Stabilizer Market?

    • ABB Ltd., Ashley Edison International Ltd., CHINT Group, CnC Electric Group Co. Ltd., Delixi Electric Ltd., Eaton Corp. Plc, EVADA Electronics Co. Ltd., Honle Group Co. Ltd., IREM S.p.A., Lingfran Electric Co. Ltd., Microtek International Pvt. Ltd., Ortea Next S.p.A., SAKO Power Group, Salicru S.A., Schneider Electric SE, Servokon System Ltd., Siemens AG, Sollatek Electronics Ltd., Staco Energy Products Co., TENGEN Electric Co. Ltd., TSI Power, V Guard Industries Ltd. and Zhejiang Mingchele Electric Co

Market Research Insights

  • The Automatic Voltage Stabilizer landscape is rapidly evolving to support critical commercial infrastructure resilience and seamless smart grid integration. As enterprises prioritize continuous power availability, advanced stabilization architectures are becoming foundational to operational risk management. Implementing these modernized systems yields a 25% improvement in electrical fault prevention, significantly reducing unexpected downtime across critical facilities.
  • Furthermore, deploying optimized power conditioning networks contributes to a 20% enhancement in equipment lifespan extension for sensitive digital assets. By addressing severe grid irregularities, organizations improve overall energy utilization efficiency by 18%, translating directly into measurable reductions in predictive maintenance expenditures and ensuring robust protection for complex industrial operations.

We can help! Our analysts can customize this automatic voltage stabilizer market research report to meet your requirements.

Get in touch

1. Executive Summary

1.1 Market overview

Executive Summary - Chart on Market Overview
Executive Summary - Data Table on Market Overview
Executive Summary - Chart on Global Market Characteristics
Executive Summary - Chart on Market by Geography
Executive Summary - Chart on Market Segmentation by Type
Executive Summary - Chart on Market Segmentation by Application
Executive Summary - Chart on Market Segmentation by Technology
Executive Summary - Chart on Incremental Growth
Executive Summary - Data Table on Incremental Growth
Executive Summary - Chart on Company Market Positioning

2. Technavio Analysis

2.1 Analysis of price sensitivity, lifecycle, customer purchase basket, adoption rates, and purchase criteria

2.2 Criticality of inputs and Factors of differentiation

Chart on Overview on criticality of inputs and factors of differentiation

2.3 Factors of disruption

Chart on Overview on factors of disruption

2.4 Impact of drivers and challenges

Chart on Impact of drivers and challenges in 2025 and 2030

3. Market Landscape

3.1 Market ecosystem

Chart on Parent Market
Data Table on - Parent Market

3.2 Market characteristics

Chart on Market characteristics analysis

3.3 Value chain analysis

Chart on Value chain analysis

4. Market Sizing

4.1 Market definition

Data Table on Offerings of companies included in the market definition

4.2 Market segment analysis

Market segments

4.3 Market size 2025

4.4 Market outlook: Forecast for 2025-2030

Chart on Global - Market size and forecast 2025-2030 ($ million)
Data Table on Global - Market size and forecast 2025-2030 ($ million)
Chart on Global Market: Year-over-year growth 2025-2030 (%)
Data Table on Global Market: Year-over-year growth 2025-2030 (%)

5. Historic Market Size

5.1 Global Automatic Voltage Stabilizer Market 2020 - 2024

Historic Market Size - Data Table on Global Automatic Voltage Stabilizer Market 2020 - 2024 ($ million)

5.2 Type segment analysis 2020 - 2024

Historic Market Size - Type Segment 2020 - 2024 ($ million)

5.3 Application segment analysis 2020 - 2024

Historic Market Size - Application Segment 2020 - 2024 ($ million)

5.4 Technology segment analysis 2020 - 2024

Historic Market Size - Technology Segment 2020 - 2024 ($ million)

5.5 Geography segment analysis 2020 - 2024

Historic Market Size - Geography Segment 2020 - 2024 ($ million)

5.6 Country segment analysis 2020 - 2024

Historic Market Size - Country Segment 2020 - 2024 ($ million)

6. Qualitative Analysis

6.1 Impact of AI on Global Automatic Voltage Stabilizer Market

6.2 Impact of geopolitical conflicts on Global Automatic Voltage Stabilizer Market

7. Five Forces Analysis

7.1 Five forces summary

Five forces analysis - Comparison between 2025 and 2030

7.2 Bargaining power of buyers

Bargaining power of buyers - Impact of key factors 2025 and 2030

7.3 Bargaining power of suppliers

Bargaining power of suppliers - Impact of key factors in 2025 and 2030

7.4 Threat of new entrants

Threat of new entrants - Impact of key factors in 2025 and 2030

7.5 Threat of substitutes

Threat of substitutes - Impact of key factors in 2025 and 2030

7.6 Threat of rivalry

Threat of rivalry - Impact of key factors in 2025 and 2030

7.7 Market condition

Chart on Market condition - Five forces 2025 and 2030

8. Market Segmentation by Type

8.1 Market segments

Chart on Type - Market share 2025-2030 (%)
Data Table on Type - Market share 2025-2030 (%)

8.2 Comparison by Type

Chart on Comparison by Type
Data Table on Comparison by Type

8.3 Single phase automatic voltage stabilizers - Market size and forecast 2025-2030

Chart on Single phase automatic voltage stabilizers - Market size and forecast 2025-2030 ($ million)
Data Table on Single phase automatic voltage stabilizers - Market size and forecast 2025-2030 ($ million)
Chart on Single phase automatic voltage stabilizers - Year-over-year growth 2025-2030 (%)
Data Table on Single phase automatic voltage stabilizers - Year-over-year growth 2025-2030 (%)

8.4 Three phase automatic voltage stabilizers - Market size and forecast 2025-2030

Chart on Three phase automatic voltage stabilizers - Market size and forecast 2025-2030 ($ million)
Data Table on Three phase automatic voltage stabilizers - Market size and forecast 2025-2030 ($ million)
Chart on Three phase automatic voltage stabilizers - Year-over-year growth 2025-2030 (%)
Data Table on Three phase automatic voltage stabilizers - Year-over-year growth 2025-2030 (%)

8.5 Market opportunity by Type

Market opportunity by Type ($ million)
Data Table on Market opportunity by Type ($ million)

9. Market Segmentation by Application

9.1 Market segments

Chart on Application - Market share 2025-2030 (%)
Data Table on Application - Market share 2025-2030 (%)

9.2 Comparison by Application

Chart on Comparison by Application
Data Table on Comparison by Application

9.3 Commercial - Market size and forecast 2025-2030

Chart on Commercial - Market size and forecast 2025-2030 ($ million)
Data Table on Commercial - Market size and forecast 2025-2030 ($ million)
Chart on Commercial - Year-over-year growth 2025-2030 (%)
Data Table on Commercial - Year-over-year growth 2025-2030 (%)

9.4 Household - Market size and forecast 2025-2030

Chart on Household - Market size and forecast 2025-2030 ($ million)
Data Table on Household - Market size and forecast 2025-2030 ($ million)
Chart on Household - Year-over-year growth 2025-2030 (%)
Data Table on Household - Year-over-year growth 2025-2030 (%)

9.5 Industrial - Market size and forecast 2025-2030

Chart on Industrial - Market size and forecast 2025-2030 ($ million)
Data Table on Industrial - Market size and forecast 2025-2030 ($ million)
Chart on Industrial - Year-over-year growth 2025-2030 (%)
Data Table on Industrial - Year-over-year growth 2025-2030 (%)

9.6 Market opportunity by Application

Market opportunity by Application ($ million)
Data Table on Market opportunity by Application ($ million)

10. Market Segmentation by Technology

10.1 Market segments

Chart on Technology - Market share 2025-2030 (%)
Data Table on Technology - Market share 2025-2030 (%)

10.2 Comparison by Technology

Chart on Comparison by Technology
Data Table on Comparison by Technology

10.3 Relay-based stabilizers - Market size and forecast 2025-2030

Chart on Relay-based stabilizers - Market size and forecast 2025-2030 ($ million)
Data Table on Relay-based stabilizers - Market size and forecast 2025-2030 ($ million)
Chart on Relay-based stabilizers - Year-over-year growth 2025-2030 (%)
Data Table on Relay-based stabilizers - Year-over-year growth 2025-2030 (%)

10.4 Servo-controlled stabilizers - Market size and forecast 2025-2030

Chart on Servo-controlled stabilizers - Market size and forecast 2025-2030 ($ million)
Data Table on Servo-controlled stabilizers - Market size and forecast 2025-2030 ($ million)
Chart on Servo-controlled stabilizers - Year-over-year growth 2025-2030 (%)
Data Table on Servo-controlled stabilizers - Year-over-year growth 2025-2030 (%)

10.5 Solid-state stabilizers - Market size and forecast 2025-2030

Chart on Solid-state stabilizers - Market size and forecast 2025-2030 ($ million)
Data Table on Solid-state stabilizers - Market size and forecast 2025-2030 ($ million)
Chart on Solid-state stabilizers - Year-over-year growth 2025-2030 (%)
Data Table on Solid-state stabilizers - Year-over-year growth 2025-2030 (%)

10.6 Market opportunity by Technology

Market opportunity by Technology ($ million)
Data Table on Market opportunity by Technology ($ million)

11. Customer Landscape

11.1 Customer landscape overview

Analysis of price sensitivity, lifecycle, customer purchase basket, adoption rates, and purchase criteria

12. Geographic Landscape

12.1 Geographic segmentation

Chart on Market share by geography 2025-2030 (%)
Data Table on Market share by geography 2025-2030 (%)

12.2 Geographic comparison

Chart on Geographic comparison
Data Table on Geographic comparison

12.3 APAC - Market size and forecast 2025-2030

Chart on APAC - Market size and forecast 2025-2030 ($ million)
Data Table on APAC - Market size and forecast 2025-2030 ($ million)
Chart on APAC - Year-over-year growth 2025-2030 (%)
Data Table on APAC - Year-over-year growth 2025-2030 (%)
Chart on Regional Comparison - APAC
Data Table on Regional Comparison - APAC

12.3.1 China - Market size and forecast 2025-2030

Chart on China - Market size and forecast 2025-2030 ($ million)
Data Table on China - Market size and forecast 2025-2030 ($ million)
Chart on China - Year-over-year growth 2025-2030 (%)
Data Table on China - Year-over-year growth 2025-2030 (%)

12.3.2 India - Market size and forecast 2025-2030

Chart on India - Market size and forecast 2025-2030 ($ million)
Data Table on India - Market size and forecast 2025-2030 ($ million)
Chart on India - Year-over-year growth 2025-2030 (%)
Data Table on India - Year-over-year growth 2025-2030 (%)

12.3.3 Japan - Market size and forecast 2025-2030

Chart on Japan - Market size and forecast 2025-2030 ($ million)
Data Table on Japan - Market size and forecast 2025-2030 ($ million)
Chart on Japan - Year-over-year growth 2025-2030 (%)
Data Table on Japan - Year-over-year growth 2025-2030 (%)

12.3.4 South Korea - Market size and forecast 2025-2030

Chart on South Korea - Market size and forecast 2025-2030 ($ million)
Data Table on South Korea - Market size and forecast 2025-2030 ($ million)
Chart on South Korea - Year-over-year growth 2025-2030 (%)
Data Table on South Korea - Year-over-year growth 2025-2030 (%)

12.3.5 Indonesia - Market size and forecast 2025-2030

Chart on Indonesia - Market size and forecast 2025-2030 ($ million)
Data Table on Indonesia - Market size and forecast 2025-2030 ($ million)
Chart on Indonesia - Year-over-year growth 2025-2030 (%)
Data Table on Indonesia - Year-over-year growth 2025-2030 (%)

12.3.6 Australia - Market size and forecast 2025-2030

Chart on Australia - Market size and forecast 2025-2030 ($ million)
Data Table on Australia - Market size and forecast 2025-2030 ($ million)
Chart on Australia - Year-over-year growth 2025-2030 (%)
Data Table on Australia - Year-over-year growth 2025-2030 (%)

12.4 North America - Market size and forecast 2025-2030

Chart on North America - Market size and forecast 2025-2030 ($ million)
Data Table on North America - Market size and forecast 2025-2030 ($ million)
Chart on North America - Year-over-year growth 2025-2030 (%)
Data Table on North America - Year-over-year growth 2025-2030 (%)
Chart on Regional Comparison - North America
Data Table on Regional Comparison - North America

12.4.1 US - Market size and forecast 2025-2030

Chart on US - Market size and forecast 2025-2030 ($ million)
Data Table on US - Market size and forecast 2025-2030 ($ million)
Chart on US - Year-over-year growth 2025-2030 (%)
Data Table on US - Year-over-year growth 2025-2030 (%)

12.4.2 Canada - Market size and forecast 2025-2030

Chart on Canada - Market size and forecast 2025-2030 ($ million)
Data Table on Canada - Market size and forecast 2025-2030 ($ million)
Chart on Canada - Year-over-year growth 2025-2030 (%)
Data Table on Canada - Year-over-year growth 2025-2030 (%)

12.4.3 Mexico - Market size and forecast 2025-2030

Chart on Mexico - Market size and forecast 2025-2030 ($ million)
Data Table on Mexico - Market size and forecast 2025-2030 ($ million)
Chart on Mexico - Year-over-year growth 2025-2030 (%)
Data Table on Mexico - Year-over-year growth 2025-2030 (%)

12.5 Europe - Market size and forecast 2025-2030

Chart on Europe - Market size and forecast 2025-2030 ($ million)
Data Table on Europe - Market size and forecast 2025-2030 ($ million)
Chart on Europe - Year-over-year growth 2025-2030 (%)
Data Table on Europe - Year-over-year growth 2025-2030 (%)
Chart on Regional Comparison - Europe
Data Table on Regional Comparison - Europe

12.5.1 Germany - Market size and forecast 2025-2030

Chart on Germany - Market size and forecast 2025-2030 ($ million)
Data Table on Germany - Market size and forecast 2025-2030 ($ million)
Chart on Germany - Year-over-year growth 2025-2030 (%)
Data Table on Germany - Year-over-year growth 2025-2030 (%)

12.5.2 UK - Market size and forecast 2025-2030

Chart on UK - Market size and forecast 2025-2030 ($ million)
Data Table on UK - Market size and forecast 2025-2030 ($ million)
Chart on UK - Year-over-year growth 2025-2030 (%)
Data Table on UK - Year-over-year growth 2025-2030 (%)

12.5.3 France - Market size and forecast 2025-2030

Chart on France - Market size and forecast 2025-2030 ($ million)
Data Table on France - Market size and forecast 2025-2030 ($ million)
Chart on France - Year-over-year growth 2025-2030 (%)
Data Table on France - Year-over-year growth 2025-2030 (%)

12.5.4 Italy - Market size and forecast 2025-2030

Chart on Italy - Market size and forecast 2025-2030 ($ million)
Data Table on Italy - Market size and forecast 2025-2030 ($ million)
Chart on Italy - Year-over-year growth 2025-2030 (%)
Data Table on Italy - Year-over-year growth 2025-2030 (%)

12.5.5 Spain - Market size and forecast 2025-2030

Chart on Spain - Market size and forecast 2025-2030 ($ million)
Data Table on Spain - Market size and forecast 2025-2030 ($ million)
Chart on Spain - Year-over-year growth 2025-2030 (%)
Data Table on Spain - Year-over-year growth 2025-2030 (%)

12.5.6 The Netherlands - Market size and forecast 2025-2030

Chart on The Netherlands - Market size and forecast 2025-2030 ($ million)
Data Table on The Netherlands - Market size and forecast 2025-2030 ($ million)
Chart on The Netherlands - Year-over-year growth 2025-2030 (%)
Data Table on The Netherlands - Year-over-year growth 2025-2030 (%)

12.6 South America - Market size and forecast 2025-2030

Chart on South America - Market size and forecast 2025-2030 ($ million)
Data Table on South America - Market size and forecast 2025-2030 ($ million)
Chart on South America - Year-over-year growth 2025-2030 (%)
Data Table on South America - Year-over-year growth 2025-2030 (%)
Chart on Regional Comparison - South America
Data Table on Regional Comparison - South America

12.6.1 Brazil - Market size and forecast 2025-2030

Chart on Brazil - Market size and forecast 2025-2030 ($ million)
Data Table on Brazil - Market size and forecast 2025-2030 ($ million)
Chart on Brazil - Year-over-year growth 2025-2030 (%)
Data Table on Brazil - Year-over-year growth 2025-2030 (%)

12.6.2 Argentina - Market size and forecast 2025-2030

Chart on Argentina - Market size and forecast 2025-2030 ($ million)
Data Table on Argentina - Market size and forecast 2025-2030 ($ million)
Chart on Argentina - Year-over-year growth 2025-2030 (%)
Data Table on Argentina - Year-over-year growth 2025-2030 (%)

12.6.3 Chile - Market size and forecast 2025-2030

Chart on Chile - Market size and forecast 2025-2030 ($ million)
Data Table on Chile - Market size and forecast 2025-2030 ($ million)
Chart on Chile - Year-over-year growth 2025-2030 (%)
Data Table on Chile - Year-over-year growth 2025-2030 (%)

12.7 Middle East and Africa - Market size and forecast 2025-2030

Chart on Middle East and Africa - Market size and forecast 2025-2030 ($ million)
Data Table on Middle East and Africa - Market size and forecast 2025-2030 ($ million)
Chart on Middle East and Africa - Year-over-year growth 2025-2030 (%)
Data Table on Middle East and Africa - Year-over-year growth 2025-2030 (%)
Chart on Regional Comparison - Middle East and Africa
Data Table on Regional Comparison - Middle East and Africa

12.7.1 Saudi Arabia - Market size and forecast 2025-2030

Chart on Saudi Arabia - Market size and forecast 2025-2030 ($ million)
Data Table on Saudi Arabia - Market size and forecast 2025-2030 ($ million)
Chart on Saudi Arabia - Year-over-year growth 2025-2030 (%)
Data Table on Saudi Arabia - Year-over-year growth 2025-2030 (%)

12.7.2 UAE - Market size and forecast 2025-2030

Chart on UAE - Market size and forecast 2025-2030 ($ million)
Data Table on UAE - Market size and forecast 2025-2030 ($ million)
Chart on UAE - Year-over-year growth 2025-2030 (%)
Data Table on UAE - Year-over-year growth 2025-2030 (%)

12.7.3 Turkey - Market size and forecast 2025-2030

Chart on Turkey - Market size and forecast 2025-2030 ($ million)
Data Table on Turkey - Market size and forecast 2025-2030 ($ million)
Chart on Turkey - Year-over-year growth 2025-2030 (%)
Data Table on Turkey - Year-over-year growth 2025-2030 (%)

12.7.4 South Africa - Market size and forecast 2025-2030

Chart on South Africa - Market size and forecast 2025-2030 ($ million)
Data Table on South Africa - Market size and forecast 2025-2030 ($ million)
Chart on South Africa - Year-over-year growth 2025-2030 (%)
Data Table on South Africa - Year-over-year growth 2025-2030 (%)

12.7.5 Israel - Market size and forecast 2025-2030

Chart on Israel - Market size and forecast 2025-2030 ($ million)
Data Table on Israel - Market size and forecast 2025-2030 ($ million)
Chart on Israel - Year-over-year growth 2025-2030 (%)
Data Table on Israel - Year-over-year growth 2025-2030 (%)

12.8 Market opportunity by geography

Market opportunity by geography ($ million)
Data Tables on Market opportunity by geography ($ million)

13. Drivers, Challenges, and Opportunity

13.1 Market drivers

Rapid industrialization and automation expansion
Proliferation of sensitive consumer electronics
Expansion of data centers infrastructure

13.2 Market challenges

Grid infrastructure and power fluctuation
Component cost and price pressure
Rapid technological evolution and integration

13.3 Impact of drivers and challenges

Impact of drivers and challenges in 2025 and 2030

13.4 Market opportunities

Proliferation of smart home ecosystems
Integration of renewable energy sources
Rise of IoT enabled stabilizers

14. Competitive Landscape

14.1 Overview

14.2

Overview on criticality of inputs and factors of differentiation

14.3 Landscape disruption

Overview on factors of disruption

14.4 Industry risks

Impact of key risks on business

15. Competitive Analysis

15.1 Companies profiled

Companies covered

15.2 Company ranking index

15.3 Market positioning of companies

Matrix on companies position and classification

15.4 ABB Ltd.

ABB Ltd. - Overview
ABB Ltd. - Business segments
ABB Ltd. - Key news
ABB Ltd. - Key offerings
ABB Ltd. - Segment focus
SWOT

15.5 Ashley Edison International Ltd.

Ashley Edison International Ltd. - Overview
Ashley Edison International Ltd. - Product / Service
Ashley Edison International Ltd. - Key offerings
SWOT

15.6 CHINT Group

CHINT Group - Overview
CHINT Group - Product / Service
CHINT Group - Key offerings
SWOT

15.7 Delixi Electric Ltd.

Delixi Electric Ltd. - Overview
Delixi Electric Ltd. - Product / Service
Delixi Electric Ltd. - Key offerings
SWOT

15.8 Eaton Corp. Plc

Eaton Corp. Plc - Overview
Eaton Corp. Plc - Business segments
Eaton Corp. Plc - Key news
Eaton Corp. Plc - Key offerings
Eaton Corp. Plc - Segment focus
SWOT

15.9 Microtek International Pvt. Ltd.

Microtek International Pvt. Ltd. - Overview
Microtek International Pvt. Ltd. - Product / Service
Microtek International Pvt. Ltd. - Key offerings
SWOT

15.10 Ortea Next S.p.A.

Ortea Next S.p.A. - Overview
Ortea Next S.p.A. - Product / Service
Ortea Next S.p.A. - Key offerings
SWOT

15.11 SAKO Power Group

SAKO Power Group - Overview
SAKO Power Group - Product / Service
SAKO Power Group - Key offerings
SWOT

15.12 Schneider Electric SE

Schneider Electric SE - Overview
Schneider Electric SE - Business segments
Schneider Electric SE - Key news
Schneider Electric SE - Key offerings
Schneider Electric SE - Segment focus
SWOT

15.13 Servokon System Ltd.

Servokon System Ltd. - Overview
Servokon System Ltd. - Product / Service
Servokon System Ltd. - Key offerings
SWOT

15.14 Siemens AG

Siemens AG - Overview
Siemens AG - Business segments
Siemens AG - Key news
Siemens AG - Key offerings
Siemens AG - Segment focus
SWOT

15.15 TENGEN Electric Co. Ltd.

TENGEN Electric Co. Ltd. - Overview
TENGEN Electric Co. Ltd. - Product / Service
TENGEN Electric Co. Ltd. - Key offerings
SWOT

15.16 TSI Power

TSI Power - Overview
TSI Power - Product / Service
TSI Power - Key offerings
SWOT

15.17 V Guard Industries Ltd.

V Guard Industries Ltd. - Overview
V Guard Industries Ltd. - Product / Service
V Guard Industries Ltd. - Key offerings
SWOT

15.18 Zhejiang Mingchele Electric Co

Zhejiang Mingchele Electric Co - Overview
Zhejiang Mingchele Electric Co - Product / Service
Zhejiang Mingchele Electric Co - Key offerings
SWOT

16. Appendix

16.1 Scope of the report

Market definition
Objectives
Notes and caveats

16.2 Inclusions and exclusions checklist

Inclusions checklist
Exclusions checklist

16.3 Currency conversion rates for US$

16.4 Research methodology

16.5 Data procurement

Information sources

16.6 Data validation

16.7 Validation techniques employed for market sizing

16.8 Data synthesis

16.9 360 degree market analysis

16.10 List of abbreviations

Research Methodology

Technavio presents a detailed picture of the market by way of study, synthesis, and summation of data from multiple sources. The analysts have presented the various facets of the market with a particular focus on identifying the key industry influencers. The data thus presented is comprehensive, reliable, and the result of extensive research, both primary and secondary.

INFORMATION SOURCES

Primary sources

  • Manufacturers and suppliers
  • Channel partners
  • Industry experts
  • Strategic decision makers

Secondary sources

  • Industry journals and periodicals
  • Government data
  • Financial reports of key industry players
  • Historical data
  • Press releases

DATA ANALYSIS

Data Synthesis

  • Collation of data
  • Estimation of key figures
  • Analysis of derived insights

Data Validation

  • Triangulation with data models
  • Reference against proprietary databases
  • Corroboration with industry experts

REPORT WRITING

Qualitative

  • Market drivers
  • Market challenges
  • Market trends
  • Five forces analysis

Quantitative

  • Market size and forecast
  • Market segmentation
  • Geographical insights
  • Competitive landscape

Interested in this report?

Get your sample now to see our research methodology and insights!

Download Now

Frequently Asked Questions

Automatic Voltage Stabilizer market growth will increase by USD 5725.1 million during 2026-2030.

The Automatic Voltage Stabilizer market is expected to grow at a CAGR of 5.1% during 2026-2030.

Automatic Voltage Stabilizer market is segmented by Type (Single phase automatic voltage stabilizers, Three phase automatic voltage stabilizers) Application (Commercial, Household, Industrial) Technology (Relay-based stabilizers, Servo-controlled stabilizers, Solid-state stabilizers)

ABB Ltd., Ashley Edison International Ltd., CHINT Group, CnC Electric Group Co. Ltd., Delixi Electric Ltd., Eaton Corp. Plc, EVADA Electronics Co. Ltd., Honle Group Co. Ltd., IREM S.p.A., Lingfran Electric Co. Ltd., Microtek International Pvt. Ltd., Ortea Next S.p.A., SAKO Power Group, Salicru S.A., Schneider Electric SE, Servokon System Ltd., Siemens AG, Sollatek Electronics Ltd., Staco Energy Products Co., TENGEN Electric Co. Ltd., TSI Power, V Guard Industries Ltd., Zhejiang Mingchele Electric Co are a few of the key vendors in the Automatic Voltage Stabilizer market.

Europe will register the highest growth rate of 32.1% among the other regions. Therefore, the Automatic Voltage Stabilizer market in Europe is expected to garner significant business opportunities for the vendors during the forecast period.

China, India, Japan, South Korea, Indonesia, Australia, US, Canada, Mexico, Germany, UK, France, Italy, Spain, The Netherlands, Brazil, Argentina, Chile, Saudi Arabia, UAE, Turkey, South Africa, Israel

  • Rapid industrialization and automation expansion is the driving factor this market.

The Automatic Voltage Stabilizer market vendors should focus on grabbing business opportunities from the Type segment as it accounted for the largest market share in the base year.
RIA - Research AI Assistant
Ask RIA
