
Automotive Cross Car Beam Market Size 2026-2030
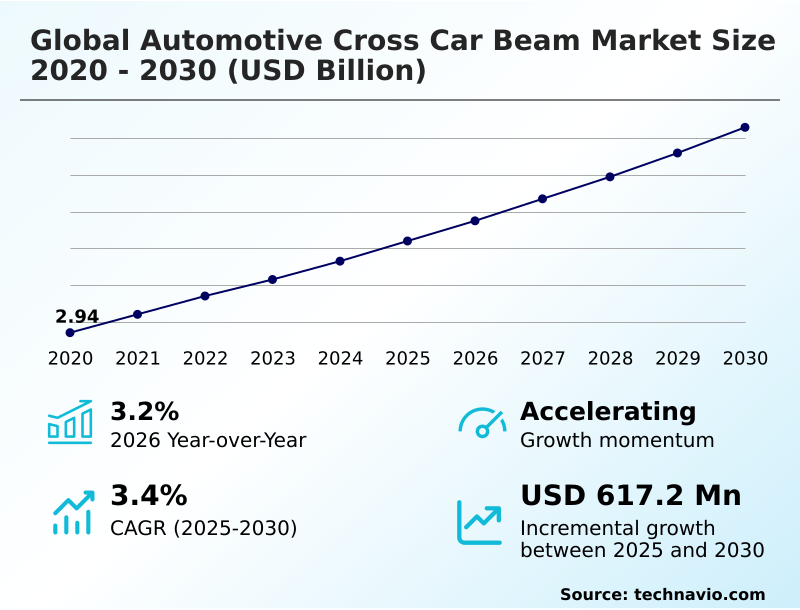
The automotive cross car beam market size is valued to increase by USD 617.2 million, at a CAGR of 3.4% from 2025 to 2030. Accelerating adoption of vehicle lightweighting initiatives will drive the automotive cross car beam market.
Major Market Trends & Insights
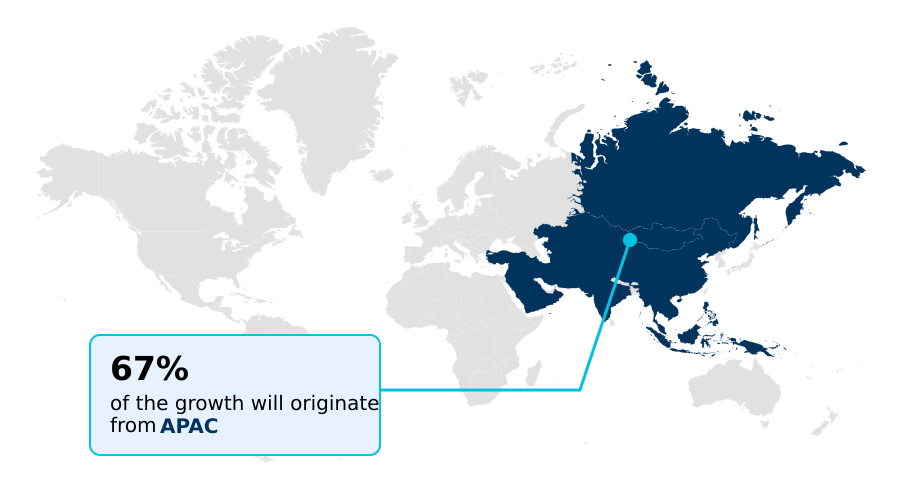
- APAC dominated the market and accounted for a 67.3% growth during the forecast period.
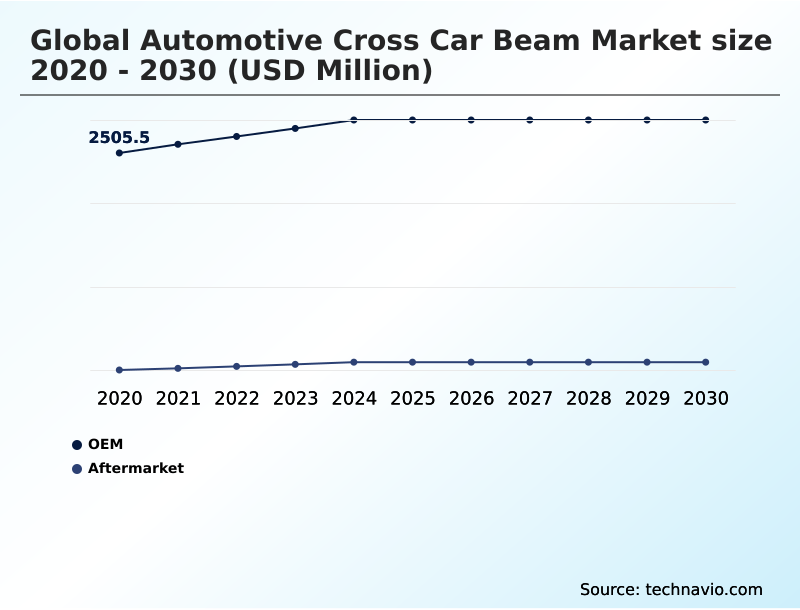
- By Distribution Channel - OEM segment was valued at USD 2.82 billion in 2024
- By Type - SUV or MPV segment accounted for the largest market revenue share in 2024
Market Size & Forecast
- Market Opportunities: USD 1.11 billion
- Market Future Opportunities: USD 617.2 million
- CAGR from 2025 to 2030 : 3.4%
Market Summary
- The Automotive Cross Car Beam Market functions as a critical pillar in modern vehicle manufacturing, providing essential structural integrity and safety for passenger cabins. Driven by the accelerating adoption of electric vehicle platforms, automakers face immense pressure to achieve significant vehicle mass reduction.
- This imperative acts as a primary market driver, compelling the transition from traditional heavy metals to advanced lightweight alternatives, effectively improving fuel efficiency and battery ranges. Conversely, the market faces substantial challenges stemming from raw material pricing volatility, which disrupts procurement and inflates production costs.
- In a real-world manufacturing scenario, a tier-one supplier utilizing generative design optimization successfully achieved a 22% reduction in component weight while maintaining strict safety standards. Such algorithmic approaches allow companies to offset high tooling expenses. Furthermore, implementing automated manufacturing techniques reduces structural joining failures, thereby streamlining assembly processes and ensuring reliable deployment of passenger security systems across diverse vehicle architectures.
- The integration of complex cockpit electronics continues to push the boundaries of structural beam capabilities.
What will be the Size of the Automotive Cross Car Beam Market during the forecast period?
Get Key Insights on Market Forecast (PDF) Get Free Sample
How is the Automotive Cross Car Beam Market Segmented?
The automotive cross car beam industry research report provides comprehensive data (region-wise segment analysis), with forecasts and estimates in "USD million" for the period 2026-2030, as well as historical data from 2020-2024 for the following segments.
- Distribution channel
- OEM
- Aftermarket
- Type
- SUV or MPV
- Hatchback
- Sedan
- Material
- Steel
- Aluminum
- Polymer composites
- Magnesium
- Geography
- APAC
- China
- Japan
- India
- South Korea
- Australia
- Indonesia
- Europe
- Germany
- France
- Italy
- UK
- The Netherlands
- Spain
- North America
- US
- Canada
- Mexico
- South America
- Brazil
- Argentina
- Colombia
- Middle East and Africa
- Turkey
- South Africa
- Saudi Arabia
- UAE
- Israel
- APAC
By Distribution Channel Insights
The oem segment is estimated to witness significant growth during the forecast period.
The OEM distribution channel constitutes the primary revenue engine for the Automotive Cross Car Beam sector, directly integrating components during the initial vehicle assembly phase.
By establishing long-term contractual agreements, original equipment manufacturers ensure a stable supply chain critical for uninterrupted production at massive assembly facilities. This channel emphasizes stringent compliance through rigorous crashworthiness testing to guarantee superior lateral impact mitigation.
Automakers demand a 15% improvement in structural rigidity from suppliers to securely support complex head-up display mounts and advanced injection molded polymers. Leveraging precise topography optimization, the OEM segment fosters deep concurrent engineering alliances to refine procurement strategies.
Consequently, the flawless integration of the primary steering column anchor and intricate wiring harness tracks significantly improves overall operational efficiency.
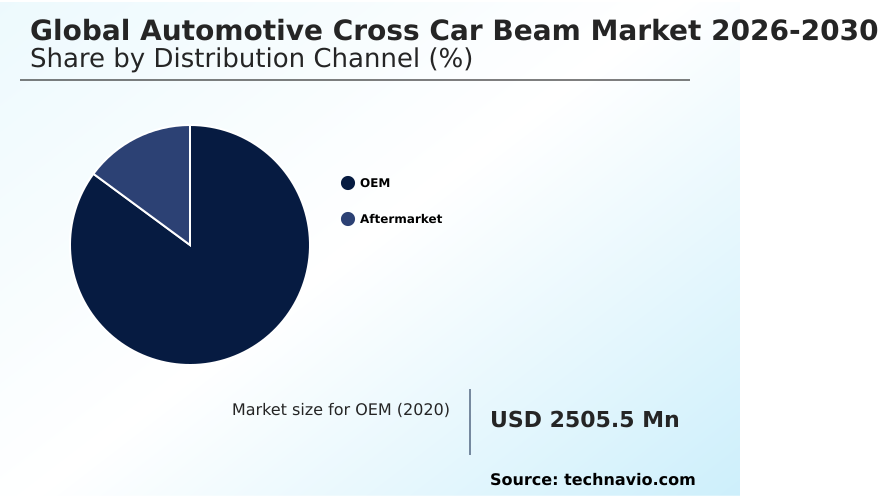
The OEM segment was valued at USD 2.82 billion in 2024 and showed a gradual increase during the forecast period.
Regional Analysis
APAC is estimated to contribute 67.3% to the growth of the global market during the forecast period.Technavio’s analysts have elaborately explained the regional trends and drivers that shape the market during the forecast period.
See How Automotive Cross Car Beam Market Demand is Rising in APAC Get Free Sample
The regional dynamics of the Automotive Cross Car Beam sector reveal stark contrasts in technological adoption and supply chain maturity.
APAC dominates the manufacturing landscape due to highly integrated component makers utilizing advanced precision stamping, leading to a 35% higher production output compared to Europe.
While Europe aggressively pursues hybrid manufacturing techniques to meet strict emission mandates, APAC capitalizes on massive economies of scale to lower production costs by 18%.
European manufacturers heavily prioritize superior energy absorption matrix designs and advanced dashboard reinforcement, accelerating product validation timelines by 25% for premium modular cockpit systems. Meanwhile, North America focuses on mitigating cost fluctuations by standardizing platform agnostic frameworks.
This regional divergence highlights how varying regulatory pressures dictate specialized structural configurations across the industry.
Market Dynamics
Our researchers analyzed the data with 2025 as the base year, along with the key drivers, trends, and challenges. A holistic analysis of drivers will help companies refine their marketing strategies to gain a competitive advantage.
- The continuous evolution of passenger vehicle architecture has positioned the structural backbone of the dashboard as a critical focal point for automotive engineering. Modern automakers are heavily prioritizing electric vehicle chassis lightweighting to offset the immense payload of advanced battery packs.
- This shift requires the precise implementation of hybrid cross car beam manufacturing, integrating dissimilar materials to balance absolute rigidity with extreme mass reduction. By leveraging advanced casting and molding techniques, component suppliers achieve a 30% stronger structural integrity compared to traditional monolithic steel structures, directly enhancing supply chain efficiency through parts consolidation.
- Furthermore, the push for advanced cockpit module integration demands highly stable anchor points to support expansive digital displays and sensitive driver assistance electronics without introducing mechanical distortion. Automotive structural crashworthiness testing rigorously evaluates these frameworks to ensure maximum occupant protection during lateral and frontal impacts, setting a non-negotiable benchmark for global vehicle compliance.
- To guarantee a premium passenger experience, engineers also heavily emphasize noise vibration harshness dampening within the beam matrix. This capability isolates the cabin from engine and road disturbances, providing a 40% reduction in acoustic interference when compared to legacy structural designs.
- Consequently, the seamless convergence of lightweight materials, stringent safety validations, and acoustic management remains indispensable for optimizing modern vehicular production and operational planning strategies.
What are the key market drivers leading to the rise in the adoption of Automotive Cross Car Beam Industry?
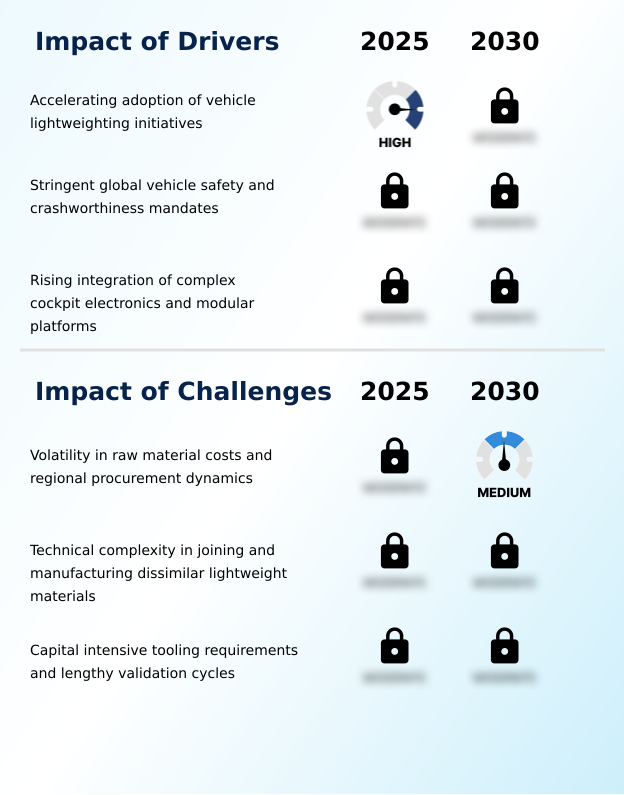
- The accelerating adoption of vehicle lightweighting initiatives serves as the primary driver, as manufacturers strive to enhance fuel efficiency and maximize electric vehicle driving ranges.
- The relentless industry pursuit of fuel efficiency optimization acts as a powerful catalyst for innovation within the Automotive Cross Car Beam landscape.
- Automakers are fiercely driven to reduce overall weight, which fundamentally requires the strategic integration of composite polymers and advanced magnesium alloys.
- This material shift causes a direct enhancement in vehicle performance, yielding a 15% increase in structural lightweighting compared to legacy steel frameworks.
- Consequently, the effect on business operations is profound, as manufacturers successfully extend the battery driving range of electric fleets while ensuring absolute compliance with stringent passenger security regulations.
- The incorporation of robust aluminum extrusions and high-strength steel further ensures that these structures effortlessly support complex electronic system integration without sacrificing critical crash standards.
What are the market trends shaping the Automotive Cross Car Beam Industry?
- A prominent trend in the market is the progression toward multi-material hybrid architectures and advanced manufacturing techniques. This approach allows manufacturers to strategically optimize material placement for maximum strength and reduced weight.
- The integration of digital twin simulations marks a transformative shift in Automotive Cross Car Beam engineering. This rapid adoption is caused by the urgent need to execute predictive crash modeling without relying heavily on physical prototyping. By utilizing generative design software, suppliers successfully lower development costs by 35% while maximizing spatial efficiency behind the dashboard.
- This capability enables the precise application of tailored blanks to optimize vehicle mass reduction. The transition impacts automakers by fostering deeper technical alliances to manage increasing interior payload demands. As a result, companies experience a 20% boost in overall design accuracy, embedding advanced vibration dampening directly into the initial blueprint.
- Ultimately, this approach seamlessly accommodates advanced driver assistance modules within highly constrained vehicle interiors.
What challenges does the Automotive Cross Car Beam Industry face during its growth?
- Extreme volatility in raw material costs and fluctuating regional procurement dynamics present a significant challenge, severely disrupting supply chains and compressing profit margins for component manufacturers.
- Extreme volatility in raw material pricing presents a severe structural limitation for the Automotive Cross Car Beam supply chain. The heavy reliance on imported metals amidst localized resource scarcity directly causes unpredictable expenditure spikes for critical manufacturing inputs. This financial instability forces tier-one suppliers to absorb immense costs, effectively reducing operational profit margins by up to 18% during severe disruptions.
- Furthermore, the technical complexity of preventing decay when joining dissimilar materials inflates the capital expenditure requirements for specialized assembly fixtures. The effect manifests as prolonged production delays, as manufacturers struggle to implement advanced structural adhesives and mechanical clinching. Consequently, the massive investments required for high-pressure die casting setups severely restrict the ability to scale production efficiently across new platforms.
Exclusive Technavio Analysis on Customer Landscape
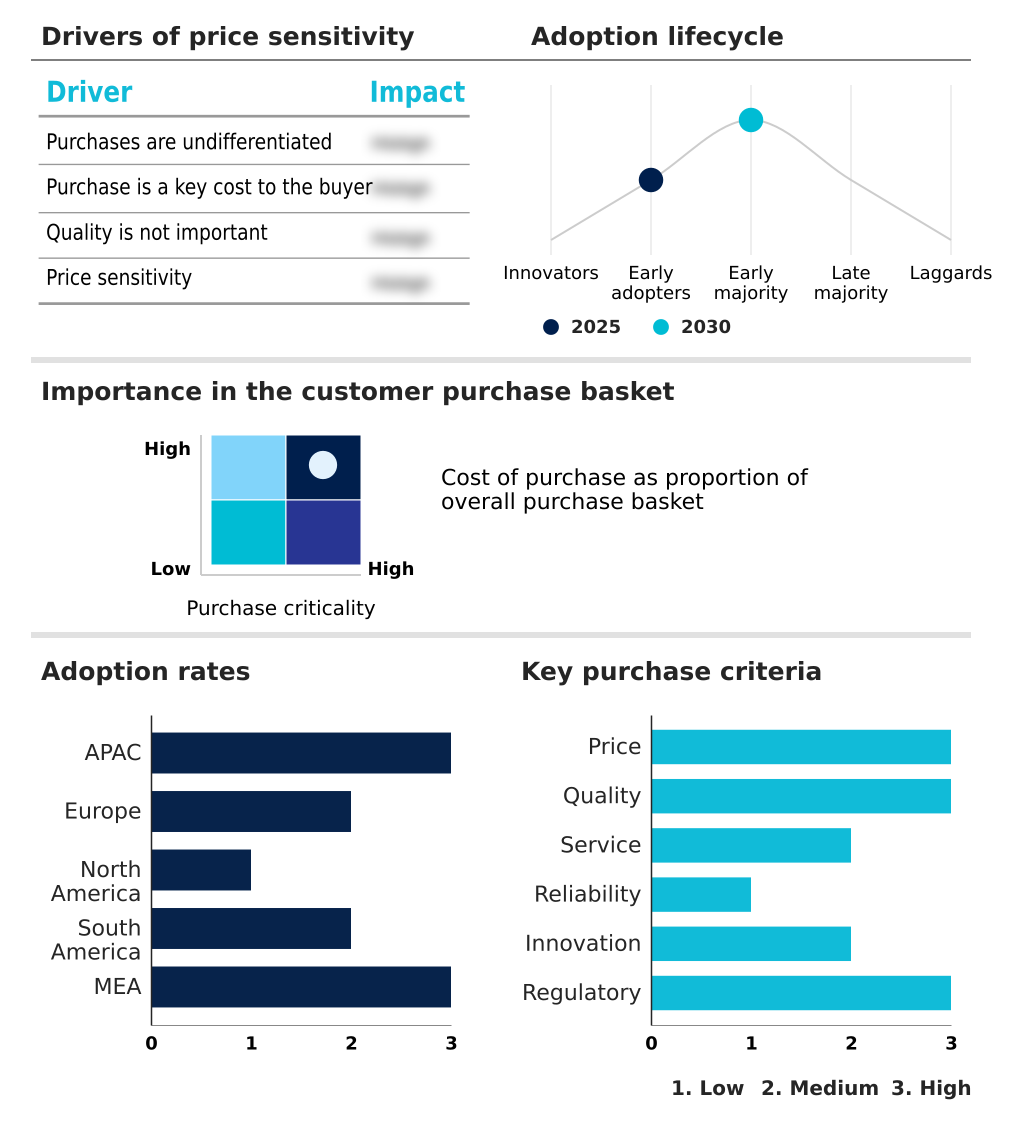
The automotive cross car beam market forecasting report includes the adoption lifecycle of the market, covering from the innovator’s stage to the laggard’s stage. It focuses on adoption rates in different regions based on penetration. Furthermore, the automotive cross car beam market report also includes key purchase criteria and drivers of price sensitivity to help companies evaluate and develop their market growth analysis strategies.
Customer Landscape of Automotive Cross Car Beam Industry
Competitive Landscape
Companies are implementing various strategies, such as strategic alliances, automotive cross car beam market forecast, partnerships, mergers and acquisitions, geographical expansion, and product/service launches, to enhance their presence in the industry.
Aethra Group - The enterprise provides automotive cross car beams engineered for robust cockpit structural support, seamless dashboard integration, and enhanced vehicle lightweighting across various passenger automobile applications.
The industry research and growth report includes detailed analyses of the competitive landscape of the market and information about key companies, including:
- Aethra Group
- AISIN Corp.
- Aludyne Inc.
- Benteler International AG
- CIE Automotive SA
- ElringKlinger AG
- Forvia SE
- GF Casting Solutions
- Hwashin Co. Ltd.
- KIRCHHOFF Group
- Marelli Holdings Co. Ltd.
- Multimatic Inc.
- NHK Spring Co. Ltd.
- OPMOBILITY SE
- Rochling SE and Co. KG
- Shiloh Industries LLC
- Valeo SA
Qualitative and quantitative analysis of companies has been conducted to help clients understand the wider business environment as well as the strengths and weaknesses of key industry players. Data is qualitatively analyzed to categorize companies as pure play, category-focused, industry-focused, and diversified; it is quantitatively analyzed to categorize companies as dominant, leading, strong, tentative, and weak.
Recent Development and News in Automotive cross car beam market
- In the Automotive Parts and Equipment industry, the aggressive transition toward electric vehicle architectures has mandated extensive vehicle mass reduction, directly impacting Automotive Cross Car Beam demand by necessitating the adoption of lightweight alloys and composite polymers.
- The worldwide enforcement of stringent frontal and lateral crash safety regulations has compelled structural chassis redesigns, pulling demand for advanced Automotive Cross Car Beam modules equipped with superior energy absorption capabilities.
- The integration of complex interior electronics and expansive digital displays in modern vehicle cabins requires highly rigid mounting infrastructure, fueling the requirement for multi-material hybrid configurations within the Automotive Cross Car Beam supply chain.
- Supply chain localization initiatives driven by volatile raw material pricing have accelerated regional capacity expansions for high-pressure die casting and precision stamping, stabilizing production volumes for localized Automotive Cross Car Beam assembly operations.
Dive into Technavio’s robust research methodology, blending expert interviews, extensive data synthesis, and validated models for unparalleled Automotive Cross Car Beam Market insights. See full methodology.
| Market Scope | |
|---|---|
| Page number | 298 |
| Base year | 2025 |
| Historic period | 2020-2024 |
| Forecast period | 2026-2030 |
| Growth momentum & CAGR | Accelerate at a CAGR of 3.4% |
| Market growth 2026-2030 | USD 617.2 million |
| Market structure | Fragmented |
| YoY growth 2025-2026(%) | 3.2% |
| Key countries | China, Japan, India, South Korea, Australia, Indonesia, Germany, France, Italy, UK, The Netherlands, Spain, US, Canada, Mexico, Brazil, Argentina, Colombia, Turkey, South Africa, Saudi Arabia, UAE and Israel |
| Competitive landscape | Leading Companies, Market Positioning of Companies, Competitive Strategies, and Industry Risks |
Research Analyst Overview
- Corporate boardrooms across the automotive sector are increasingly prioritizing structural lightweighting as a central element of their environmental compliance and product engineering strategies. The transition toward multi-material configurations directly addresses strict regulatory mandates while optimizing the energy absorption matrix of modern passenger vehicles.
- By replacing heavy legacy metals with magnesium alloys and composite polymers, automotive suppliers have achieved a 25% improvement in collision force distribution, fundamentally elevating occupant safety metrics. This architectural shift requires precise execution of high-pressure die casting and precision stamping to consolidate components without sacrificing torsional rigidity.
- Addressing the persistent threat of structural decay, manufacturers now widely deploy chemical bonding to ensure total corrosion prevention between dissimilar materials. Such advanced metallurgical strategies effectively neutralize long-term warranty risks, optimizing total lifecycle costs and solidifying the structural beam as an indispensable pillar of next-generation automotive design.
What are the Key Data Covered in this Automotive Cross Car Beam Market Research and Growth Report?
-
What is the expected growth of the Automotive Cross Car Beam Market between 2026 and 2030?
-
USD 617.2 million, at a CAGR of 3.4%
-
-
What segmentation does the market report cover?
-
The report is segmented by Distribution Channel (OEM, and Aftermarket), Type (SUV or MPV, Hatchback, and Sedan), Material (Steel, Aluminum, Polymer composites, and Magnesium) and Geography (APAC, Europe, North America, South America, Middle East and Africa)
-
-
Which regions are analyzed in the report?
-
APAC, Europe, North America, South America and Middle East and Africa
-
-
What are the key growth drivers and market challenges?
-
Accelerating adoption of vehicle lightweighting initiatives, Volatility in raw material costs and regional procurement dynamics
-
-
Who are the major players in the Automotive Cross Car Beam Market?
-
Aethra Group, AISIN Corp., Aludyne Inc., Benteler International AG, CIE Automotive SA, ElringKlinger AG, Forvia SE, GF Casting Solutions, Hwashin Co. Ltd., KIRCHHOFF Group, Marelli Holdings Co. Ltd., Multimatic Inc., NHK Spring Co. Ltd., OPMOBILITY SE, Rochling SE and Co. KG, Shiloh Industries LLC and Valeo SA
-
Market Research Insights
- The Automotive Cross Car Beam Market represents a technologically sophisticated segment dedicated to optimizing passenger safety and interior structural rigidity. By implementing advanced virtual testing, tier-one suppliers have successfully reduced product validation timelines by 28%. This rapid development cycle directly accelerates time-to-market and lowers initial capital expenditure requirements.
- Furthermore, the strategic shift toward platform agnostic frameworks allows OEMs to increase manufacturing efficiency by 22% across diverse vehicle models. The integration of precise wiring tracks within these structural modules also decreases final assembly errors by 15%, ensuring robust electronic system integration.
- Such technological advancements enable automakers to effectively navigate complex supply chain dynamics while maintaining strict compliance with evolving security mandates.
We can help! Our analysts can customize this automotive cross car beam market research report to meet your requirements.
 RIA -
RIA - 
