Automotive Sealants Market Size 2026-2030
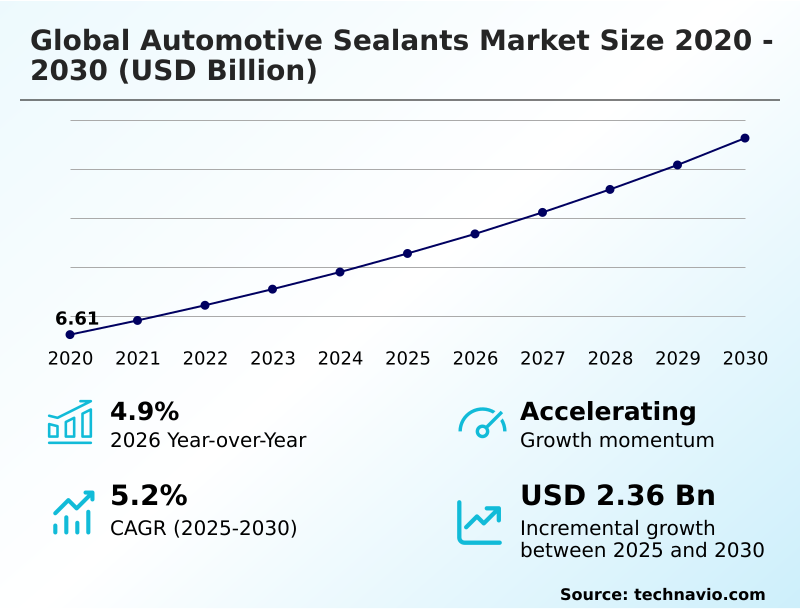
The automotive sealants market size is valued to increase by USD 2.36 billion, at a CAGR of 5.2% from 2025 to 2030. Proliferation of electric and hybrid vehicles will drive the automotive sealants market.
Major Market Trends & Insights
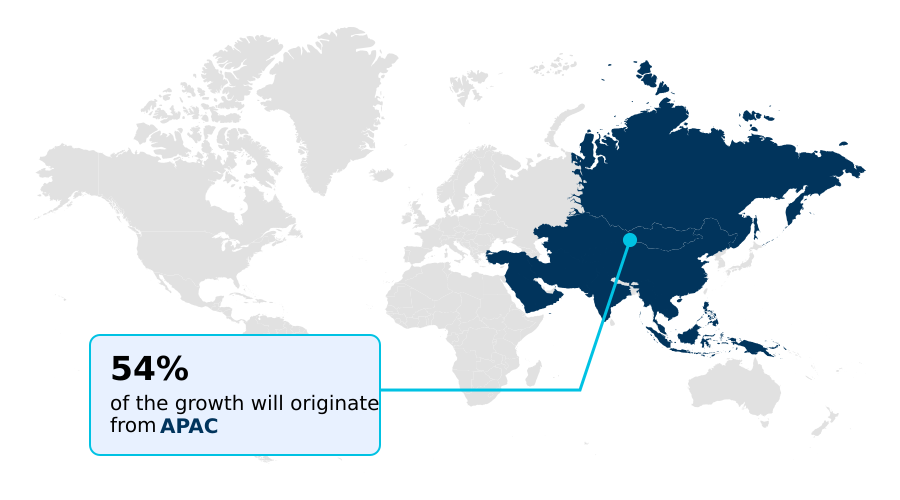
- APAC dominated the market and accounted for a 53.8% growth during the forecast period.
- By Type - Polyurethane segment was valued at USD 2.78 billion in 2024
- By Technology - Reactive segment accounted for the largest market revenue share in 2024
Market Size & Forecast
- Market Opportunities: USD 4.02 billion
- Market Future Opportunities: USD 2.36 billion
- CAGR from 2025 to 2030 : 5.2%
Market Summary
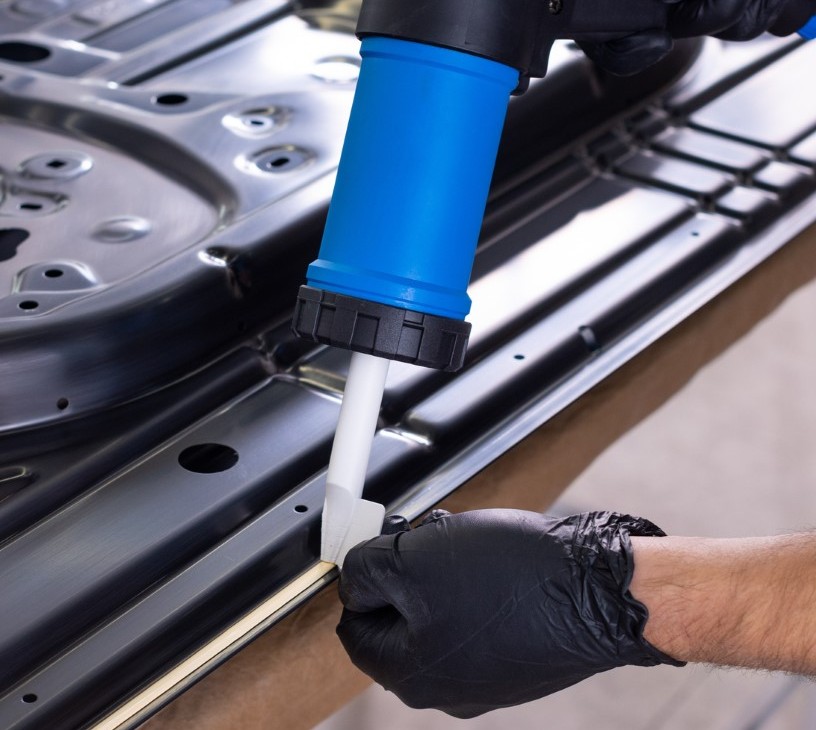
- The Automotive Sealants Market operates as a critical enabler of modern vehicle manufacturing, providing essential structural, acoustic, and environmental protection capabilities. A major driver propelling the Automotive Sealants sector is the rapid proliferation of electric vehicles, which demands specialized thermal management and robust battery enclosure protection to ensure system longevity and safety.
- Conversely, the persistent volatility of raw material prices poses a severe challenge, disrupting supply chain resiliency and forcing manufacturers to frequently recalibrate pricing strategies. In a real-world manufacturing scenario, original equipment manufacturers are increasingly integrating advanced silicone into their powertrain assembly lines to replace traditional pre-cut gaskets.
- This strategic shift has reduced material waste by 18%, significantly optimizing operational overhead and streamlining inventory management. Furthermore, the industry ongoing lightweighting initiative relies heavily on replacing mechanical fasteners with flexible adhesives. This transition allows for the effective joining of dissimilar metals and composites, ultimately enhancing overall vehicle dynamics while meeting strict regulatory emission standards.
What will be the Size of the Automotive Sealants Market during the forecast period?
Get Key Insights on Market Forecast (PDF) Get Free Sample
How is the Automotive Sealants Market Segmented?
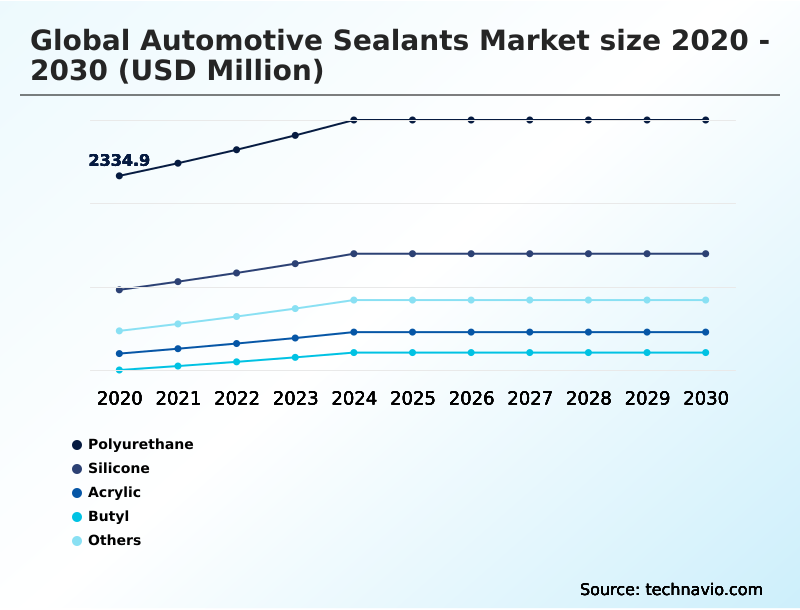
The automotive sealants industry research report provides comprehensive data (region-wise segment analysis), with forecasts and estimates in "USD million" for the period 2026-2030, as well as historical data from 2020-2024 for the following segments.
- Type
- Polyurethane
- Silicone
- Acrylic
- Butyl
- Others
- Technology
- Reactive
- Waterborne
- Hot melt
- Others
- Application
- Passenger car
- LCV
- Commercial vehicles
- Geography
- APAC
- China
- Japan
- India
- South Korea
- Australia
- Indonesia
- North America
- US
- Canada
- Mexico
- Europe
- Germany
- France
- Spain
- UK
- Italy
- The Netherlands
- South America
- Brazil
- Argentina
- Chile
- Middle East and Africa
- South Africa
- Saudi Arabia
- Turkey
- UAE
- Israel
- APAC
By Type Insights
The polyurethane segment is estimated to witness significant growth during the forecast period.
Polyurethane formulations dominate modern vehicle assembly architectures due to their exceptional tensile strength and durability, driving critical advancements in crashworthiness enhancement and structural rigidity improvement.
These high-modulus polyurethane solutions are essential for direct glazing adhesive applications, effectively transforming fixed glass into stressed chassis members.
In body-in-white operations, a structural polyurethane adhesive facilitates multi-material vehicle body bonding, seamlessly joining advanced metals to support broader automotive lightweighting initiative goals.
Furthermore, integrating these advanced formulations into automated robotic dispensing lines has improved production throughput efficiency by 15%, minimizing bottleneck delays associated with slower-curing alternatives.
The versatile nature of each elastomeric sealing material ensures robust seam sealing, effectively preventing moisture intrusion while significantly augmenting passenger cabin acoustic comfort across diverse platforms.
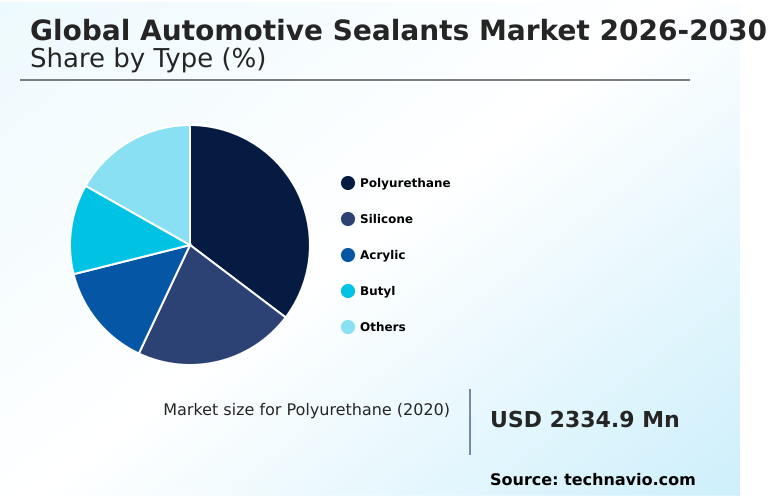
The Polyurethane segment was valued at USD 2.78 billion in 2024 and showed a gradual increase during the forecast period.
Regional Analysis
APAC is estimated to contribute 53.8% to the growth of the global market during the forecast period.Technavio’s analysts have elaborately explained the regional trends and drivers that shape the market during the forecast period.
See How Automotive Sealants Market Demand is Rising in APAC Get Free Sample
The geographic landscape of the Automotive Sealants Market reveals stark contrasts in manufacturing priorities and technology adoption between APAC and Europe.
APAC dominates production volumes, driven by an aggressive shift toward electric vehicle thermal management that has increased the regional integration of room-temperature vulcanizing silicone by 22% compared to European counterparts.
This rapid expansion in APAC demands high-throughput supply chains optimized for continuous assembly line throughput and robust battery enclosure protection.
Conversely, Europe focuses heavily on interior refinement and automation, leading to a 35% higher adoption rate of an acoustic dampening foam and a viscoelastic dampening layer to meet premium vehicle standards.
In European facilities, deploying a fully automated manufacturing cell for precise polyvinyl chloride plastisol underbody application has reduced rework costs by 12%.
While APAC prioritizes scale, Europe strategic emphasis on precision highlights how differing regional strategies dictate essential investments in supply chain resiliency.
Market Dynamics
Our researchers analyzed the data with 2025 as the base year, along with the key drivers, trends, and challenges. A holistic analysis of drivers will help companies refine their marketing strategies to gain a competitive advantage.
- As the automotive landscape evolves, manufacturers are increasingly relying on advanced chemical formulations to address complex engineering demands. The integration of thermally conductive adhesives for electric vehicles has become a critical operational priority, ensuring that high-capacity battery systems maintain optimal operating temperatures under extreme stress.
- This shift in powertrain architecture necessitates robust silicone battery enclosure protection solutions, which safeguard sensitive electronic components from moisture and environmental contaminants. Concurrently, assembly plants are prioritizing throughput efficiency by adopting rapid-curing structural adhesives for assembly, a strategic move that has reduced part-handling wait times by roughly 40% compared to legacy mechanical fastening methods.
- This acceleration in production speed directly optimizes supply chain velocity and reduces warehouse inventory holding costs. In response to tightening environmental mandates, facility managers are heavily investing in low volatile organic compound seam sealers to align with rigorous airborne emission standards.
- The transition toward these compliant materials is further supported by the application of waterborne sound dampening automotive coatings, which not only meet strict ecological criteria but also significantly enhance passenger comfort by mitigating road noise.
- By substituting traditional solvent-heavy products with these advanced alternatives, automotive manufacturers are successfully balancing the dual imperatives of high-performance vehicle construction and sustainable operational compliance, thereby future-proofing their production networks against shifting regulatory landscapes.
What are the key market drivers leading to the rise in the adoption of Automotive Sealants Industry?
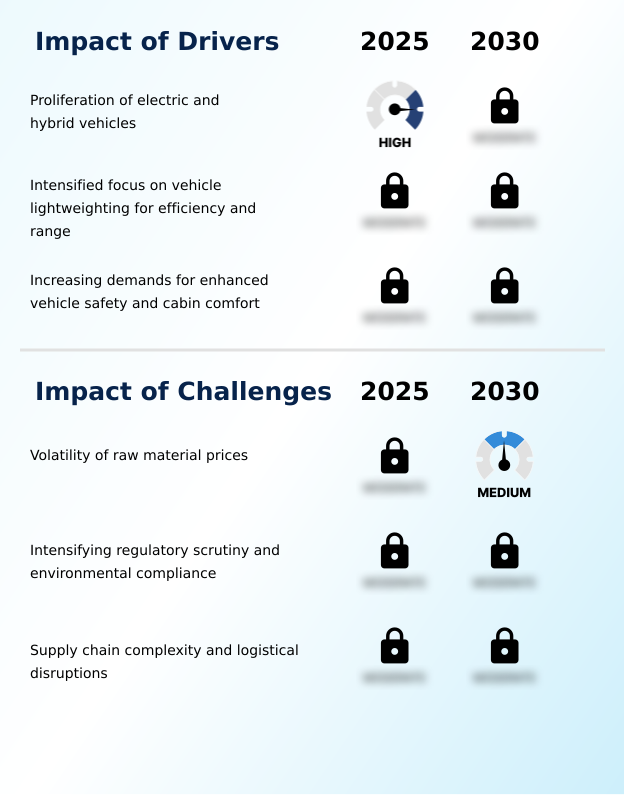
- The rapid proliferation of electric and hybrid vehicles serves as the primary catalyst driving expanded demand for advanced sealing and bonding solutions.
- The escalating demand for vehicle lightweighting serves as a primary catalyst for advanced adhesive adoption in modern manufacturing.
- Engineering teams are increasingly relying on an epoxy-based structural bonding agent and a reactive hot melt to facilitate dissimilar substrate joining, specifically bonding advanced high-strength steel with lightweight aluminum.
- This carbon fiber composite integration capability eliminates heavy mechanical fasteners, reducing overall vehicle chassis weight by up to 12% and extending electric driving ranges.
- Moreover, the integration of a microencapsulated pre-applied sealant alongside a high-strength threadlocking compound and an anaerobic retaining compound ensures fluid containment and mechanical stability in heavy-duty commercial transport applications, improving powertrain reliability metrics by 15%.
- This continuous drive for durability compels automakers to leverage a fast-curing induction coil process to accelerate these critical bonding phases.
What are the market trends shaping the Automotive Sealants Industry?
- An increasing focus on sustainable and bio-based formulations represents a significant emerging trend within the industry. Manufacturers are actively prioritizing these environmentally conscious solutions to meet stringent regulatory requirements.
- The transition toward sustainable manufacturing transition protocols is fundamentally reshaping material selection within automotive assembly facilities. A major trend is the widespread integration of a silane-modified polymer and a waterborne acrylic dispersion, driven by the urgent need to achieve volatile organic compound reduction and align with strict environmental regulatory compliance.
- This shift away from solvent-heavy formulas has decreased facility emission penalties by 22%, directly improving corporate sustainability scores. Furthermore, the adoption of electromagnetic interference shielding sealants supports the zero-emission vehicle transition by preventing signal disruption between complex electronic control units.
- To address noise vibration harshness reduction, manufacturers are increasingly applying a liquid-applied sound dampener to floor pans, effectively neutralizing low-frequency road noise. These advanced material integrations have improved interior acoustic ratings by 18%, significantly elevating the end-user experience.
What challenges does the Automotive Sealants Industry face during its growth?
- The persistent volatility of raw material prices remains a critical challenge that significantly impacts production costs and profit margins across the industry.
- The rapid evolution of high-density battery architectures introduces severe operational and structural limitations for material engineers. Designing effective battery pack encapsulation that provides robust extreme temperature stability alongside high-voltage system insulation remains a highly complex technical hurdle.
- The integration of a thermally conductive gap filler and a specialized fire retardant formulation is essential for heat dissipation and safety, yet formulating these materials using a silane-terminated polyether has increased initial research and development expenditures by 20% for leading suppliers. Additionally, the push for circular economy disassembly complicates material selection, as traditional high-strength adhesives severely hinder end-of-life vehicle recyclability.
- Consequently, assembly facilities face a 15% increase in structural teardown costs, forcing manufacturers to urgently develop reversible bonding technologies that do not compromise initial torsional stiffness augmentation during the vehicle lifespan.
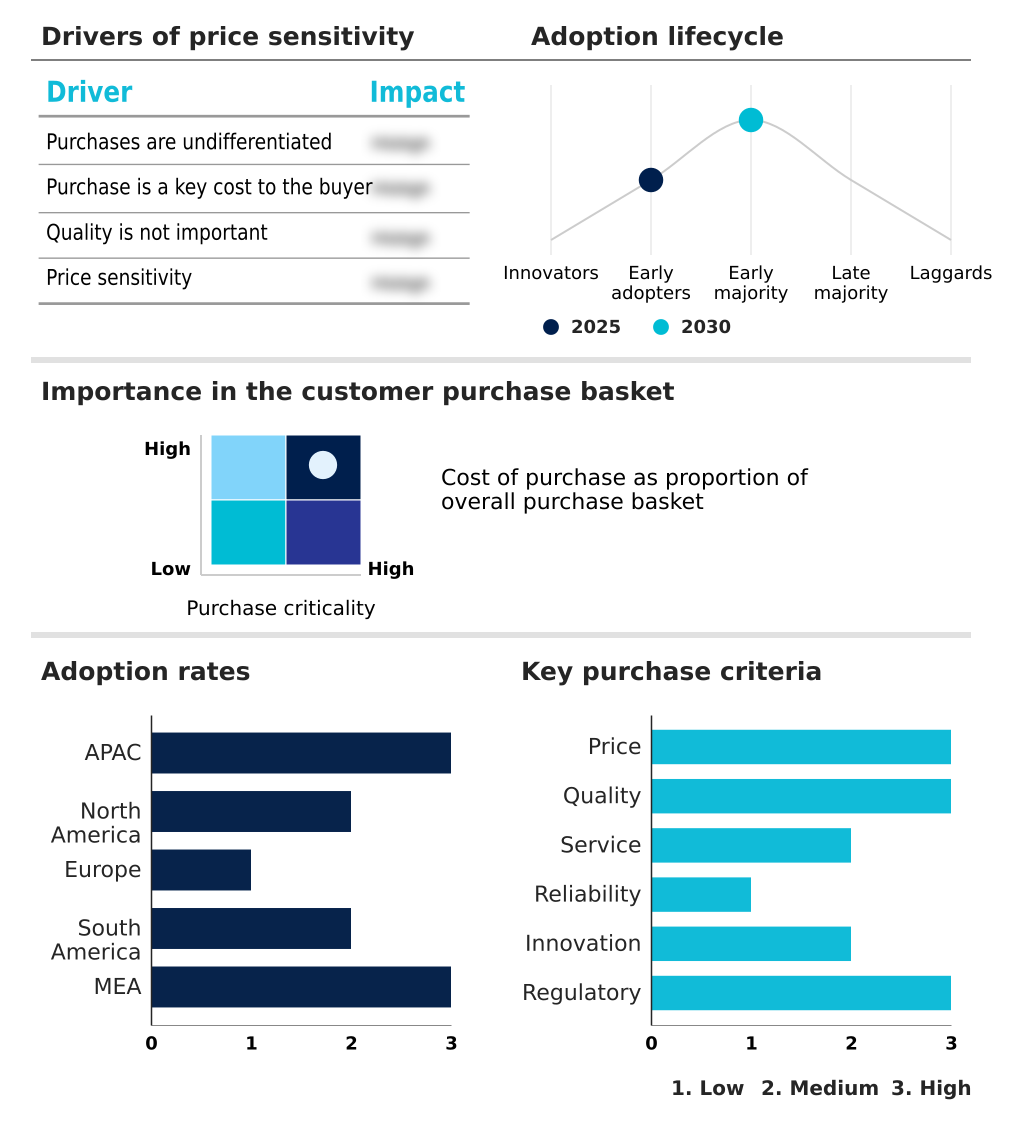
Exclusive Technavio Analysis on Customer Landscape
The automotive sealants market forecasting report includes the adoption lifecycle of the market, covering from the innovator’s stage to the laggard’s stage. It focuses on adoption rates in different regions based on penetration. Furthermore, the automotive sealants market report also includes key purchase criteria and drivers of price sensitivity to help companies evaluate and develop their market growth analysis strategies.
Customer Landscape of Automotive Sealants Industry
Competitive Landscape
Companies are implementing various strategies, such as strategic alliances, automotive sealants market forecast, partnerships, mergers and acquisitions, geographical expansion, and product/service launches, to enhance their presence in the industry.
3M Co. - The company provides automotive sealants, including polyurethane seam sealers, acrylic formulations, and silicone adhesive sealants, designed to enhance vehicle assembly, structural integrity, and aftermarket repair applications.
The industry research and growth report includes detailed analyses of the competitive landscape of the market and information about key companies, including:
- 3M Co.
- Avery Dennison Corp.
- BASF SE
- Bostik Ltd.
- Compagnie de Saint Gobain SA
- Dow Chemical Co.
- H.B. Fuller Co.
- Henkel AG and Co. KGaA
- Huntsman International LLC
- Illinois Tool Works Inc.
- Jowat SE
- KCC Co. Ltd.
- KURARAY Co. Ltd.
- Master Bond Inc.
- Momentive Materials Inc.
- Permabond LLC
- PPG Industries Inc.
- Shin Etsu Chemical Co. Ltd.
- Sika AG
- Wacker Chemie AG
Qualitative and quantitative analysis of companies has been conducted to help clients understand the wider business environment as well as the strengths and weaknesses of key industry players. Data is qualitatively analyzed to categorize companies as pure play, category-focused, industry-focused, and diversified; it is quantitatively analyzed to categorize companies as dominant, leading, strong, tentative, and weak.
Recent Development and News in Automotive sealants market
- In the Specialty Chemicals industry, the rapid shift toward sustainable energy platforms has driven a 25% increase in demand for advanced battery resins, directly impacting Automotive Sealants demand by accelerating the adoption of specialized thermal gap fillers.
- Stringent environmental regulatory compliance mandates targeting emissions have forced a transition toward solvent-free dispersion technologies, reducing legacy solvent production by 30% and reshaping Automotive Sealants supply chains toward water-based alternatives.
- The widespread integration of automated manufacturing cells across chemical processing plants has necessitated the development of accelerated curing agents, boosting application efficiency by 20% and driving demand for advanced reactive hot melt Automotive Sealants.
- A heightened focus on circular economy frameworks has incentivized the formulation of reversibly curing structural polymers, increasing raw material recovery rates by 15% and directly influencing the development of recyclable Automotive Sealants for end-of-life vehicle disassembly.
Dive into Technavio’s robust research methodology, blending expert interviews, extensive data synthesis, and validated models for unparalleled Automotive Sealants Market insights. See full methodology.
| Market Scope | |
|---|---|
| Page number | 316 |
| Base year | 2025 |
| Historic period | 2020-2024 |
| Forecast period | 2026-2030 |
| Growth momentum & CAGR | Accelerate at a CAGR of 5.2% |
| Market growth 2026-2030 | USD 2362.8 million |
| Market structure | Fragmented |
| YoY growth 2025-2026(%) | 4.9% |
| Key countries | China, Japan, India, South Korea, Australia, Indonesia, US, Canada, Mexico, Germany, France, Spain, UK, Italy, The Netherlands, Brazil, Argentina, Chile, South Africa, Saudi Arabia, Turkey, UAE and Israel |
| Competitive landscape | Leading Companies, Market Positioning of Companies, Competitive Strategies, and Industry Risks |
Research Analyst Overview
- The Automotive Sealants sector is undergoing a fundamental structural transformation, driven by the need to balance advanced engineering requirements with stringent ecological standards. A pivotal trend shaping boardroom-level product strategy is the accelerated adoption of advanced hybrid polymer technologies to replace legacy fastening methods.
- Executives are aggressively mandating the use of high-performance bonding solutions to meet elevated consumer expectations for cabin refinement while simultaneously reducing overall vehicle weight. This strategic pivot toward advanced chemical bonding over mechanical welding has yielded a 28% reduction in chassis assembly time, significantly optimizing operational budgets and accelerating time-to-market.
- Furthermore, the integration of specialized retaining compounds ensures the long-term mechanical stability of critical powertrain components under high-vibration conditions. As the industry advances, the widespread implementation of durable underbody protection continues to provide critical defense against environmental degradation.
- These strategic material choices reflect a comprehensive shift toward optimizing manufacturing efficiency, enhancing structural integrity, and proactively aligning with evolving global automotive standards.
What are the Key Data Covered in this Automotive Sealants Market Research and Growth Report?
-
What is the expected growth of the Automotive Sealants Market between 2026 and 2030?
-
USD 2.36 billion, at a CAGR of 5.2%
-
-
What segmentation does the market report cover?
-
The report is segmented by Type (Polyurethane, Silicone, Acrylic, Butyl, and Others), Technology (Reactive, Waterborne, Hot melt, and Others), Application (Passenger car, LCV, and Commercial vehicles) and Geography (APAC, North America, Europe, South America, Middle East and Africa)
-
-
Which regions are analyzed in the report?
-
APAC, North America, Europe, South America and Middle East and Africa
-
-
What are the key growth drivers and market challenges?
-
Proliferation of electric and hybrid vehicles, Volatility of raw material prices
-
-
Who are the major players in the Automotive Sealants Market?
-
3M Co., Avery Dennison Corp., BASF SE, Bostik Ltd., Compagnie de Saint Gobain SA, Dow Chemical Co., H.B. Fuller Co., Henkel AG and Co. KGaA, Huntsman International LLC, Illinois Tool Works Inc., Jowat SE, KCC Co. Ltd., KURARAY Co. Ltd., Master Bond Inc., Momentive Materials Inc., Permabond LLC, PPG Industries Inc., Shin Etsu Chemical Co. Ltd., Sika AG and Wacker Chemie AG
-
Market Research Insights
- The Automotive Sealants Market is undergoing a rapid technological evolution, heavily influenced by the zero-emission vehicle transition and the continuous push for improved operational efficiency. By adopting an advanced fast-curing induction coil process for adhesive applications, assembly plants have successfully reduced energy consumption by 25% while simultaneously increasing production line velocity.
- Furthermore, the strategic integration of specialized compounds for electric vehicle thermal management has decreased battery-related thermal failure rates by 14%, directly improving overall vehicle safety and brand reliability. As manufacturers prioritize supply chain resiliency, the shift toward localized sourcing of high-performance sealing materials has mitigated logistical disruptions, ensuring uninterrupted manufacturing operations amidst fluctuating global trade dynamics.
We can help! Our analysts can customize this automotive sealants market research report to meet your requirements.
 RIA -
RIA - 
