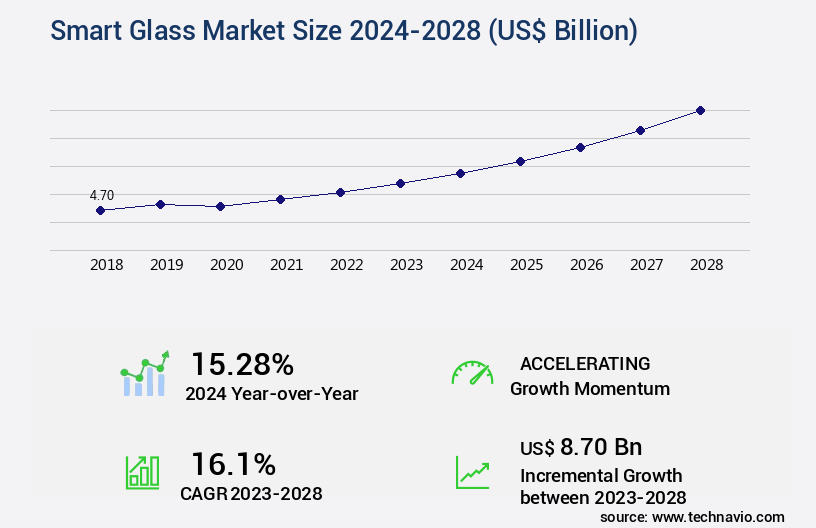
Smart Glass Market Size 2024-2028
The smart glass market size is valued to increase USD 8.70 billion, at a CAGR of 16.1% from 2023 to 2028. Advancements in smart glass technologies will drive the smart glass market.
Major Market Trends & Insights
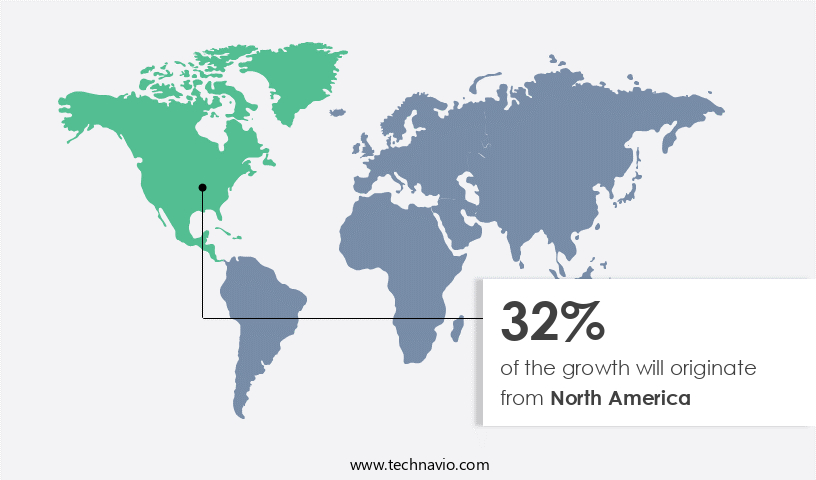
- North America dominated the market and accounted for a 32% growth during the forecast period.
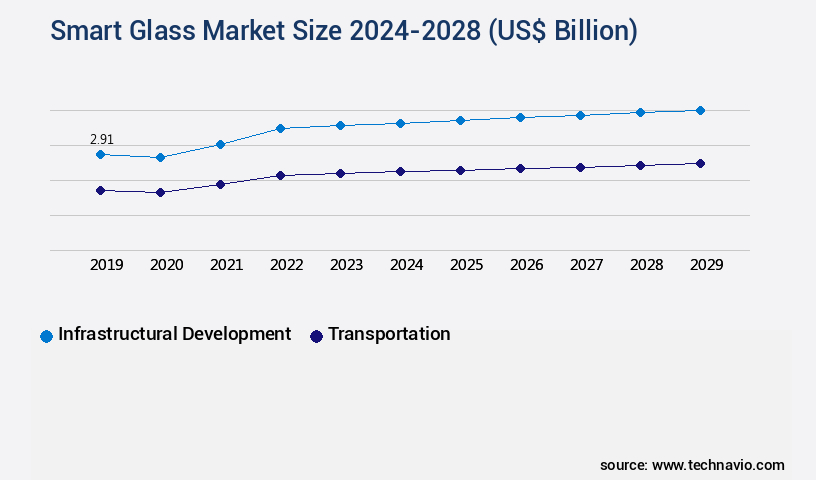
- By Application - Infrastructural development segment was valued at USD 2.54 billion in 2022
- By Technology - Electrochromic segment accounted for the largest market revenue share in 2022
Market Size & Forecast
- Market Opportunities: USD 251.91 billion
- Market Future Opportunities: USD 8.70 billion
- CAGR : 16.1%
- North America: Largest market in 2022
Market Summary
- The market represents a dynamic and innovative industry, characterized by advancements in core technologies and applications. Smart glass, which can change transparency at the touch of a button or in response to environmental conditions, is increasingly being integrated with Internet of Things (IoT) technologies to create energy-efficient, sustainable, and user-friendly solutions. However, the high cost of smart glass remains a significant challenge, limiting its widespread adoption. According to recent reports, the market is expected to account for over 15% of the total architectural glass market by 2025.
- Key drivers of market growth include increasing demand for energy efficiency, growing awareness of sustainable building practices, and advancements in manufacturing processes that reduce production costs. Despite these opportunities, regulatory challenges and the need for standardization pose significant hurdles for market expansion.
What will be the Size of the Smart Glass Market during the forecast period?

Get Key Insights on Market Forecast (PDF) Request Free Sample
How is the Smart Glass Market Segmented and what are the key trends of market segmentation?
The smart glass industry research report provides comprehensive data (region-wise segment analysis), with forecasts and estimates in "USD billion" for the period 2024-2028, as well as historical data from 2018-2022 for the following segments.
- Application
- Infrastructural development
- Transportation
- Others
- Technology
- Electrochromic
- Suspended particle devices
- Polymer dispersed liquid crystal
- Photochromic
- Thermochromics and microblind
- End-User
- Commercial Buildings
- Residential Buildings
- Automotive
- Aerospace
- Control System
- Manual
- Automatic (Sensors, Remote)
- Type
- Geography
- North America
- Europe
- Middle East and Africa
- APAC
- South America
- Rest of World (ROW)
By Application Insights
The infrastructural development segment is estimated to witness significant growth during the forecast period.
Smart glass, a technologically advanced glazing solution, offers businesses significant energy savings by controlling the transmission of light and heat. This innovation optimizes natural light usage, reducing the dependence on artificial lighting, and minimizing energy consumption. The market for smart glass is expanding, with an estimated 15% of the global glazing market share in 2021. Furthermore, industry experts anticipate a 17% increase in smart glass adoption within the next three years. Spectral transmittance data and shading coefficient values are crucial factors in the market. Energy-efficient glazing, such as electrochromic windows, offers thermal insulation and excellent optical properties. These windows can adjust their tint based on external light conditions, ensuring optimal energy efficiency.
Smart window coatings, including solar control films and insulating glass units, further contribute to energy savings by controlling heat reflection properties and visible light transmission. Smart glass applications extend beyond commercial buildings, reaching industries like transportation and residential sectors. Technologically advanced features, such as self-cleaning glass, liquid crystal display, and glare reduction systems, enhance the appeal and functionality of smart glass. Low-e glass technology, color switching time, and light diffusion patterns are essential considerations in smart glass design. Manufacturers focus on improving smart glass durability through rigorous testing methods and optimizing energy consumption metrics. Infrared radiation blocking and privacy glass technology are essential features that cater to diverse market needs.
Optical density measurement and transparency modulation are essential aspects of smart glass evaluation. In summary, the market is experiencing significant growth, driven by energy savings, advanced optical properties, and diverse applications. Companies like The Saint Gobain Group are at the forefront of this innovation, offering smart glass solutions to various industries.

Request Free Sample
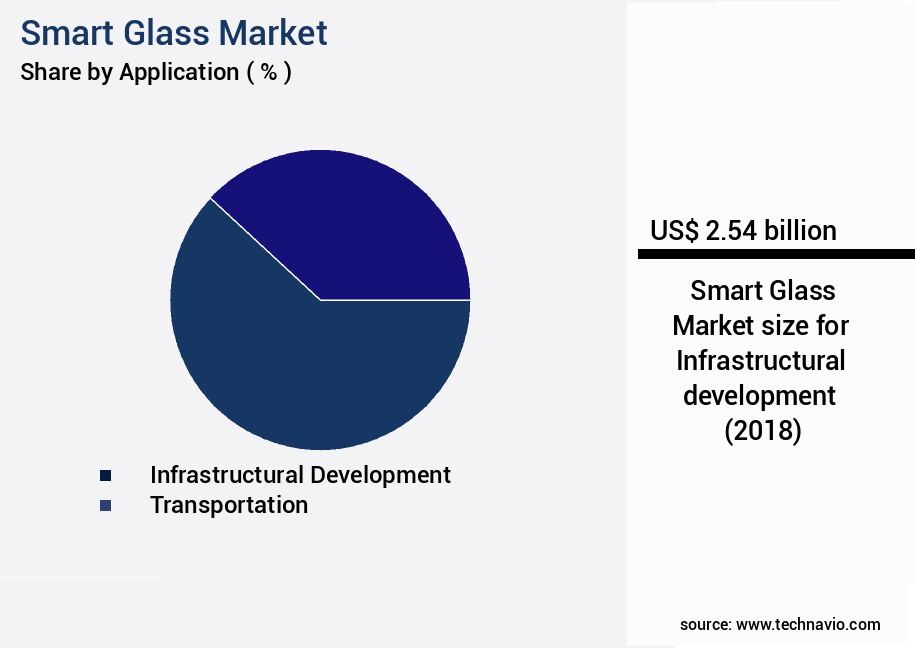
The Infrastructural development segment was valued at USD 2.54 billion in 2018 and showed a gradual increase during the forecast period.

Request Free Sample
Regional Analysis
North America is estimated to contribute 32% to the growth of the global market during the forecast period.Technavio's analysts have elaborately explained the regional trends and drivers that shape the market during the forecast period.

See How Smart Glass Market Demand is Rising in North America Request Free Sample
The market in North America is experiencing significant growth due to the region's strong emphasis on energy efficiency in buildings and transportation. Smart glass, with its capability to control light transmission and reduce heat gain, is increasingly sought after for achieving energy efficiency goals in both residential and commercial construction. The construction industry in North America is leaning towards the use of innovative and sustainable materials, making smart glass a favored choice for modern and sustainable building designs. According to recent studies, the market for smart glass in North America is expected to expand, with approximately 25% of new commercial buildings incorporating smart glass in their designs.
Additionally, over 10% of new residential constructions in the region are integrating this technology. Smart glass's contribution to sustainable building design aligns with LEED certification requirements, further fueling its adoption. With these statistics, it's evident that the market in North America is a dynamic and evolving sector.
Market Dynamics
Our researchers analyzed the data with 2023 as the base year, along with the key drivers, trends, and challenges. A holistic analysis of drivers will help companies refine their marketing strategies to gain a competitive advantage.
The market encompasses innovative technologies, including electrochromic window energy savings and liquid crystal smart glass technology, that offer significant energy efficiency and light control advantages. Electrochromic windows, in particular, have gained traction due to their ability to adjust tint levels in response to external light conditions, thereby reducing energy consumption for heating, ventilation, and air conditioning (HVAC) systems in buildings. In the realm of smart glass applications in architecture, liquid crystal devices and suspended particle devices exhibit distinct performance metrics. Liquid crystal smart glass technology, for instance, boasts rapid optical switching speed, enabling real-time response to changing light conditions.
Suspended particle devices, on the other hand, provide excellent heat reflection properties, making them suitable for thermochromic glass heat reflection analysis in hot climates. Moreover, smart glass solutions offer additional benefits such as self-cleaning glass coating technology, glare reduction systems for office buildings, and infrared radiation blocking smart glass. Ultraviolet light filtering window films and solar control films for energy efficiency further enhance the market's appeal. The market's growth is driven by the increasing demand for energy-efficient buildings and the integration of advanced technologies in architectural designs. For instance, insulating glass units and low-e glass technology significantly impact energy performance.
The optimization of electrochromic layer thickness and the application of optical density measurement techniques contribute to enhanced visible light transmission and spectral transmittance data analysis. Compared to traditional glass solutions, smart glass solutions offer substantial improvements in energy savings and light control. For example, more than 60% of new building projects incorporate smart glass technologies, representing a notable shift towards energy-efficient and technologically advanced architectural designs. This trend is expected to continue, with the market exhibiting robust growth in the coming years.

What are the key market drivers leading to the rise in the adoption of Smart Glass Industry?
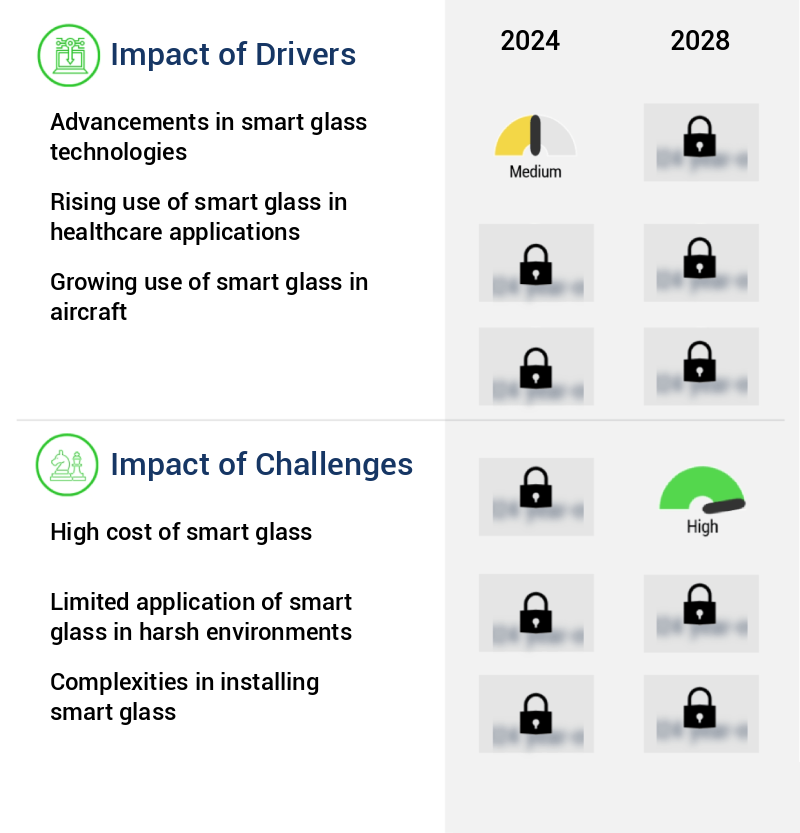
- The primary catalyst fueling market growth is the ongoing advancement of smart glass technologies.
- Electrochromic, thermochromic, and PDLC smart glass technologies continue to evolve, enhancing their performance and applications across various industries. In electrochromic glass, advancements in electrochromic materials lead to faster and more efficient color change, improving overall performance. PDLC technology, characterized by liquid crystal droplets dispersed in a polymer matrix, undergoes progress in achieving quicker color transitions, essential for applications demanding rapid transparency adjustments. Thermochromic glass, responsive to temperature changes, experiences advancements in precise temperature control, enabling better management of the glass's transparent and opaque states.
- These developments underscore the dynamic nature of the market and its ongoing innovation.
What are the market trends shaping the Smart Glass Industry?
- The integration of smart glass technology into IoT applications is an emerging market trend. Smart glass, with its ability to modify light transmission, is increasingly being adopted in IoT systems for energy efficiency and user convenience.
- The Internet of Things (IoT) is revolutionizing industries by connecting physical objects to the Internet, enabling enterprises to enhance product performance through IoT Security and Analytics. IoT's integration with smart glass is a prime example, offering improved manageability, control, and configuring capabilities. This trend is driving companies to introduce IoT-enabled smart glass products, catering to the increasing demand for such solutions. For instance, View Inc's SmartProtect system uses Azure Digital Twins and Microsoft Azure's IoT service for glass breakage detection and notification.
- IoT's transformative impact is evident in various sectors, with businesses seeking to leverage its capabilities for enhanced productivity and efficiency. IoT Security and Analytics play a crucial role in ensuring data security and deriving valuable insights from the vast amounts of data generated by connected devices. The integration of IoT with smart glass is just one of the many applications, underscoring its far-reaching implications for businesses.
What challenges does the Smart Glass Industry face during its growth?
- The high cost of smart glass represents a significant challenge that could hinder the growth of the industry.
- The manufacturing of smart glass, a technologically advanced material, involves significant energy consumption and high temperatures. Approximately 40% of the energy used in glass production is attributed to natural gas combustion, primarily for heating furnaces to melt raw materials into glass. This substantial energy dependency poses continuous challenges for smart glass manufacturers, as they strive to minimize energy usage and associated costs.
- Concurrently, some smart glasses incorporate advanced features such as Wi-Fi and environmental sensors, enhancing their functionality and value. These integrated technologies further contribute to the production complexity and cost structure. As the market evolves, manufacturers must navigate these challenges and optimize their processes to remain competitive.
Exclusive Customer Landscape
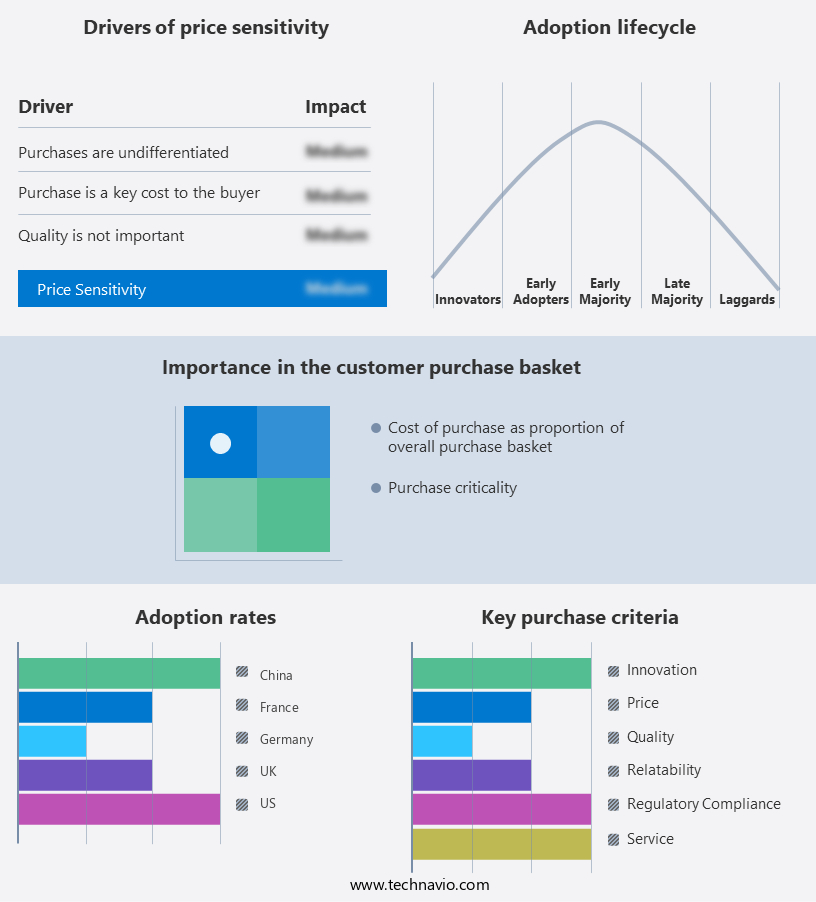
The smart glass market forecasting report includes the adoption lifecycle of the market, covering from the innovator's stage to the laggard's stage. It focuses on adoption rates in different regions based on penetration. Furthermore, the smart glass market report also includes key purchase criteria and drivers of price sensitivity to help companies evaluate and develop their market growth analysis strategies.

Customer Landscape of Smart Glass Industry
Competitive Landscape & Market Insights
Companies are implementing various strategies, such as strategic alliances, smart glass market forecast, partnerships, mergers and acquisitions, geographical expansion, and product/service launches, to enhance their presence in the industry.
The industry research and growth report includes detailed analyses of the competitive landscape of the market and information about key companies, including:
- AGC Inc.
- AGP America SA
- America Insulated Glass, LLC
- Bowers Group
- Central Glass Co., Ltd.
- Chorum Technologies, Inc.
- ChromeGenics AB
- Corning Incorporated
- Fuyao Glass
- Gauzy Ltd.
- Gentex Corporation
- Hitachi Chemical Co., Ltd.
- Innovative Glass Corp.
- Nippon Sheet Glass Co., Ltd.
- Pleotint LLC
- Polytronix, Inc.
- RavenWindow, LLC
- Research Frontiers Incorporated
- Saint-Gobain S.A.
- View, Inc.
Qualitative and quantitative analysis of companies has been conducted to help clients understand the wider business environment as well as the strengths and weaknesses of key industry players. Data is qualitatively analyzed to categorize companies as pure play, category-focused, industry-focused, and diversified; it is quantitatively analyzed to categorize companies as dominant, leading, strong, tentative, and weak.
Recent Development and News in Smart Glass Market
- In January 2024, Asahi Glass Co. (AGC), a leading player in the market, announced the launch of its new product, "AGC Moristar i-Flex," a flexible smart glass solution for automotive applications (AGC Press Release, 2024). This innovation marks a significant step towards the mass adoption of smart glass technology in the automotive sector.
- In March 2024, Corning Incorporated and View, Inc., two major players in the smart glass industry, entered into a strategic partnership to develop and commercialize advanced, energy-efficient smart glass solutions (Corning Press Release, 2024). This collaboration combines Corning's expertise in glass science and View's expertise in smart glass technology, aiming to accelerate the market penetration of these solutions.
- In May 2024, Hanwha Chemical Corporation, a South Korean chemical company, completed the acquisition of 51% stake in Nanoco Group Plc, a UK-based company specializing in cadmium-free quantum dots for smart glass applications (Hanwha Chemical Press Release, 2024). This strategic move strengthens Hanwha's position in the market and provides it with access to Nanoco's proprietary quantum dot technology.
- In January 2025, the European Union (EU) approved the Horizon Europe research and innovation program, which includes a €1 billion investment in smart glass research and development over the next seven years (European Commission Press Release, 2025). This significant funding will drive technological advancements and innovation in the market, with a focus on energy efficiency, affordability, and scalability.
Dive into Technavio's robust research methodology, blending expert interviews, extensive data synthesis, and validated models for unparalleled Smart Glass Market insights. See full methodology.
Market Scope
|
Report Coverage
|
Details
|
Page number
|
102
|
Base year
|
2023
|
Historic period
|
2018-2022 |
Forecast period
|
2024-2028
|
Growth momentum & CAGR
|
Accelerate at a CAGR of 16.1%
|
Market growth 2024-2028
|
USD 8.70 billion
|
Market structure
|
Fragmented
|
YoY growth 2023-2024(%)
|
15.28
|
Key countries
|
US, Canada, Germany, UK, Italy, France, China, India, Japan, Brazil, Egypt, UAE, Oman, Argentina, KSA, UAE, Brazil, and Rest of World (ROW)
|
Competitive landscape
|
Leading Companies, Market Positioning of Companies, Competitive Strategies, and Industry Risks
|
Request Free Sample
Research Analyst Overview
- The market continues to evolve, driven by advancements in technology and increasing demand for energy efficiency and sustainable building solutions. This dynamic industry encompasses various types of smart glass, including those with shading coefficient values that optimize energy usage and spectral transmittance data for optimal daylight utilization. Electrochromic windows, a significant segment, offer thermal insulation values and heat reflection properties that contribute to energy savings. Optical properties analysis of these windows reveals their ability to control visible light transmission, making them ideal for applications requiring glare reduction and privacy. Smart window coatings, such as self-cleaning glass and solar control films, have gained popularity due to their unique features.
- These coatings not only enhance the aesthetic appeal but also offer practical benefits, like reducing energy consumption and improving comfort. Insulating glass units and laminated safety glass are essential components of the market, ensuring durability and safety while providing thermal insulation and noise reduction. Innovations in electrochromic device design include liquid crystal display and glare reduction systems, offering color switching time and light diffusion patterns that cater to diverse user needs. Low-e glass technology, with its energy efficiency and infrared radiation blocking properties, is another key player in the market. Thermochromic glass, with its ability to change color based on temperature, adds to the market's versatility.
- Manufacturers focus on electrode layer deposition, electrochromic layer thickness, and energy consumption metrics to enhance product performance and competitiveness. The ongoing research and development in this field promise further advancements, underscoring the market's continuous growth and evolution.
What are the Key Data Covered in this Smart Glass Market Research and Growth Report?
-
What is the expected growth of the Smart Glass Market between 2024 and 2028?
-
What segmentation does the market report cover?
-
The report is segmented by Application (Infrastructural development, Transportation, and Others), Technology (Electrochromic, Suspended particle devices, Polymer dispersed liquid crystal, Photochromic, and Thermochromics and microblind), Geography (North America, Europe, APAC, South America, and Middle East and Africa), End-User (Commercial Buildings, Residential Buildings, Automotive, and Aerospace), Control System (Manual and Automatic (Sensors, Remote)), and Type (Active and Passive)
-
Which regions are analyzed in the report?
-
North America, Europe, APAC, South America, and Middle East and Africa
-
What are the key growth drivers and market challenges?
-
Who are the major players in the Smart Glass Market?
-
AGC Inc., AGP America SA, America Insulated Glass, LLC, Bowers Group, Central Glass Co., Ltd., Chorum Technologies, Inc., ChromeGenics AB, Corning Incorporated, Fuyao Glass, Gauzy Ltd., Gentex Corporation, Hitachi Chemical Co., Ltd., Innovative Glass Corp., Nippon Sheet Glass Co., Ltd., Pleotint LLC, Polytronix, Inc., RavenWindow, LLC, Research Frontiers Incorporated, Saint-Gobain S.A., and View, Inc.
Market Research Insights
- The market encompasses advanced glass surface treatments, including electrochromic films, which offer dynamic light control through optical switching mechanisms. These films provide privacy applications and thermal comfort improvement, while also contributing to building energy efficiency and solar energy management. The electrochromic film lifespan, on average, exceeds ten years, ensuring long-term investment value. In contrast, traditional glass manufacturing processes often require frequent maintenance due to light scattering effects and safety glass standards. Smart glass integration in building facades not only enhances user interface design but also enables automated control systems, light dimming capabilities, and tint adjustment controls. These features contribute significantly to building energy savings, with some estimates suggesting up to 20% energy savings compared to conventional buildings.
- A lifecycle cost analysis reveals that the initial investment in smart glass is offset by long-term energy savings and reduced maintenance requirements. Additionally, smart glass panels offer impact resistance testing, ensuring safety and security, and can be integrated with suspended particle films for improved acoustic performance ratings. Material science advancements continue to expand the capabilities of smart glass, further positioning it as a key component in the evolution of sustainable, energy-efficient buildings.
We can help! Our analysts can customize this smart glass market research report to meet your requirements.
Get in touch
1 Executive Summary
- 1.1 Market overview
- Exhibit 01: Executive Summary – Chart on Market Overview
- Exhibit 02: Executive Summary – Data Table on Market Overview
- Exhibit 03: Executive Summary – Chart on Global Market Characteristics
- Exhibit 04: Executive Summary – Chart on Market by Geography
- Exhibit 05: Executive Summary – Chart on Market Segmentation by Application
- Exhibit 06: Executive Summary – Chart on Market Segmentation by Technology
- Exhibit 07: Executive Summary – Chart on Incremental Growth
- Exhibit 08: Executive Summary – Data Table on Incremental Growth
- Exhibit 09: Executive Summary – Chart on Vendor Market Positioning
2 Market Landscape
- 2.1 Market ecosystem
- Exhibit 10: Parent market
- Exhibit 11: Market Characteristics
3 Market Sizing
- 3.1 Market definition
- Exhibit 12: Offerings of vendors included in the market definition
- 3.2 Market segment analysis
- Exhibit 13: Market segments
- 3.4 Market outlook: Forecast for 2023-2028
- Exhibit 14: Chart on Global - Market size and forecast 2023-2028 ($ million)
- Exhibit 15: Data Table on Global - Market size and forecast 2023-2028 ($ million)
- Exhibit 16: Chart on Global Market: Year-over-year growth 2023-2028 (%)
- Exhibit 17: Data Table on Global Market: Year-over-year growth 2023-2028 (%)
4 Historic Market Size
- 4.1 Global smart glass market 2018 - 2022
- Exhibit 18: Historic Market Size – Data Table on global smart glass market 2018 - 2022 ($ million)
- 4.2 Application Segment Analysis 2018 - 2022
- Exhibit 19: Historic Market Size – Application Segment 2018 - 2022 ($ million)
- 4.3 Technology Segment Analysis 2018 - 2022
- Exhibit 20: Historic Market Size – Technology Segment 2018 - 2022 ($ million)
- 4.4 Geography Segment Analysis 2018 - 2022
- Exhibit 21: Historic Market Size – Geography Segment 2018 - 2022 ($ million)
- 4.5 Country Segment Analysis 2018 - 2022
- Exhibit 22: Historic Market Size – Country Segment 2018 - 2022 ($ million)
5 Five Forces Analysis
- 5.1 Five forces summary
- Exhibit 23: Five forces analysis - Comparison between 2023 and 2028
- 5.2 Bargaining power of buyers
- Exhibit 24: Chart on Bargaining power of buyers – Impact of key factors 2023 and 2028
- 5.3 Bargaining power of suppliers
- Exhibit 25: Bargaining power of suppliers – Impact of key factors in 2023 and 2028
- 5.4 Threat of new entrants
- Exhibit 26: Threat of new entrants – Impact of key factors in 2023 and 2028
- 5.5 Threat of substitutes
- Exhibit 27: Threat of substitutes – Impact of key factors in 2023 and 2028
- 5.6 Threat of rivalry
- Exhibit 28: Threat of rivalry – Impact of key factors in 2023 and 2028
- 5.7 Market condition
- Exhibit 29: Chart on Market condition - Five forces 2023 and 2028
6 Market Segmentation by Application
- 6.1 Market segments
- Chart on Application - Market share (2023-2028) (%)
- Data Table on Application - Market share (2023-2028) (%)
- 6.2 Comparison by Application
- Chart on Comparison by Application
- Data Table on Comparison by Application
- 6.3 Infrastructural development - Market size and forecast (2023-2028)
- Chart on Infrastructural development - Market size and forecast (2023-2028) ($ million)
- Data Table on Infrastructural development - Market size and forecast (2023-2028) ($ million)
- Chart on Infrastructural development - Year-over-year growth (2023-2028) (%)
- Data Table on Infrastructural development - Year-over-year growth (2023-2028) (%)
- 6.4 Transportation - Market size and forecast (2023-2028)
- Chart on Transportation - Market size and forecast (2023-2028) ($ million)
- Data Table on Transportation - Market size and forecast (2023-2028) ($ million)
- Chart on Transportation - Year-over-year growth (2023-2028) (%)
- Data Table on Transportation - Year-over-year growth (2023-2028) (%)
- 6.5 Others - Market size and forecast (2023-2028)
- Chart on Others - Market size and forecast (2023-2028) ($ million)
- Data Table on Others - Market size and forecast (2023-2028) ($ million)
- Chart on Others - Year-over-year growth (2023-2028) (%)
- Data Table on Others - Year-over-year growth (2023-2028) (%)
- 6.6 Market opportunity by Application
- Market opportunity by Application ($ million)
- Data Table on Market opportunity by Application ($ million)
7 Market Segmentation by Technology
- 7.1 Market segments
- Chart on Technology - Market share (2023-2028) (%)
- Data Table on Technology - Market share (2023-2028) (%)
- 7.2 Comparison by Technology
- Chart on Comparison by Technology
- Data Table on Comparison by Technology
- 7.3 Electrochromic - Market size and forecast (2023-2028)
- Chart on Electrochromic - Market size and forecast (2023-2028) ($ million)
- Data Table on Electrochromic - Market size and forecast (2023-2028) ($ million)
- Chart on Electrochromic - Year-over-year growth (2023-2028) (%)
- Data Table on Electrochromic - Year-over-year growth (2023-2028) (%)
- 7.4 Suspended particle devices - Market size and forecast (2023-2028)
- Chart on Suspended particle devices - Market size and forecast (2023-2028) ($ million)
- Data Table on Suspended particle devices - Market size and forecast (2023-2028) ($ million)
- Chart on Suspended particle devices - Year-over-year growth (2023-2028) (%)
- Data Table on Suspended particle devices - Year-over-year growth (2023-2028) (%)
- 7.5 Polymer dispersed liquid crystal - Market size and forecast (2023-2028)
- Chart on Polymer dispersed liquid crystal - Market size and forecast (2023-2028) ($ million)
- Data Table on Polymer dispersed liquid crystal - Market size and forecast (2023-2028) ($ million)
- Chart on Polymer dispersed liquid crystal - Year-over-year growth (2023-2028) (%)
- Data Table on Polymer dispersed liquid crystal - Year-over-year growth (2023-2028) (%)
- 7.6 Photochromic - Market size and forecast (2023-2028)
- Chart on Photochromic - Market size and forecast (2023-2028) ($ million)
- Data Table on Photochromic - Market size and forecast (2023-2028) ($ million)
- Chart on Photochromic - Year-over-year growth (2023-2028) (%)
- Data Table on Photochromic - Year-over-year growth (2023-2028) (%)
- 7.7 Thermochromics and microblind - Market size and forecast (2023-2028)
- Chart on Thermochromics and microblind - Market size and forecast (2023-2028) ($ million)
- Data Table on Thermochromics and microblind - Market size and forecast (2023-2028) ($ million)
- Chart on Thermochromics and microblind - Year-over-year growth (2023-2028) (%)
- Data Table on Thermochromics and microblind - Year-over-year growth (2023-2028) (%)
- 7.8 Market opportunity by Technology
- Market opportunity by Technology ($ million)
- Data Table on Market opportunity by Technology ($ million)
8 Market Segmentation by End-User
- 8.1 Market segments
- Chart on End-User - Market share (2023-2028) (%)
- Data Table on End-User - Market share (2023-2028) (%)
- 8.2 Comparison by End-User
- Chart on Comparison by End-User
- Data Table on Comparison by End-User
- 8.3 Commercial Buildings - Market size and forecast (2023-2028)
- Chart on Commercial Buildings - Market size and forecast (2023-2028) ($ million)
- Data Table on Commercial Buildings - Market size and forecast (2023-2028) ($ million)
- Chart on Commercial Buildings - Year-over-year growth (2023-2028) (%)
- Data Table on Commercial Buildings - Year-over-year growth (2023-2028) (%)
- 8.4 Residential Buildings - Market size and forecast (2023-2028)
- Chart on Residential Buildings - Market size and forecast (2023-2028) ($ million)
- Data Table on Residential Buildings - Market size and forecast (2023-2028) ($ million)
- Chart on Residential Buildings - Year-over-year growth (2023-2028) (%)
- Data Table on Residential Buildings - Year-over-year growth (2023-2028) (%)
- 8.5 Automotive - Market size and forecast (2023-2028)
- Chart on Automotive - Market size and forecast (2023-2028) ($ million)
- Data Table on Automotive - Market size and forecast (2023-2028) ($ million)
- Chart on Automotive - Year-over-year growth (2023-2028) (%)
- Data Table on Automotive - Year-over-year growth (2023-2028) (%)
- 8.6 Aerospace - Market size and forecast (2023-2028)
- Chart on Aerospace - Market size and forecast (2023-2028) ($ million)
- Data Table on Aerospace - Market size and forecast (2023-2028) ($ million)
- Chart on Aerospace - Year-over-year growth (2023-2028) (%)
- Data Table on Aerospace - Year-over-year growth (2023-2028) (%)
- 8.7 Market opportunity by End-User
- Market opportunity by End-User ($ million)
- Data Table on Market opportunity by End-User ($ million)
9 Market Segmentation by Control System
- 9.1 Market segments
- Chart on Control System - Market share (2023-2028) (%)
- Data Table on Control System - Market share (2023-2028) (%)
- 9.2 Comparison by Control System
- Chart on Comparison by Control System
- Data Table on Comparison by Control System
- 9.3 Manual - Market size and forecast (2023-2028)
- Chart on Manual - Market size and forecast (2023-2028) ($ million)
- Data Table on Manual - Market size and forecast (2023-2028) ($ million)
- Chart on Manual - Year-over-year growth (2023-2028) (%)
- Data Table on Manual - Year-over-year growth (2023-2028) (%)
- 9.4 Automatic (Sensors, Remote) - Market size and forecast (2023-2028)
- Chart on Automatic (Sensors, Remote) - Market size and forecast (2023-2028) ($ million)
- Data Table on Automatic (Sensors, Remote) - Market size and forecast (2023-2028) ($ million)
- Chart on Automatic (Sensors, Remote) - Year-over-year growth (2023-2028) (%)
- Data Table on Automatic (Sensors, Remote) - Year-over-year growth (2023-2028) (%)
- 9.5 Market opportunity by Control System
- Market opportunity by Control System ($ million)
- Data Table on Market opportunity by Control System ($ million)
10 Market Segmentation by Type
- 10.1 Market segments
- Chart on Type - Market share (2023-2028) (%)
- Data Table on Type - Market share (2023-2028) (%)
- 10.2 Comparison by Type
- Chart on Comparison by Type
- Data Table on Comparison by Type
- 10.3 Active - Market size and forecast (2023-2028)
- Chart on Active - Market size and forecast (2023-2028) ($ million)
- Data Table on Active - Market size and forecast (2023-2028) ($ million)
- Chart on Active - Year-over-year growth (2023-2028) (%)
- Data Table on Active - Year-over-year growth (2023-2028) (%)
- 10.4 Passive - Market size and forecast (2023-2028)
- Chart on Passive - Market size and forecast (2023-2028) ($ million)
- Data Table on Passive - Market size and forecast (2023-2028) ($ million)
- Chart on Passive - Year-over-year growth (2023-2028) (%)
- Data Table on Passive - Year-over-year growth (2023-2028) (%)
- 10.5 Market opportunity by Type
- Market opportunity by Type ($ million)
- Data Table on Market opportunity by Type ($ million)
8 Customer Landscape
- 8.1 Customer landscape overview
- Exhibit 74: Analysis of price sensitivity, lifecycle, customer purchase basket, adoption rates, and purchase criteria
9 Geographic Landscape
- 9.1 Geographic segmentation
- Exhibit 75: Chart on Market share by geography 2023-2028 (%)
- Exhibit 76: Data Table on Market share by geography 2023-2028 (%)
- 9.2 Geographic comparison
- Exhibit 77: Chart on Geographic comparison
- Exhibit 78: Data Table on Geographic comparison
- 9.3 North America - Market size and forecast 2023-2028
- Exhibit 79: Chart on North America - Market size and forecast 2023-2028 ($ million)
- Exhibit 80: Data Table on North America - Market size and forecast 2023-2028 ($ million)
- Exhibit 81: Chart on North America - Year-over-year growth 2023-2028 (%)
- Exhibit 82: Data Table on North America - Year-over-year growth 2023-2028 (%)
- 9.4 Europe - Market size and forecast 2023-2028
- Exhibit 83: Chart on Europe - Market size and forecast 2023-2028 ($ million)
- Exhibit 84: Data Table on Europe - Market size and forecast 2023-2028 ($ million)
- Exhibit 85: Chart on Europe - Year-over-year growth 2023-2028 (%)
- Exhibit 86: Data Table on Europe - Year-over-year growth 2023-2028 (%)
- 9.5 APAC - Market size and forecast 2023-2028
- Exhibit 87: Chart on APAC - Market size and forecast 2023-2028 ($ million)
- Exhibit 88: Data Table on APAC - Market size and forecast 2023-2028 ($ million)
- Exhibit 89: Chart on APAC - Year-over-year growth 2023-2028 (%)
- Exhibit 90: Data Table on APAC - Year-over-year growth 2023-2028 (%)
- 9.6 South America - Market size and forecast 2023-2028
- Exhibit 91: Chart on South America - Market size and forecast 2023-2028 ($ million)
- Exhibit 92: Data Table on South America - Market size and forecast 2023-2028 ($ million)
- Exhibit 93: Chart on South America - Year-over-year growth 2023-2028 (%)
- Exhibit 94: Data Table on South America - Year-over-year growth 2023-2028 (%)
- 9.7 Middle East and Africa - Market size and forecast 2023-2028
- Exhibit 95: Chart on Middle East and Africa - Market size and forecast 2023-2028 ($ million)
- Exhibit 96: Data Table on Middle East and Africa - Market size and forecast 2023-2028 ($ million)
- Exhibit 97: Chart on Middle East and Africa - Year-over-year growth 2023-2028 (%)
- Exhibit 98: Data Table on Middle East and Africa - Year-over-year growth 2023-2028 (%)
- 9.8 US - Market size and forecast 2023-2028
- Exhibit 99: Chart on US - Market size and forecast 2023-2028 ($ million)
- Exhibit 100: Data Table on US - Market size and forecast 2023-2028 ($ million)
- Exhibit 101: Chart on US - Year-over-year growth 2023-2028 (%)
- Exhibit 102: Data Table on US - Year-over-year growth 2023-2028 (%)
- 9.9 China - Market size and forecast 2023-2028
- Exhibit 103: Chart on China - Market size and forecast 2023-2028 ($ million)
- Exhibit 104: Data Table on China - Market size and forecast 2023-2028 ($ million)
- Exhibit 105: Chart on China - Year-over-year growth 2023-2028 (%)
- Exhibit 106: Data Table on China - Year-over-year growth 2023-2028 (%)
- 9.10 Germany - Market size and forecast 2023-2028
- Exhibit 107: Chart on Germany - Market size and forecast 2023-2028 ($ million)
- Exhibit 108: Data Table on Germany - Market size and forecast 2023-2028 ($ million)
- Exhibit 109: Chart on Germany - Year-over-year growth 2023-2028 (%)
- Exhibit 110: Data Table on Germany - Year-over-year growth 2023-2028 (%)
- 9.11 France - Market size and forecast 2023-2028
- Exhibit 111: Chart on France - Market size and forecast 2023-2028 ($ million)
- Exhibit 112: Data Table on France - Market size and forecast 2023-2028 ($ million)
- Exhibit 113: Chart on France - Year-over-year growth 2023-2028 (%)
- Exhibit 114: Data Table on France - Year-over-year growth 2023-2028 (%)
- 9.12 Japan - Market size and forecast 2023-2028
- Exhibit 115: Chart on Japan - Market size and forecast 2023-2028 ($ million)
- Exhibit 116: Data Table on Japan - Market size and forecast 2023-2028 ($ million)
- Exhibit 117: Chart on Japan - Year-over-year growth 2023-2028 (%)
- Exhibit 118: Data Table on Japan - Year-over-year growth 2023-2028 (%)
- 9.13 Market opportunity by geography
- Exhibit 119: Market opportunity by geography ($ million)
- Exhibit 120: Data Tables on Market opportunity by geography ($ million)
- 12.14 Canada - Market size and forecast (2023-2028)
- Chart on Canada - Market size and forecast (2023-2028) ($ million)
- Data Table on Canada - Market size and forecast (2023-2028) ($ million)
- Chart on Canada - Year-over-year growth (2023-2028) (%)
- Data Table on Canada - Year-over-year growth (2023-2028) (%)
- 12.15 UK - Market size and forecast (2023-2028)
- Chart on UK - Market size and forecast (2023-2028) ($ million)
- Data Table on UK - Market size and forecast (2023-2028) ($ million)
- Chart on UK - Year-over-year growth (2023-2028) (%)
- Data Table on UK - Year-over-year growth (2023-2028) (%)
- 12.16 Italy - Market size and forecast (2023-2028)
- Chart on Italy - Market size and forecast (2023-2028) ($ million)
- Data Table on Italy - Market size and forecast (2023-2028) ($ million)
- Chart on Italy - Year-over-year growth (2023-2028) (%)
- Data Table on Italy - Year-over-year growth (2023-2028) (%)
- 12.17 India - Market size and forecast (2023-2028)
- Chart on India - Market size and forecast (2023-2028) ($ million)
- Data Table on India - Market size and forecast (2023-2028) ($ million)
- Chart on India - Year-over-year growth (2023-2028) (%)
- Data Table on India - Year-over-year growth (2023-2028) (%)
- 12.18 Brazil - Market size and forecast (2023-2028)
- Chart on Brazil - Market size and forecast (2023-2028) ($ million)
- Data Table on Brazil - Market size and forecast (2023-2028) ($ million)
- Chart on Brazil - Year-over-year growth (2023-2028) (%)
- Data Table on Brazil - Year-over-year growth (2023-2028) (%)
- 12.19 Egypt - Market size and forecast (2023-2028)
- Chart on Egypt - Market size and forecast (2023-2028) ($ million)
- Data Table on Egypt - Market size and forecast (2023-2028) ($ million)
- Chart on Egypt - Year-over-year growth (2023-2028) (%)
- Data Table on Egypt - Year-over-year growth (2023-2028) (%)
- 12.20 UAE - Market size and forecast (2023-2028)
- Chart on UAE - Market size and forecast (2023-2028) ($ million)
- Data Table on UAE - Market size and forecast (2023-2028) ($ million)
- Chart on UAE - Year-over-year growth (2023-2028) (%)
- Data Table on UAE - Year-over-year growth (2023-2028) (%)
- 12.21 Oman - Market size and forecast (2023-2028)
- Chart on Oman - Market size and forecast (2023-2028) ($ million)
- Data Table on Oman - Market size and forecast (2023-2028) ($ million)
- Chart on Oman - Year-over-year growth (2023-2028) (%)
- Data Table on Oman - Year-over-year growth (2023-2028) (%)
- 12.22 Argentina - Market size and forecast (2023-2028)
- Chart on Argentina - Market size and forecast (2023-2028) ($ million)
- Data Table on Argentina - Market size and forecast (2023-2028) ($ million)
- Chart on Argentina - Year-over-year growth (2023-2028) (%)
- Data Table on Argentina - Year-over-year growth (2023-2028) (%)
- 12.23 KSA - Market size and forecast (2023-2028)
- Chart on KSA - Market size and forecast (2023-2028) ($ million)
- Data Table on KSA - Market size and forecast (2023-2028) ($ million)
- Chart on KSA - Year-over-year growth (2023-2028) (%)
- Data Table on KSA - Year-over-year growth (2023-2028) (%)
- 12.24 Rest of World (ROW) - Market size and forecast (2023-2028)
- Chart on Rest of World (ROW) - Market size and forecast (2023-2028) ($ million)
- Data Table on Rest of World (ROW) - Market size and forecast (2023-2028) ($ million)
- Chart on Rest of World (ROW) - Year-over-year growth (2023-2028) (%)
- Data Table on Rest of World (ROW) - Year-over-year growth (2023-2028) (%)
10 Drivers, Challenges, and Trends
- 10.3 Impact of drivers and challenges
- Exhibit 121: Impact of drivers and challenges in 2023 and 2028
11 Vendor Landscape
- 11.2 Vendor landscape
- Exhibit 122: Overview on Criticality of inputs and Factors of differentiation
- 11.3 Landscape disruption
- Exhibit 123: Overview on factors of disruption
- 11.4 Industry risks
- Exhibit 124: Impact of key risks on business
15 Competitive Analysis
- 15.2 Market positioning of companies
- Matrix on companies position and classification
- 15.3 AGC Inc.
- AGC Inc. - Overview
- AGC Inc. - Product / Service
- AGC Inc. - Key offerings
- 15.4 AGP America SA
- AGP America SA - Overview
- AGP America SA - Product / Service
- AGP America SA - Key offerings
- 15.5 America Insulated Glass, LLC
- America Insulated Glass, LLC - Overview
- America Insulated Glass, LLC - Product / Service
- America Insulated Glass, LLC - Key offerings
- 15.6 Bowers Group
- Bowers Group - Overview
- Bowers Group - Product / Service
- Bowers Group - Key offerings
- 15.7 Central Glass Co., Ltd.
- Central Glass Co., Ltd. - Overview
- Central Glass Co., Ltd. - Product / Service
- Central Glass Co., Ltd. - Key offerings
- 15.8 Chorum Technologies, Inc.
- Chorum Technologies, Inc. - Overview
- Chorum Technologies, Inc. - Product / Service
- Chorum Technologies, Inc. - Key offerings
- 15.9 ChromeGenics AB
- ChromeGenics AB - Overview
- ChromeGenics AB - Product / Service
- ChromeGenics AB - Key offerings
- 15.10 Corning Incorporated
- Corning Incorporated - Overview
- Corning Incorporated - Product / Service
- Corning Incorporated - Key offerings
- 15.11 Fuyao Glass
- Fuyao Glass - Overview
- Fuyao Glass - Product / Service
- Fuyao Glass - Key offerings
- 15.12 Gauzy Ltd.
- Gauzy Ltd. - Overview
- Gauzy Ltd. - Product / Service
- Gauzy Ltd. - Key offerings
- 15.13 Gentex Corporation
- Gentex Corporation - Overview
- Gentex Corporation - Product / Service
- Gentex Corporation - Key offerings
- 15.14 Hitachi Chemical Co., Ltd.
- Hitachi Chemical Co., Ltd. - Overview
- Hitachi Chemical Co., Ltd. - Product / Service
- Hitachi Chemical Co., Ltd. - Key offerings
- 15.15 Innovative Glass Corp.
- Innovative Glass Corp. - Overview
- Innovative Glass Corp. - Product / Service
- Innovative Glass Corp. - Key offerings
- 15.16 Nippon Sheet Glass Co., Ltd.
- Nippon Sheet Glass Co., Ltd. - Overview
- Nippon Sheet Glass Co., Ltd. - Product / Service
- Nippon Sheet Glass Co., Ltd. - Key offerings
- 15.17 Pleotint LLC
- Pleotint LLC - Overview
- Pleotint LLC - Product / Service
- Pleotint LLC - Key offerings
- 15.18 Polytronix, Inc.
- Polytronix, Inc. - Overview
- Polytronix, Inc. - Product / Service
- Polytronix, Inc. - Key offerings
- 15.19 RavenWindow, LLC
- RavenWindow, LLC - Overview
- RavenWindow, LLC - Product / Service
- RavenWindow, LLC - Key offerings
- 15.20 Research Frontiers Incorporated
- Research Frontiers Incorporated - Overview
- Research Frontiers Incorporated - Product / Service
- Research Frontiers Incorporated - Key offerings
- 15.21 Saint-Gobain S.A.
- Saint-Gobain S.A. - Overview
- Saint-Gobain S.A. - Product / Service
- Saint-Gobain S.A. - Key offerings
- 15.22 View, Inc.
- View, Inc. - Overview
- View, Inc. - Product / Service
- View, Inc. - Key offerings
- 15.23 AGC Inc.
- AGC Inc. - Overview
- AGC Inc. - Product / Service
- AGC Inc. - Key offerings
- 15.24 ChromoGenics AB
- ChromoGenics AB - Overview
- ChromoGenics AB - Product / Service
- ChromoGenics AB - Key offerings
- 15.25 Corning Incorporated
- Corning Incorporated - Overview
- Corning Incorporated - Product / Service
- Corning Incorporated - Key offerings
- 15.26 Diamond Glass
- Diamond Glass - Overview
- Diamond Glass - Product / Service
- Diamond Glass - Key offerings
- 15.27 Eastman Chemical Company
- Eastman Chemical Company - Overview
- Eastman Chemical Company - Product / Service
- Eastman Chemical Company - Key offerings
- 15.28 Gentex Corporation
- Gentex Corporation - Overview
- Gentex Corporation - Product / Service
- Gentex Corporation - Key offerings
- 15.29 Guardian Industries
- Guardian Industries - Overview
- Guardian Industries - Product / Service
- Guardian Industries - Key offerings
- 15.30 Halio Inc.
- Halio Inc. - Overview
- Halio Inc. - Product / Service
- Halio Inc. - Key offerings
- 15.31 Heliotrope Technologies
- Heliotrope Technologies - Overview
- Heliotrope Technologies - Product / Service
- Heliotrope Technologies - Key offerings
- 15.32 Hitachi Chemical Co. Ltd.
- Hitachi Chemical Co. Ltd. - Overview
- Hitachi Chemical Co. Ltd. - Product / Service
- Hitachi Chemical Co. Ltd. - Key offerings
- 15.33 Innovative Glass Corporation
- Innovative Glass Corporation - Overview
- Innovative Glass Corporation - Product / Service
- Innovative Glass Corporation - Key offerings
- 15.34 Kinestral Technologies Inc.
- Kinestral Technologies Inc. - Overview
- Kinestral Technologies Inc. - Product / Service
- Kinestral Technologies Inc. - Key offerings
- 15.35 Merck KGaA
- Merck KGaA - Overview
- Merck KGaA - Product / Service
- Merck KGaA - Key offerings
- 15.36 Pleotint LLC
- Pleotint LLC - Overview
- Pleotint LLC - Product / Service
- Pleotint LLC - Key offerings
- 15.37 Polytronix Inc.
- Polytronix Inc. - Overview
- Polytronix Inc. - Product / Service
- Polytronix Inc. - Key offerings
- 15.38 RavenWindow
- RavenWindow - Overview
- RavenWindow - Product / Service
- RavenWindow - Key offerings
- 15.39 Research Frontiers Incorporated
- Research Frontiers Incorporated - Overview
- Research Frontiers Incorporated - Product / Service
- Research Frontiers Incorporated - Key offerings
- 15.40 SageGlass (Saint-Gobain)
- SageGlass (Saint-Gobain) - Overview
- SageGlass (Saint-Gobain) - Product / Service
- SageGlass (Saint-Gobain) - Key offerings
- 15.41 Smartglass International Limited
- Smartglass International Limited - Overview
- Smartglass International Limited - Product / Service
- Smartglass International Limited - Key offerings
- 15.42 View Inc.
- View Inc. - Overview
- View Inc. - Product / Service
- View Inc. - Key offerings
13 Appendix
- 13.2 Inclusions and exclusions checklist
- Exhibit 183: Inclusions checklist
- Exhibit 184: Exclusions checklist
- 13.3 Currency conversion rates for US$
- Exhibit 185: Currency conversion rates for US$
- 13.4 Research methodology
- Exhibit 186: Research methodology
- Exhibit 187: Validation techniques employed for market sizing
- Exhibit 188: Information sources
- 13.5 List of abbreviations
- Exhibit 189: List of abbreviations