Automotive Seat Belt Pretensioner Market Analysis, Size, and Forecast 2025-2029: APAC (China, Japan, and India), Europe (Germany, France, and UK), North America (US, Canada, and Mexico), South America (Brazil, Argentina, and Colombia), Middle East and Africa (Saudi Arabia, UAE, and South Africa), and Rest of World (ROW)

Automotive Seat Belt Pretensioner Market Analysis, Size, and Forecast 2025-2029:
APAC (China, Japan, and India), Europe (Germany, France, and UK), North America (US, Canada, and Mexico), South America (Brazil, Argentina, and Colombia), Middle East and Africa (Saudi Arabia, UAE, and South Africa), and Rest of World (ROW)

Published: Dec 2025 278 Pages SKU: IRTNTR73236

Market Overview at a Glance

$5.27 B
Market Opportunity
6.9%
CAGR 2024 - 2029
51.8%
APAC Growth
$11.56 B
PC segment 2023

Automotive Seat Belt Pretensioner Market Size 2025-2029

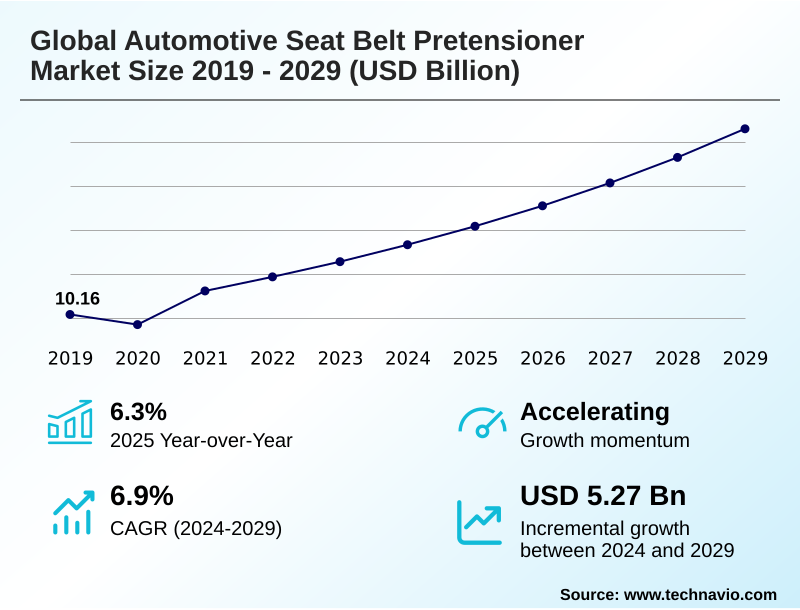
The automotive seat belt pretensioner market size is valued to increase by USD 5.27 billion, at a CAGR of 6.9% from 2024 to 2029. Increasing demand for SUVs will drive the automotive seat belt pretensioner market.

Major Market Trends & Insights

  • APAC dominated the market and accounted for a 51.8% growth during the forecast period.
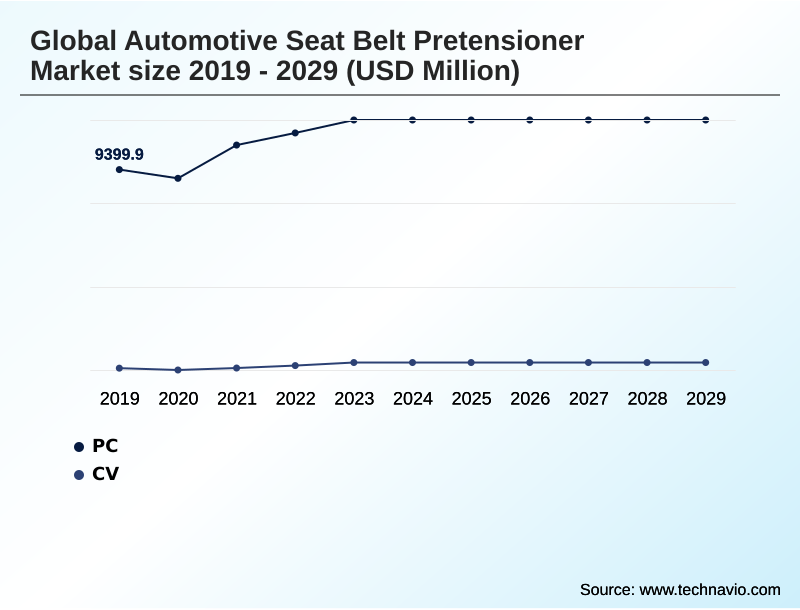
  • By Application - PC segment was valued at USD 11.56 billion in 2023
  • By Type - OEM segment accounted for the largest market revenue share in 2023

Market Size & Forecast

  • Market Opportunities: USD 8.44 billion
  • Market Future Opportunities: USD 5.27 billion
  • CAGR from 2024 to 2029 : 6.9%

Market Summary

  • The automotive seat belt pretensioner market is integral to enhancing vehicle safety, driven by stringent government regulations and rising consumer demand for robust occupant protection. These systems, a critical component of a vehicle's passive safety system, function by removing slack from the seat belt during a collision, securing the occupant firmly.
  • Growth is propelled by the increasing production of passenger vehicles, especially SUVs, and the expanding integration of these safety features beyond luxury models into mid-range and economy cars. A key industry trend is the technological advancement toward more sophisticated systems, including the integration of crash sensors with the electronic control unit (ECU).
  • For instance, a fleet management company optimizing its vehicle procurement strategy would prioritize models with advanced occupant restraint systems that meet the latest New Car Assessment Program (NCAP) standards. This not only ensures driver safety but also lowers insurance premiums and reduces liability, demonstrating a clear operational benefit.
  • However, the market faces challenges from consumer perceptions of discomfort and cost pressures in manufacturing, which temper the pace of adoption in some segments.

What will be the Size of the Automotive Seat Belt Pretensioner Market during the forecast period?

Get Key Insights on Market Forecast (PDF) Request Free Sample

How is the Automotive Seat Belt Pretensioner Market Segmented?

The automotive seat belt pretensioner industry research report provides comprehensive data (region-wise segment analysis), with forecasts and estimates in "USD million" for the period 2025-2029, as well as historical data from 2019-2023 for the following segments.

  • Application
    • PC
    • CV
  • Type
    • OEM
    • Aftermarket
  • Technology
    • Retractor pretensioner
    • Buckle pretensioner
  • Geography
    • APAC
      • China
      • Japan
      • India
    • Europe
      • Germany
      • France
      • UK
    • North America
      • US
      • Canada
      • Mexico
    • South America
      • Brazil
      • Argentina
      • Colombia
    • Middle East and Africa
      • Saudi Arabia
      • UAE
      • South Africa
    • Rest of World (ROW)

By Application Insights

The pc segment is estimated to witness significant growth during the forecast period.

Market segmentation is primarily defined by application, with passenger cars (PCs) representing the dominant share.

The PC segment, which accounted for over 91% of the market in 2024, is driven by stringent automotive safety regulations and high consumer expectations for safety.

The integration of a pyrotechnic pretensioner, particularly the retractor pretensioner type, is standard in new vehicles.

These systems are a core part of a vehicle's active safety system, relying on a crash sensor and seat belt sensor to analyze vehicle crash dynamics and occupant kinematics in real-time.

A pyrotechnic gas generator provides the rapid force needed for activation. This focus on advanced technology underscores the industry’s commitment to exceeding baseline safety requirements in the high-volume PC segment.

Request Free Sample

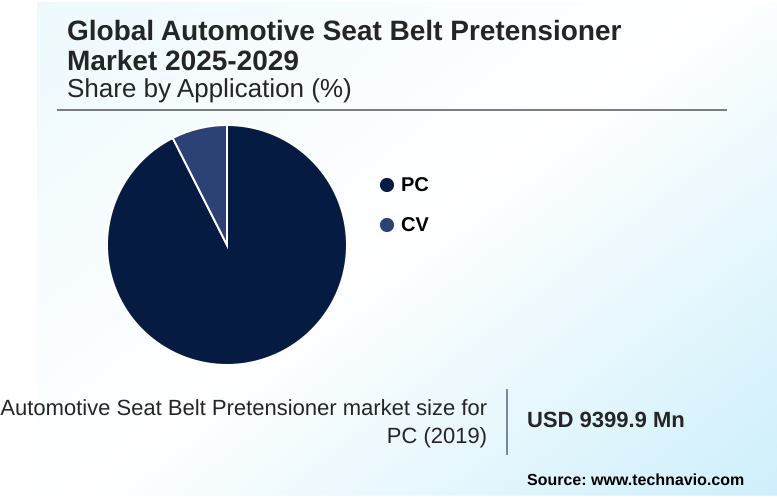
The PC segment was valued at USD 11.56 billion in 2023 and showed a gradual increase during the forecast period.

Request Free Sample

Regional Analysis

APAC is estimated to contribute 51.8% to the growth of the global market during the forecast period.Technavio’s analysts have elaborately explained the regional trends and drivers that shape the market during the forecast period.

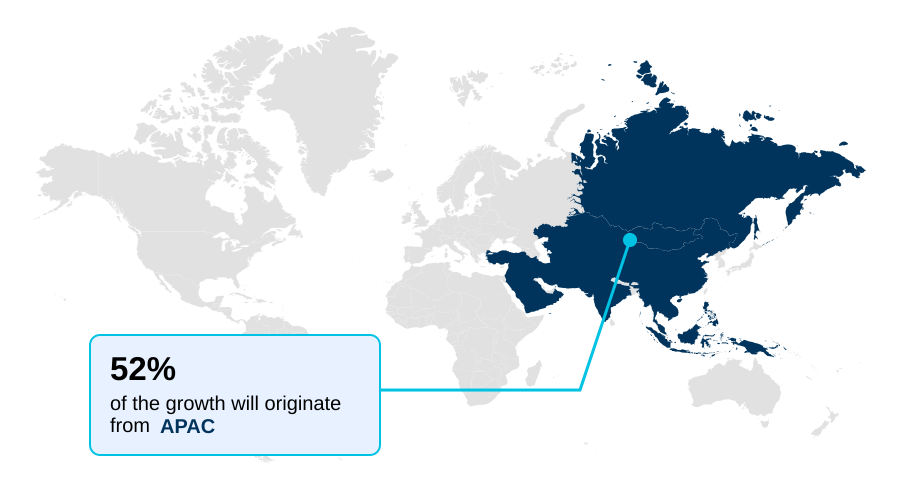
See How Automotive Seat Belt Pretensioner Market Demand is Rising in APAC Request Free Sample

The geographic landscape is led by APAC, which is set to contribute over 51% of the market's incremental growth. This dominance is fueled by rising vehicle safety standards and local manufacturing strength.

In contrast, North America and Europe are mature markets focused on technological evolution, such as the adoption of energy-efficient pretensioner designs over older mechanical pretensioner systems.

The restraint control module in these regions features advanced sensor integration for precise crash severity detection and links to sophisticated occupant classification systems.

There is also a growing focus on adaptive seat belt systems that use occupant position detection and inputs from the accident data recorder to tailor restraint characteristics, improving safety outcomes by up to 10% in certain offset collisions.

Market Dynamics

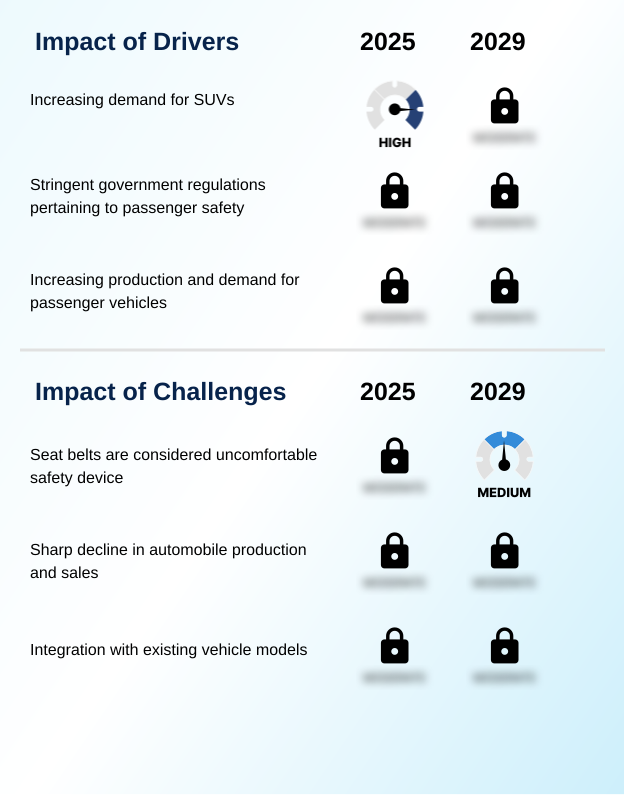
Our researchers analyzed the data with 2024 as the base year, along with the key drivers, trends, and challenges. A holistic analysis of drivers will help companies refine their marketing strategies to gain a competitive advantage.

  • Strategic decisions in the automotive safety sector require a deep understanding of component-level performance and system integration. A key debate involves the merits of pyrotechnic vs mechanical seat belt pretensioner designs, with pyrotechnic options offering faster response times.
  • The successful retractor pretensioner integration with airbag systems is critical for synchronized occupant protection, a factor that is rigorously evaluated in crash simulations. Similarly, buckle pretensioner effectiveness in rollover collisions is a specialized area of R&D, as these events present unique kinematic challenges. Looking ahead, the design of an active safety system for autonomous vehicle occupants is a major focus.
  • The impact of load limiters on occupant injury metrics is continuously studied to refine restraint forces. A crucial operational metric is seat belt pretensioner performance in low-speed impacts, where preventing nuisance deployments is key. Businesses conduct a thorough cost-benefit analysis of dual-stage pretensioners, weighing enhanced safety against higher unit costs.
  • Furthermore, the challenges in retrofitting pretensioners in older vehicles limit aftermarket scope. Supply chain planning must account for strict regulatory compliance for seat belt pretensioner systems and OEM requirements for pretensioner cycle testing. The use of lightweight material adoption in pretensioner design supports fuel efficiency goals, while simulation of pretensioner deployment in crash tests accelerates development.
  • The role of pretensioners in integrated safety systems and robust pretensioner malfunction diagnosis and fault codes are vital.
  • The maintenance and replacement cycles for pyrotechnic units, human body modeling for pretensioner system optimization, integration of pretensioners with active seat bolsters, thermal management of pyrotechnic gas generators, and adaptive force limiting in seat belt systems represent the frontiers of personalized occupant safety.

What are the key market drivers leading to the rise in the adoption of Automotive Seat Belt Pretensioner Industry?

  • A key driver fueling market growth is the increasing global demand for sports utility vehicles (SUVs), which frequently incorporate advanced safety systems.

  • Market growth is strongly driven by regulatory mandates and the increasing complexity of vehicle safety architecture.
  • The integration of a buckle pretensioner as part of a comprehensive passive safety system is becoming standard, offering enhanced frontal collision protection and side-impact protection. Innovations in lightweight materials are enabling the production of more efficient components without compromising strength.
  • The electronic control unit (ECU) orchestrates these systems, often including a load limiter to manage belt forces. A key enabler is improved seat assembly integration, which simplifies manufacturing and improves system reliability.
  • Automakers' focus on holistic safety design, where every component works in unison, propels demand and continuous R&D investment in these critical systems.

What are the market trends shaping the Automotive Seat Belt Pretensioner Industry?

  • The market is witnessing a notable trend toward the increased adoption of advanced safety features in low-cost, compact cars and commercial vehicles.

  • A significant trend is the democratization of advanced safety features, extending beyond luxury vehicles. The complete occupant restraint system, including durable seat belt webbing, is now a key factor in achieving high New Car Assessment Program (NCAP) ratings, driving adoption in economy models.
  • This push for enhanced collision mitigation has resulted in a 95% installation rate for seat belt reminder (SBR) systems in new models in developed regions. Furthermore, advanced restraint technologies like active seat belt technology are gaining traction. This involves smart sensor integration for adaptive performance, ensuring vehicle safety compliance while improving user comfort.
  • The industry is moving toward systems that not only react to crashes but also anticipate and adapt to occupant behavior.

What challenges does the Automotive Seat Belt Pretensioner Industry face during its growth?

  • A key challenge impacting industry growth is the consumer perception of seat belts as uncomfortable, which can hinder consistent use.

  • A primary challenge involves the cost and complexity of integrating pretensioners with other advanced systems. The link between the seat belt retractor mechanism and Advanced Driver-Assistance Systems (ADAS), for instance, requires sophisticated software to prevent false activations from a pyrotechnic initiator. Ensuring robust occupant protection across diverse crash scenarios on new modular vehicle platforms adds to engineering costs.
  • While OEM safety specifications are stringent, the market for certified aftermarket pretensioner kits remains niche, creating maintenance challenges. The reliability of the pyrotechnic safety device over a vehicle's lifespan is another concern, as replacement costs can sometimes exceed 3-5% of a vehicle's residual value.

Exclusive Technavio Analysis on Customer Landscape

The automotive seat belt pretensioner market forecasting report includes the adoption lifecycle of the market, covering from the innovator’s stage to the laggard’s stage. It focuses on adoption rates in different regions based on penetration. Furthermore, the automotive seat belt pretensioner market report also includes key purchase criteria and drivers of price sensitivity to help companies evaluate and develop their market growth analysis strategies.

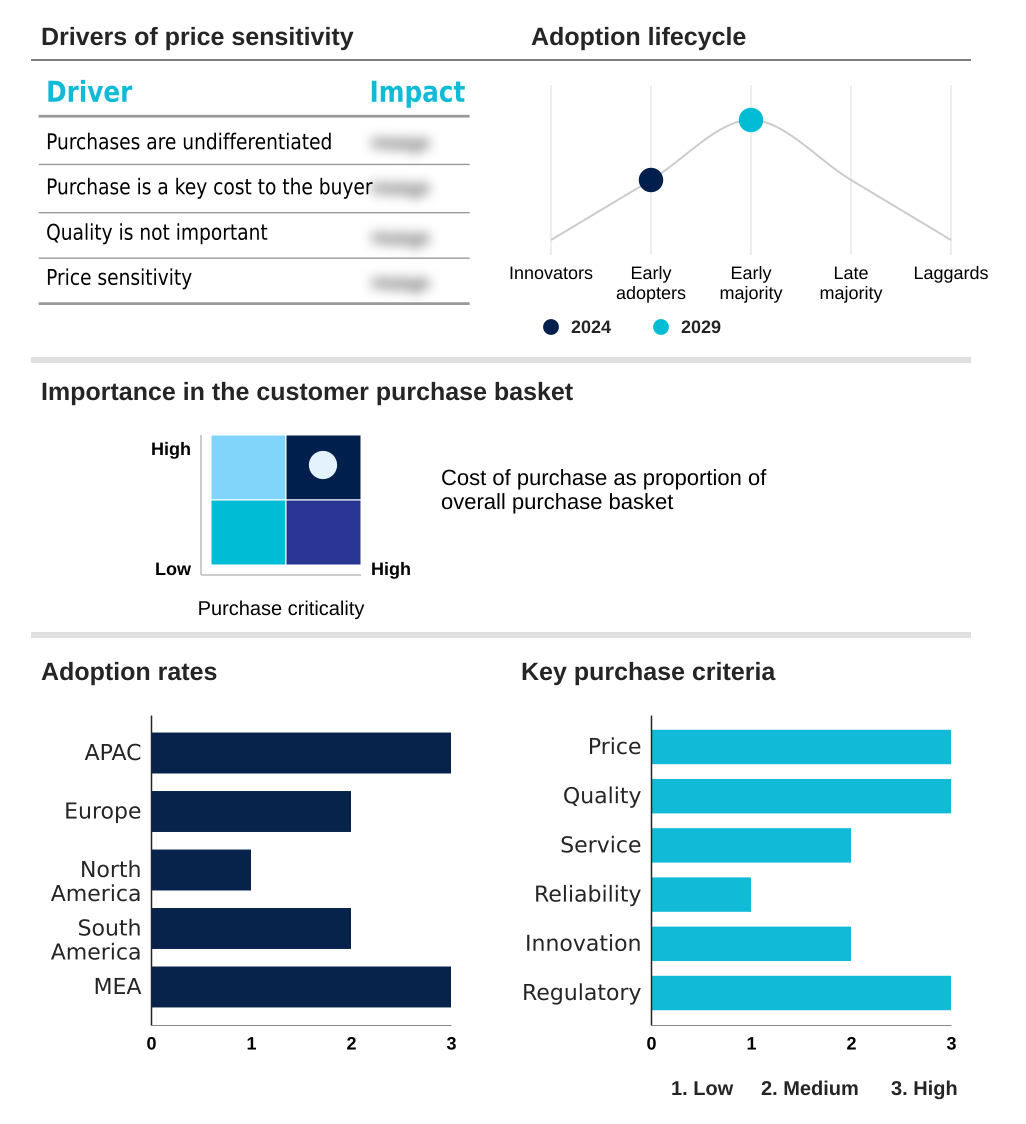
Customer Landscape of Automotive Seat Belt Pretensioner Industry

Competitive Landscape

Companies are implementing various strategies, such as strategic alliances, automotive seat belt pretensioner market forecast, partnerships, mergers and acquisitions, geographical expansion, and product/service launches, to enhance their presence in the industry.

AmSafe Inc. - Offerings include advanced dual-stage pretensioners that provide modulated protection by adjusting seat belt tension according to collision severity, ensuring optimal restraint.

The industry research and growth report includes detailed analyses of the competitive landscape of the market and information about key companies, including:

  • AmSafe Inc.
  • Ashimori Industry Co. Ltd.
  • Autoliv Inc.
  • DENSO Corp.
  • Guangzhou Fuxin Auto Parts Co. Ltd.
  • Hyundai Motor Group
  • Illinois Tool Works Inc.
  • Iron Force Industrial Co. Ltd.
  • Joyson Safety Systems Aschaffenburg GmbH
  • Robert Bosch GmbH
  • Special Devices Inc.
  • Tokai Rika Co. Ltd.
  • Wenzhou Far Europe Auto Parts Co. Ltd.
  • Wenzhou Far Europe Automobile Safety System Co. Ltd.
  • ZF Friedrichshafen AG

Qualitative and quantitative analysis of companies has been conducted to help clients understand the wider business environment as well as the strengths and weaknesses of key industry players. Data is qualitatively analyzed to categorize companies as pure play, category-focused, industry-focused, and diversified; it is quantitatively analyzed to categorize companies as dominant, leading, strong, tentative, and weak.

Recent Development and News in Automotive seat belt pretensioner market

  • In September 2024, SafeRide Systems announced a strategic partnership with AutoIntelli Inc. to integrate its new energy-efficient pretensioner systems with next-generation ADAS platforms, aiming to enhance predictive safety activation in autonomous vehicles.
  • In November 2024, Autoliv Inc. completed the acquisition of a smaller tech firm, PyroTech Innovations, for $150 million to bolster its R&D in pyrotechnic gas generator technology and compact pretensioner designs.
  • In March 2025, Joyson Safety Systems launched its 'Smart-Tension' active seat belt technology, a new product featuring sensor integration for adaptive force limiting based on occupant size and position.
  • In May 2025, Robert Bosch GmbH received ECE R16 approval for its new modular buckle pretensioner, designed for simplified integration into electric vehicle platforms across European markets.

Dive into Technavio’s robust research methodology, blending expert interviews, extensive data synthesis, and validated models for unparalleled Automotive Seat Belt Pretensioner Market insights. See full methodology.

Market Scope
Page number 278
Base year 2024
Historic period 2019-2023
Forecast period 2025-2029
Growth momentum & CAGR Accelerate at a CAGR of 6.9%
Market growth 2025-2029 USD 5272.0 million
Market structure Fragmented
YoY growth 2024-2025(%) 6.3%
Key countries China, Japan, India, South Korea, Australia, Indonesia, Germany, France, UK, The Netherlands, Italy, Spain, US, Canada, Mexico, Brazil, Argentina, Colombia, Saudi Arabia, UAE, South Africa, Israel and Turkey
Competitive landscape Leading Companies, Market Positioning of Companies, Competitive Strategies, and Industry Risks

Request Free Sample

Research Analyst Overview

  • The automotive seat belt pretensioner market is defined by a sophisticated interplay of technologies designed for superior occupant protection. Core to this is the occupant restraint system, which relies on a seat belt retractor mechanism and a restraint control module.
  • Activation is triggered by a crash sensor that prompts a pyrotechnic initiator; this ignites a pyrotechnic gas generator within either a retractor pretensioner or a buckle pretensioner. These pyrotechnic pretensioner designs are increasingly favored over older mechanical pretensioner systems.
  • The integration of the electronic control unit (ECU) is crucial for collision mitigation, enabling coordination with the vehicle's passive safety system and active safety system. Innovations focus on energy-efficient pretensioner models and advanced sensor integration for improved crash severity detection. A key boardroom consideration is adherence to evolving vehicle safety standards and achieving high New Car Assessment Program (NCAP) ratings.
  • This involves sophisticated occupant classification systems and the integration of a load limiter with seat belt webbing. Such enhancements, often linked with Advanced Driver-Assistance Systems (ADAS), have led to a demonstrated 15% reduction in certain injury metrics in certified crash tests.

What are the Key Data Covered in this Automotive Seat Belt Pretensioner Market Research and Growth Report?

  • What is the expected growth of the Automotive Seat Belt Pretensioner Market between 2025 and 2029?

    • USD 5.27 billion, at a CAGR of 6.9%

  • What segmentation does the market report cover?

    • The report is segmented by Application (PC, CV), Type (OEM, Aftermarket), Technology (Retractor pretensioner, Buckle pretensioner) and Geography (APAC, Europe, North America, South America, Middle East and Africa)

  • Which regions are analyzed in the report?

    • APAC, Europe, North America, South America and Middle East and Africa

  • What are the key growth drivers and market challenges?

    • Increasing demand for SUVs, Seat belts are considered uncomfortable safety device

  • Who are the major players in the Automotive Seat Belt Pretensioner Market?

    • AmSafe Inc., Ashimori Industry Co. Ltd., Autoliv Inc., DENSO Corp., Guangzhou Fuxin Auto Parts Co. Ltd., Hyundai Motor Group, Illinois Tool Works Inc., Iron Force Industrial Co. Ltd., Joyson Safety Systems Aschaffenburg GmbH, Robert Bosch GmbH, Special Devices Inc., Tokai Rika Co. Ltd., Wenzhou Far Europe Auto Parts Co. Ltd., Wenzhou Far Europe Automobile Safety System Co. Ltd. and ZF Friedrichshafen AG

Market Research Insights

  • The market's dynamics are heavily influenced by stringent automotive safety regulations and a focus on vehicle safety compliance. Innovations in advanced restraint technologies are paramount, with a move toward smart sensor integration and active seat belt technology. Manufacturers are leveraging lightweight materials and modular vehicle platforms to facilitate seat assembly integration while meeting OEM safety specifications.
  • Understanding vehicle crash dynamics and occupant kinematics is essential for developing effective frontal collision protection and side-impact protection. A critical component is the seat belt sensor, which works with systems for occupant position detection. While pyrotechnic safety devices are standard, there's growing interest in adaptive seat belt systems.
  • The seat belt reminder (SBR) is now a baseline feature, with a notable 90% adoption rate in new vehicles in developed regions. For the aftermarket, the availability of certified aftermarket pretensioner kits is growing, though their use is less than 10% compared to OEM installations, impacting maintenance strategies. The accident data recorder provides crucial post-crash information.

We can help! Our analysts can customize this automotive seat belt pretensioner market research report to meet your requirements.

Get in touch

1. Executive Summary

1.1 Market overview

Executive Summary - Chart on Market Overview
Executive Summary - Data Table on Market Overview
Executive Summary - Chart on Global Market Characteristics
Executive Summary - Chart on Market by Geography
Executive Summary - Chart on Market Segmentation by Application
Executive Summary - Chart on Market Segmentation by Type
Executive Summary - Chart on Market Segmentation by Technology
Executive Summary - Chart on Incremental Growth
Executive Summary - Data Table on Incremental Growth
Executive Summary - Chart on Company Market Positioning

2. Technavio Analysis

2.1 Analysis of price sensitivity, lifecycle, customer purchase basket, adoption rates, and purchase criteria

2.2 Criticality of inputs and Factors of differentiation

Chart on Overview on criticality of inputs and factors of differentiation

2.3 Factors of disruption

Chart on Overview on factors of disruption

2.4 Impact of drivers and challenges

Chart on Impact of drivers and challenges in 2024 and 2029

3. Market Landscape

3.1 Market ecosystem

Chart on Parent Market
Data Table on - Parent Market

3.2 Market characteristics

Chart on Market characteristics analysis

3.3 Value chain analysis

Chart on Value chain analysis

4. Market Sizing

4.1 Market definition

Data Table on Offerings of companies included in the market definition

4.2 Market segment analysis

Market segments

4.3 Market size 2024

4.4 Market outlook: Forecast for 2024-2029

Chart on Global - Market size and forecast 2024-2029 ($ million)
Data Table on Global - Market size and forecast 2024-2029 ($ million)
Chart on Global Market: Year-over-year growth 2024-2029 (%)
Data Table on Global Market: Year-over-year growth 2024-2029 (%)

5. Historic Market Size

5.1 Global Automotive Seat Belt Pretensioner Market 2019 - 2023

Historic Market Size - Data Table on Global Automotive Seat Belt Pretensioner Market 2019 - 2023 ($ million)

5.2 Application segment analysis 2019 - 2023

Historic Market Size - Application Segment 2019 - 2023 ($ million)

5.3 Type segment analysis 2019 - 2023

Historic Market Size - Type Segment 2019 - 2023 ($ million)

5.4 Technology segment analysis 2019 - 2023

Historic Market Size - Technology Segment 2019 - 2023 ($ million)

5.5 Geography segment analysis 2019 - 2023

Historic Market Size - Geography Segment 2019 - 2023 ($ million)

5.6 Country segment analysis 2019 - 2023

Historic Market Size - Country Segment 2019 - 2023 ($ million)

6. Qualitative Analysis

6.1 Impact of AI on the Global Automotive Seat Belt Pretensioner Market

7. Five Forces Analysis

7.1 Five forces summary

Five forces analysis - Comparison between 2024 and 2029

7.2 Bargaining power of buyers

Bargaining power of buyers - Impact of key factors 2024 and 2029

7.3 Bargaining power of suppliers

Bargaining power of suppliers - Impact of key factors in 2024 and 2029

7.4 Threat of new entrants

Threat of new entrants - Impact of key factors in 2024 and 2029

7.5 Threat of substitutes

Threat of substitutes - Impact of key factors in 2024 and 2029

7.6 Threat of rivalry

Threat of rivalry - Impact of key factors in 2024 and 2029

7.7 Market condition

Chart on Market condition - Five forces 2024 and 2029

8. Market Segmentation by Application

8.1 Market segments

Chart on Application - Market share 2024-2029 (%)
Data Table on Application - Market share 2024-2029 (%)

8.2 Comparison by Application

Chart on Comparison by Application
Data Table on Comparison by Application

8.3 PC - Market size and forecast 2024-2029

Chart on PC - Market size and forecast 2024-2029 ($ million)
Data Table on PC - Market size and forecast 2024-2029 ($ million)
Chart on PC - Year-over-year growth 2024-2029 (%)
Data Table on PC - Year-over-year growth 2024-2029 (%)

8.4 CV - Market size and forecast 2024-2029

Chart on CV - Market size and forecast 2024-2029 ($ million)
Data Table on CV - Market size and forecast 2024-2029 ($ million)
Chart on CV - Year-over-year growth 2024-2029 (%)
Data Table on CV - Year-over-year growth 2024-2029 (%)

8.5 Market opportunity by Application

Market opportunity by Application ($ million)
Data Table on Market opportunity by Application ($ million)

9. Market Segmentation by Type

9.1 Market segments

Chart on Type - Market share 2024-2029 (%)
Data Table on Type - Market share 2024-2029 (%)

9.2 Comparison by Type

Chart on Comparison by Type
Data Table on Comparison by Type

9.3 OEM - Market size and forecast 2024-2029

Chart on OEM - Market size and forecast 2024-2029 ($ million)
Data Table on OEM - Market size and forecast 2024-2029 ($ million)
Chart on OEM - Year-over-year growth 2024-2029 (%)
Data Table on OEM - Year-over-year growth 2024-2029 (%)

9.4 Aftermarket - Market size and forecast 2024-2029

Chart on Aftermarket - Market size and forecast 2024-2029 ($ million)
Data Table on Aftermarket - Market size and forecast 2024-2029 ($ million)
Chart on Aftermarket - Year-over-year growth 2024-2029 (%)
Data Table on Aftermarket - Year-over-year growth 2024-2029 (%)

9.5 Market opportunity by Type

Market opportunity by Type ($ million)
Data Table on Market opportunity by Type ($ million)

10. Market Segmentation by Technology

10.1 Market segments

Chart on Technology - Market share 2024-2029 (%)
Data Table on Technology - Market share 2024-2029 (%)

10.2 Comparison by Technology

Chart on Comparison by Technology
Data Table on Comparison by Technology

10.3 Retractor pretensioner - Market size and forecast 2024-2029

Chart on Retractor pretensioner - Market size and forecast 2024-2029 ($ million)
Data Table on Retractor pretensioner - Market size and forecast 2024-2029 ($ million)
Chart on Retractor pretensioner - Year-over-year growth 2024-2029 (%)
Data Table on Retractor pretensioner - Year-over-year growth 2024-2029 (%)

10.4 Buckle pretensioner - Market size and forecast 2024-2029

Chart on Buckle pretensioner - Market size and forecast 2024-2029 ($ million)
Data Table on Buckle pretensioner - Market size and forecast 2024-2029 ($ million)
Chart on Buckle pretensioner - Year-over-year growth 2024-2029 (%)
Data Table on Buckle pretensioner - Year-over-year growth 2024-2029 (%)

10.5 Market opportunity by Technology

Market opportunity by Technology ($ million)
Data Table on Market opportunity by Technology ($ million)

11. Customer Landscape

11.1 Customer landscape overview

Analysis of price sensitivity, lifecycle, customer purchase basket, adoption rates, and purchase criteria

12. Geographic Landscape

12.1 Geographic segmentation

Chart on Market share by geography 2024-2029 (%)
Data Table on Market share by geography 2024-2029 (%)

12.2 Geographic comparison

Chart on Geographic comparison
Data Table on Geographic comparison

12.3 APAC - Market size and forecast 2024-2029

Chart on APAC - Market size and forecast 2024-2029 ($ million)
Data Table on APAC - Market size and forecast 2024-2029 ($ million)
Chart on APAC - Year-over-year growth 2024-2029 (%)
Data Table on APAC - Year-over-year growth 2024-2029 (%)
Chart on Regional Comparison - APAC
Data Table on Regional Comparison - APAC

12.3.1 China - Market size and forecast 2024-2029

Chart on China - Market size and forecast 2024-2029 ($ million)
Data Table on China - Market size and forecast 2024-2029 ($ million)
Chart on China - Year-over-year growth 2024-2029 (%)
Data Table on China - Year-over-year growth 2024-2029 (%)

12.3.2 Japan - Market size and forecast 2024-2029

Chart on Japan - Market size and forecast 2024-2029 ($ million)
Data Table on Japan - Market size and forecast 2024-2029 ($ million)
Chart on Japan - Year-over-year growth 2024-2029 (%)
Data Table on Japan - Year-over-year growth 2024-2029 (%)

12.3.3 India - Market size and forecast 2024-2029

Chart on India - Market size and forecast 2024-2029 ($ million)
Data Table on India - Market size and forecast 2024-2029 ($ million)
Chart on India - Year-over-year growth 2024-2029 (%)
Data Table on India - Year-over-year growth 2024-2029 (%)

12.3.4 South Korea - Market size and forecast 2024-2029

Chart on South Korea - Market size and forecast 2024-2029 ($ million)
Data Table on South Korea - Market size and forecast 2024-2029 ($ million)
Chart on South Korea - Year-over-year growth 2024-2029 (%)
Data Table on South Korea - Year-over-year growth 2024-2029 (%)

12.3.5 Australia - Market size and forecast 2024-2029

Chart on Australia - Market size and forecast 2024-2029 ($ million)
Data Table on Australia - Market size and forecast 2024-2029 ($ million)
Chart on Australia - Year-over-year growth 2024-2029 (%)
Data Table on Australia - Year-over-year growth 2024-2029 (%)

12.3.6 Indonesia - Market size and forecast 2024-2029

Chart on Indonesia - Market size and forecast 2024-2029 ($ million)
Data Table on Indonesia - Market size and forecast 2024-2029 ($ million)
Chart on Indonesia - Year-over-year growth 2024-2029 (%)
Data Table on Indonesia - Year-over-year growth 2024-2029 (%)

12.4 Europe - Market size and forecast 2024-2029

Chart on Europe - Market size and forecast 2024-2029 ($ million)
Data Table on Europe - Market size and forecast 2024-2029 ($ million)
Chart on Europe - Year-over-year growth 2024-2029 (%)
Data Table on Europe - Year-over-year growth 2024-2029 (%)
Chart on Regional Comparison - Europe
Data Table on Regional Comparison - Europe

12.4.1 Germany - Market size and forecast 2024-2029

Chart on Germany - Market size and forecast 2024-2029 ($ million)
Data Table on Germany - Market size and forecast 2024-2029 ($ million)
Chart on Germany - Year-over-year growth 2024-2029 (%)
Data Table on Germany - Year-over-year growth 2024-2029 (%)

12.4.2 France - Market size and forecast 2024-2029

Chart on France - Market size and forecast 2024-2029 ($ million)
Data Table on France - Market size and forecast 2024-2029 ($ million)
Chart on France - Year-over-year growth 2024-2029 (%)
Data Table on France - Year-over-year growth 2024-2029 (%)

12.4.3 UK - Market size and forecast 2024-2029

Chart on UK - Market size and forecast 2024-2029 ($ million)
Data Table on UK - Market size and forecast 2024-2029 ($ million)
Chart on UK - Year-over-year growth 2024-2029 (%)
Data Table on UK - Year-over-year growth 2024-2029 (%)

12.4.4 The Netherlands - Market size and forecast 2024-2029

Chart on The Netherlands - Market size and forecast 2024-2029 ($ million)
Data Table on The Netherlands - Market size and forecast 2024-2029 ($ million)
Chart on The Netherlands - Year-over-year growth 2024-2029 (%)
Data Table on The Netherlands - Year-over-year growth 2024-2029 (%)

12.4.5 Italy - Market size and forecast 2024-2029

Chart on Italy - Market size and forecast 2024-2029 ($ million)
Data Table on Italy - Market size and forecast 2024-2029 ($ million)
Chart on Italy - Year-over-year growth 2024-2029 (%)
Data Table on Italy - Year-over-year growth 2024-2029 (%)

12.4.6 Spain - Market size and forecast 2024-2029

Chart on Spain - Market size and forecast 2024-2029 ($ million)
Data Table on Spain - Market size and forecast 2024-2029 ($ million)
Chart on Spain - Year-over-year growth 2024-2029 (%)
Data Table on Spain - Year-over-year growth 2024-2029 (%)

12.5 North America - Market size and forecast 2024-2029

Chart on North America - Market size and forecast 2024-2029 ($ million)
Data Table on North America - Market size and forecast 2024-2029 ($ million)
Chart on North America - Year-over-year growth 2024-2029 (%)
Data Table on North America - Year-over-year growth 2024-2029 (%)
Chart on Regional Comparison - North America
Data Table on Regional Comparison - North America

12.5.1 US - Market size and forecast 2024-2029

Chart on US - Market size and forecast 2024-2029 ($ million)
Data Table on US - Market size and forecast 2024-2029 ($ million)
Chart on US - Year-over-year growth 2024-2029 (%)
Data Table on US - Year-over-year growth 2024-2029 (%)

12.5.2 Canada - Market size and forecast 2024-2029

Chart on Canada - Market size and forecast 2024-2029 ($ million)
Data Table on Canada - Market size and forecast 2024-2029 ($ million)
Chart on Canada - Year-over-year growth 2024-2029 (%)
Data Table on Canada - Year-over-year growth 2024-2029 (%)

12.5.3 Mexico - Market size and forecast 2024-2029

Chart on Mexico - Market size and forecast 2024-2029 ($ million)
Data Table on Mexico - Market size and forecast 2024-2029 ($ million)
Chart on Mexico - Year-over-year growth 2024-2029 (%)
Data Table on Mexico - Year-over-year growth 2024-2029 (%)

12.6 South America - Market size and forecast 2024-2029

Chart on South America - Market size and forecast 2024-2029 ($ million)
Data Table on South America - Market size and forecast 2024-2029 ($ million)
Chart on South America - Year-over-year growth 2024-2029 (%)
Data Table on South America - Year-over-year growth 2024-2029 (%)
Chart on Regional Comparison - South America
Data Table on Regional Comparison - South America

12.6.1 Brazil - Market size and forecast 2024-2029

Chart on Brazil - Market size and forecast 2024-2029 ($ million)
Data Table on Brazil - Market size and forecast 2024-2029 ($ million)
Chart on Brazil - Year-over-year growth 2024-2029 (%)
Data Table on Brazil - Year-over-year growth 2024-2029 (%)

12.6.2 Argentina - Market size and forecast 2024-2029

Chart on Argentina - Market size and forecast 2024-2029 ($ million)
Data Table on Argentina - Market size and forecast 2024-2029 ($ million)
Chart on Argentina - Year-over-year growth 2024-2029 (%)
Data Table on Argentina - Year-over-year growth 2024-2029 (%)

12.6.3 Colombia - Market size and forecast 2024-2029

Chart on Colombia - Market size and forecast 2024-2029 ($ million)
Data Table on Colombia - Market size and forecast 2024-2029 ($ million)
Chart on Colombia - Year-over-year growth 2024-2029 (%)
Data Table on Colombia - Year-over-year growth 2024-2029 (%)

12.7 Middle East and Africa - Market size and forecast 2024-2029

Chart on Middle East and Africa - Market size and forecast 2024-2029 ($ million)
Data Table on Middle East and Africa - Market size and forecast 2024-2029 ($ million)
Chart on Middle East and Africa - Year-over-year growth 2024-2029 (%)
Data Table on Middle East and Africa - Year-over-year growth 2024-2029 (%)
Chart on Regional Comparison - Middle East and Africa
Data Table on Regional Comparison - Middle East and Africa

12.7.1 Saudi Arabia - Market size and forecast 2024-2029

Chart on Saudi Arabia - Market size and forecast 2024-2029 ($ million)
Data Table on Saudi Arabia - Market size and forecast 2024-2029 ($ million)
Chart on Saudi Arabia - Year-over-year growth 2024-2029 (%)
Data Table on Saudi Arabia - Year-over-year growth 2024-2029 (%)

12.7.2 UAE - Market size and forecast 2024-2029

Chart on UAE - Market size and forecast 2024-2029 ($ million)
Data Table on UAE - Market size and forecast 2024-2029 ($ million)
Chart on UAE - Year-over-year growth 2024-2029 (%)
Data Table on UAE - Year-over-year growth 2024-2029 (%)

12.7.3 South Africa - Market size and forecast 2024-2029

Chart on South Africa - Market size and forecast 2024-2029 ($ million)
Data Table on South Africa - Market size and forecast 2024-2029 ($ million)
Chart on South Africa - Year-over-year growth 2024-2029 (%)
Data Table on South Africa - Year-over-year growth 2024-2029 (%)

12.7.4 Israel - Market size and forecast 2024-2029

Chart on Israel - Market size and forecast 2024-2029 ($ million)
Data Table on Israel - Market size and forecast 2024-2029 ($ million)
Chart on Israel - Year-over-year growth 2024-2029 (%)
Data Table on Israel - Year-over-year growth 2024-2029 (%)

12.7.5 Turkey - Market size and forecast 2024-2029

Chart on Turkey - Market size and forecast 2024-2029 ($ million)
Data Table on Turkey - Market size and forecast 2024-2029 ($ million)
Chart on Turkey - Year-over-year growth 2024-2029 (%)
Data Table on Turkey - Year-over-year growth 2024-2029 (%)

12.8 Market opportunity by geography

Market opportunity by geography ($ million)
Data Tables on Market opportunity by geography ($ million)

13. Drivers, Challenges, and Opportunity

13.1 Market drivers

Increasing demand for SUVs
Stringent government regulations pertaining to passenger safety
Increasing production and demand for passenger vehicles

13.2 Market challenges

Seat belts are considered uncomfortable safety device
Sharp decline in automobile production and sales
Integration with existing vehicle models

13.3 Impact of drivers and challenges

Impact of drivers and challenges in 2024 and 2029

13.4 Market opportunities

Increased adoption in low-cost, compact vehicles and commercial vehicles
Advancements in automotive seat belt technologies
Growing adoption of active safety system

14. Competitive Landscape

14.1 Overview

14.2

Overview on criticality of inputs and factors of differentiation

14.3 Landscape disruption

Overview on factors of disruption

14.4 Industry risks

Impact of key risks on business

15. Competitive Analysis

15.1 Companies profiled

Companies covered

15.2 Company ranking index

15.3 Market positioning of companies

Matrix on companies position and classification

15.4 AmSafe Inc.

AmSafe Inc. - Overview
AmSafe Inc. - Product / Service
AmSafe Inc. - Key offerings
SWOT

15.5 Ashimori Industry Co. Ltd.

Ashimori Industry Co. Ltd. - Overview
Ashimori Industry Co. Ltd. - Business segments
Ashimori Industry Co. Ltd. - Key offerings
Ashimori Industry Co. Ltd. - Segment focus
SWOT

15.6 Autoliv Inc.

Autoliv Inc. - Overview
Autoliv Inc. - Product / Service
Autoliv Inc. - Key news
Autoliv Inc. - Key offerings
SWOT

15.7 DENSO Corp.

DENSO Corp. - Overview
DENSO Corp. - Business segments
DENSO Corp. - Key news
DENSO Corp. - Key offerings
DENSO Corp. - Segment focus
SWOT

15.8 Guangzhou Fuxin Auto Parts Co. Ltd.

Guangzhou Fuxin Auto Parts Co. Ltd. - Overview
Guangzhou Fuxin Auto Parts Co. Ltd. - Product / Service
Guangzhou Fuxin Auto Parts Co. Ltd. - Key offerings
SWOT

15.9 Hyundai Motor Group

Hyundai Motor Group - Overview
Hyundai Motor Group - Business segments
Hyundai Motor Group - Key news
Hyundai Motor Group - Key offerings
Hyundai Motor Group - Segment focus
SWOT

15.10 Illinois Tool Works Inc.

Illinois Tool Works Inc. - Overview
Illinois Tool Works Inc. - Business segments
Illinois Tool Works Inc. - Key offerings
Illinois Tool Works Inc. - Segment focus
SWOT

15.11 Iron Force Industrial Co. Ltd.

Iron Force Industrial Co. Ltd. - Overview
Iron Force Industrial Co. Ltd. - Product / Service
Iron Force Industrial Co. Ltd. - Key offerings
SWOT

15.12 Joyson Safety Systems Aschaffenburg GmbH

Joyson Safety Systems Aschaffenburg GmbH - Overview
Joyson Safety Systems Aschaffenburg GmbH - Product / Service
Joyson Safety Systems Aschaffenburg GmbH - Key offerings
SWOT

15.13 Robert Bosch GmbH

Robert Bosch GmbH - Overview
Robert Bosch GmbH - Product / Service
Robert Bosch GmbH - Key news
Robert Bosch GmbH - Key offerings
SWOT

15.14 Special Devices Inc.

Special Devices Inc. - Overview
Special Devices Inc. - Product / Service
Special Devices Inc. - Key offerings
SWOT

15.15 Tokai Rika Co. Ltd.

Tokai Rika Co. Ltd. - Overview
Tokai Rika Co. Ltd. - Product / Service
Tokai Rika Co. Ltd. - Key offerings
SWOT

15.16 Wenzhou Far Europe Auto Parts Co. Ltd.

Wenzhou Far Europe Auto Parts Co. Ltd. - Overview
Wenzhou Far Europe Auto Parts Co. Ltd. - Product / Service
Wenzhou Far Europe Auto Parts Co. Ltd. - Key offerings
SWOT

15.17 Wenzhou Far Europe Automobile Safety System Co. Ltd.

Wenzhou Far Europe Automobile Safety System Co. Ltd. - Overview
Wenzhou Far Europe Automobile Safety System Co. Ltd. - Product / Service
Wenzhou Far Europe Automobile Safety System Co. Ltd. - Key offerings
SWOT

15.18 ZF Friedrichshafen AG

ZF Friedrichshafen AG - Overview
ZF Friedrichshafen AG - Business segments
ZF Friedrichshafen AG - Key news
ZF Friedrichshafen AG - Key offerings
ZF Friedrichshafen AG - Segment focus
SWOT

16. Appendix

16.1 Scope of the report

Market definition
Objectives
Notes and caveats

16.2 Inclusions and exclusions checklist

Inclusions checklist
Exclusions checklist

16.3 Currency conversion rates for US$

16.4 Research methodology

16.5 Data procurement

Information sources

16.6 Data validation

16.7 Validation techniques employed for market sizing

16.8 Data synthesis

16.9 360 degree market analysis

16.10 List of abbreviations

Research Methodology

Technavio presents a detailed picture of the market by way of study, synthesis, and summation of data from multiple sources. The analysts have presented the various facets of the market with a particular focus on identifying the key industry influencers. The data thus presented is comprehensive, reliable, and the result of extensive research, both primary and secondary.

INFORMATION SOURCES

Primary sources

  • Manufacturers and suppliers
  • Channel partners
  • Industry experts
  • Strategic decision makers

Secondary sources

  • Industry journals and periodicals
  • Government data
  • Financial reports of key industry players
  • Historical data
  • Press releases

DATA ANALYSIS

Data Synthesis

  • Collation of data
  • Estimation of key figures
  • Analysis of derived insights

Data Validation

  • Triangulation with data models
  • Reference against proprietary databases
  • Corroboration with industry experts

REPORT WRITING

Qualitative

  • Market drivers
  • Market challenges
  • Market trends
  • Five forces analysis

Quantitative

  • Market size and forecast
  • Market segmentation
  • Geographical insights
  • Competitive landscape

Interested in this report?

Get your sample now to see our research methodology and insights!

Download Now

Frequently Asked Questions

Automotive Seat Belt Pretensioner market growth will increase by USD 5272.0 million during 2025-2029 .

The Automotive Seat Belt Pretensioner market is expected to grow at a CAGR of 6.9% during 2025-2029 .

Automotive Seat Belt Pretensioner market is segmented by Application (PC, CV) Type (OEM, Aftermarket) Technology (Retractor pretensioner, Buckle pretensioner)

AmSafe Inc., Ashimori Industry Co. Ltd., Autoliv Inc., DENSO Corp., Guangzhou Fuxin Auto Parts Co. Ltd., Hyundai Motor Group, Illinois Tool Works Inc., Iron Force Industrial Co. Ltd., Joyson Safety Systems Aschaffenburg GmbH, Robert Bosch GmbH, Special Devices Inc., Tokai Rika Co. Ltd., Wenzhou Far Europe Auto Parts Co. Ltd., Wenzhou Far Europe Automobile Safety System Co. Ltd., ZF Friedrichshafen AG are a few of the key vendors in the Automotive Seat Belt Pretensioner market.

APAC will register the highest growth rate of 51.8% among the other regions. Therefore, the Automotive Seat Belt Pretensioner market in APAC is expected to garner significant business opportunities for the vendors during the forecast period.

China, Japan, India, South Korea, Australia, Indonesia, Germany, France, UK, The Netherlands, Italy, Spain, US, Canada, Mexico, Brazil, Argentina, Colombia, Saudi Arabia, UAE, South Africa, Israel, Turkey

  • Increasing demand for SUVs is the driving factor this market.

The Automotive Seat Belt Pretensioner market vendors should focus on grabbing business opportunities from the Application segment as it accounted for the largest market share in the base year.