Automotive Seat Belt Sensor Market Analysis Europe, APAC, North America, South America, Middle East and Africa - US, China, Japan, India, UK, Germany - Size and Forecast 2023-2027

Automotive Seat Belt Sensor Market Analysis Europe, APAC, North America, South America, Middle East and Africa - US, China, Japan, India, UK, Germany - Size and Forecast 2023-2027

Published: Nov 2022 163 Pages SKU: IRTNTR44970

Market Overview at a Glance

$44.26 Mn
Market Opportunity
3.78%
CAGR
3.49
YoY growth 2022-2023(%)

Automotive Seat Belt Sensor Market Size 2023-2027

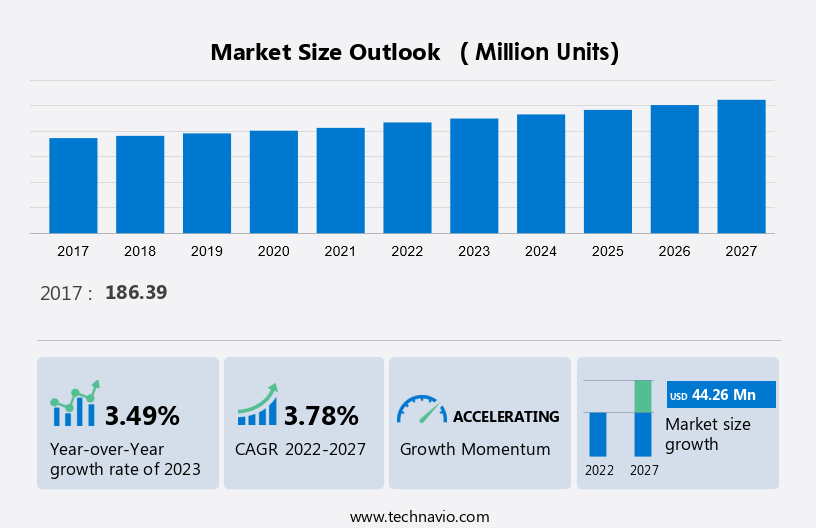
The Automotive Seat Belt Sensor Market size of the market is forecast to increase by 44.26 million units, at a CAGR of 3.78% between 2022 and 2027. The Automotive Seat Belt Sensor market is experiencing significant growth due to several influential factors. Primarily, the emphasis on enhancing occupant safety throughout the automotive value chain is driving market expansion. Additionally, government initiatives aimed at regulating seat belts and reducing accidents further boost market growth. Seat Belt Reminders (SBRs), which are integrated with seat belt sensors, significantly impact the New Car Assessment Program (NCAP) star rating system, making them a favorable addition to modern vehicles. Consequently, the market for automotive seat belt sensors is poised for continued expansion as safety regulations become increasingly stringent and consumer demand for advanced safety features heightens.

 What will the Size of the Automotive Seat Belt Sensor Market be During the Forecast Period?

Automotive Seat Belt Sensor Market Size

To learn more about this report, Download Report Sample

Market Dynamics

Ensuring road safety remains a paramount concern, especially with strict laws and safety regulations governing automotive seat belts and vehicle restraint systems. Advances in Advanced Driver Assistance Systems and autonomous driving technologies like Electronic Stability Control, Collision Avoidance Systems, and Autonomous Emergency Braking enhance safety measures in passenger vehicles, SUVs, crossovers, trucks, and buses. Engineering excellence drives safety innovation with adaptive restraint systems and technologically advanced inflatable seat belts, crucial for mitigating injuries in road accidents. Compliance with regulatory standards and certification processes ensures vehicle electrification and autonomous vehicles meet stringent safety requirements. Privacy and data security in IoT connectivity and cloud-based platforms for vehicle control units enable over-the-air updates and personalization, supporting luxury vehicles and fleet expansion. Vigilance against counterfeit and non-compliant seat belts underscores the importance of sourcing from reputable OEMs and aftermarket suppliers to combat street trading activity and safeguard public safety.

Key Market Driver 

The market growth is being propelled by the increasing focus on improving occupant safety throughout the value chain. Passenger safety has become a primary concern for players across the automotive industry, leading to the adoption of both passive and active safety systems. To reduce the impact of accidents, automobile manufacturers are integrating passive safety systems with active safety systems, including seat belts, seat belt sensors, seat belt lock engagement, and side airbags.

Moreover, this emphasis on safety systems has resulted in double-digit growth rates in the overall automotive safety systems market, as evidenced by the weightage scale for the EU NCAP rating in recent years. As a result, seat belts, seat belt sensors, airbags, and other enhancements such as active seat belts are expected to become increasingly important fitments in vehicles, driving market growth in the forecast period.

Key Market Trend

The key trend driving the growth of the automotive seat belt sensor market is the increased adoption of low-cost, compact vehicles, and commercial vehicles (CVs). The need for enhanced safety features has increased across all automotive segments, including low-cost and compact automotive segments, due to regulatory mandates and consumer demand. Technavio predicts that there will be a significant surge in demand for automotive seat belt sensors in low-cost and compact vehicles during the forecast period, especially in developed regions. The adoption of seat belt sensors in CVs is expected to increase due to growing concerns about road fatalities and awareness among consumers for safety features.

Key Market Challenge

The major challenge impeding the growth of the market is the malfunctioning of seat belt sensors. Accurate tuning of the system is essential to avoid false-positive alarms and prevent unwanted activation of pretensions or tightening of seat belts when not required. Seat belt sensor manufacturers need to be aware of such consequences to deliver products that meet user expectations and prevent occasional faults that can negatively impact the acceptance and adoption of the system.

Key Automotive Seat Belt Sensor Market Customer Landscape

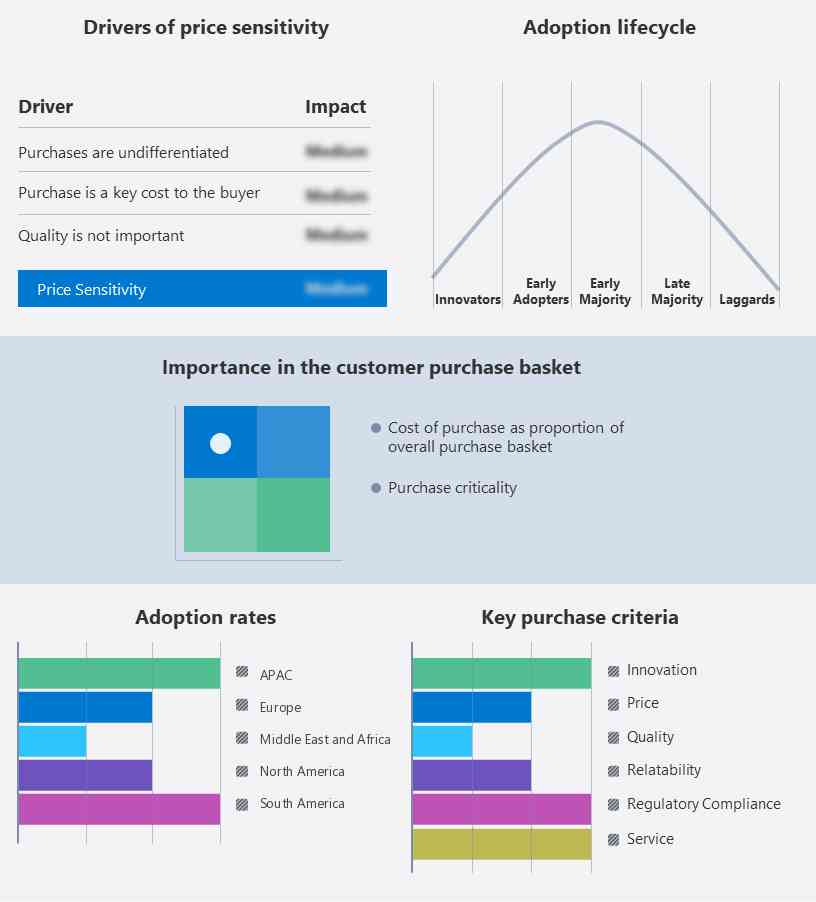
The market report includes the adoption lifecycle of the market, covering from the innovator's stage to the laggard's stage. It focuses on adoption rates in different regions based on penetration. Furthermore, the report also includes key purchase criteria and drivers of price sensitivity to help companies evaluate and develop their growth strategies.

Automotive Seat Belt Sensor Market Share by Geography

Global Automotive Seat Belt Sensor Market Customer Landscape

Who are the Major Automotive Seat Belt Sensor Market Vendors?                  

Vendors are implementing various strategies, such as strategic alliances, partnerships, mergers and acquisitions, geographical expansion, and product/service launches, to enhance their presence in the market.

ZF Friedrichshafen AG - The company offers an active control retractor (ACR8) which provides occupant protection with reversible seat belt pre-tensioning. Through the active safety system segment, the company offers the development and production of steering and braking systems for the automotive industry. Additionally, the company offers chassis systems and components.

The automotive seat belt sensor market report also includes detailed analyses of the competitive landscape of the market and information about 15 market vendors, including:

  • Amber Valley Developments LLP
  • Amphenol Corp.
  • Aptiv
  • CTS Corp.
  • Hesham Industrial Solutions
  • IEE International Electronics and Engineering S.A.
  • InterMotive Inc.
  • Littelfuse Inc.
  • Lockliv Holdings Pty Ltd.
  • Olea Systems Inc.
  • Reed Relays and Electronics India Ltd.
  • Securon (Amersham) LTD
  • Standex Electronics Inc.
  • TE Connectivity Ltd.
  • Wenzhou Far Europe Automobile Safety System Co. Ltd.

Qualitative and quantitative analysis of vendors has been conducted to help clients understand the wider business environment as well as the strengths and weaknesses of key market players. Data is qualitatively analyzed to categorize vendors as pure play, category-focused, industry-focused, and diversified; it is quantitatively analyzed to categorize vendors as dominant, leading, strong, tentative, and weak.

What is the Fastest-Growing Segment in the Automotive Seat Belt Sensor Market?

By Application

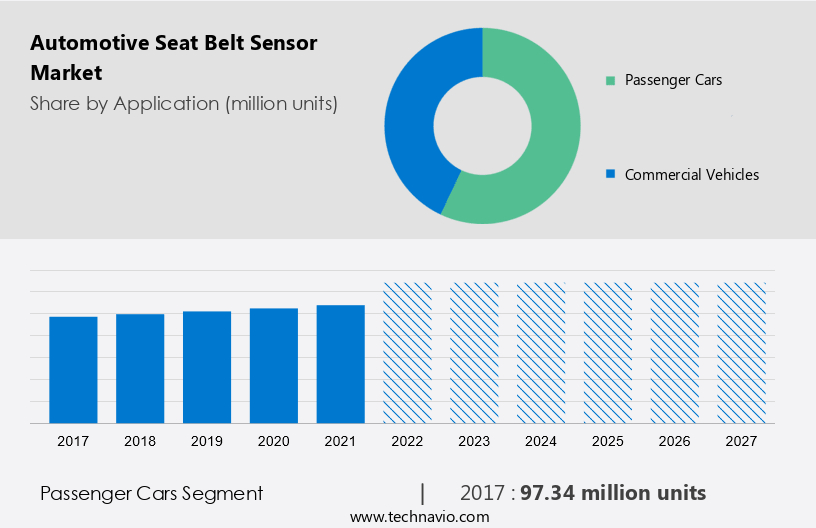
Based on application, the market is segmented into passenger cars and commercial vehicles. The market share growth by the passenger cars segment will be significant during the forecast period. The penetration of passenger cars is expected to grow steadily, and the adoption of seat belt sensors in these vehicles will drive this market during the forecast period. The passenger cars segment is expected to record higher growth than the commercial vehicles segment during the forecast period. Rapid electrification in passenger cars resulted in the adoption of new technologies that increased the comfort and safety of drivers. Seat belt sensors were earlier limited to luxury cars and later entered mid-segment vehicles over the last few years, thereby resulting in an increase in volume. Additionally, the NCAP star rating is motivating manufacturers to equip safety features in passenger cars.

Automotive Seat Belt Sensor Market Size

Get a glance at the market contribution of various segments  Request a PDF Sample

The passenger car segment shows a gradual increase in the market share of 97.34 million units in 2017 and will continue to grow by 2021The rising adoption of premium vehicles is crucial for the market because they contribute high revenue owing to the adoption of advanced safety features in the vehicles. The customer pays the premium price for the added benefits, which boost his or her social status, comfort, and safety. Moreover, the increase in disposable incomes is fueling the adoption of luxury cars. Hence, the increased penetration of luxury cars will push revenue growth for the global passenger car seat belt sensor market during the forecast period.

Which are the Key Regions for the Automotive Seat Belt Sensor Market?

Automotive Seat Belt Sensor Market Share by Geography

For more insights on the market share of various regions Request PDF Sample now!

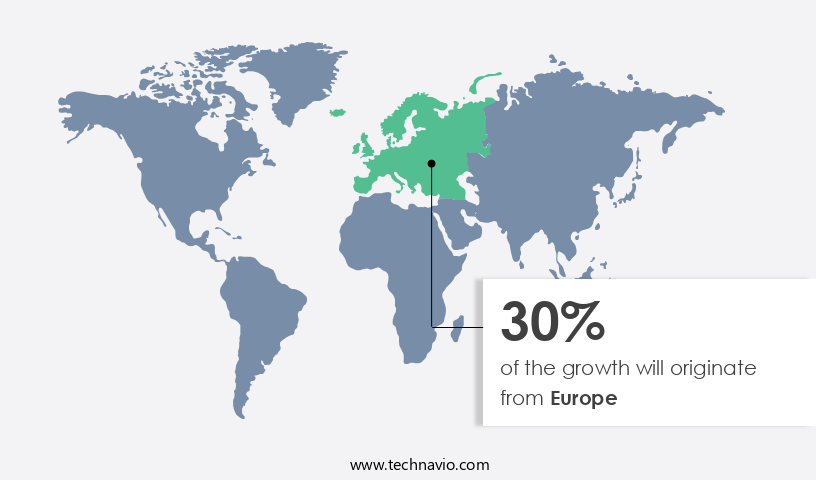
Europe is projected to contribute 30% by 2023. Technavio's analysts have elaborately explained the regional trends and drivers that shape the market during the forecast period.

The rapid penetration of seat belt sensors in Europe, owing to the region's car market standardizing the product in several car variants, will make Europe one of the leading contributors. Further, Europe is home to several high-end passenger cars, such as Mercedes and accounts for the top leaders in cars equipped with seat belt sensor systems. With improving car sales in the Eurozone and increased traction among the OEMs in equipping vehicles with seat belt sensor systems, we expect business prospects for the uptake of such systems to improve during the forecast period.

Following the outbreak of COVID-19, Europe's automobile industry faced widespread production losses, as factories were shut down as per the lockdown protocols. However, in 2021, with the marked decline in the number of COVID-19 cases following the rising vaccination rate, players in the European automobile industry restarted their investment and production activities in the region. This has positively impacted the sales of various automobile players. Thus, the growth in automobile sales, new product launches, the electrification of vehicles, and government initiatives for electric vehicles will drive the use of seat belts and, in turn, automotive seat belt sensors during the forecast period.

Segment Overview

The market research report provides comprehensive data (region wise segment analysis), with forecasts and estimates in "USD Million" for the period 2023 to 2027, as well as historical data from 2017 to 2022 for the following segments.

  • Application Outlook
    • Passenger cars
    • Commercial vehicles
  • Type Outlook
    • Two-point seat belt 
    • Three-point seat belt
    • Four-point seat belt
  • Region Outlook
    • Europe
      • U.K.
      • Germany
      • France
      • Rest of Europe
    • APAC
      • China
      • India
    • North America
      • The U.S.
      • Canada
    • South America
      • Brazil
      • Argentina
    • Middle East & Africa
      • Saudi Arabia
      • South Africa
      • Rest of the Middle East & Africa

You may also interested in below market reports:

1. Automotive Active Seat Belt System Market Analysis APAC, Europe, North America, Middle East and Africa, South America - China, US, Germany, Japan, UK - Size and Forecast

2. Automotive Passive Safety System Market Analysis APAC, Europe, North America, Middle East and Africa, South America - US, China, Japan, Germany, UK - Size and Forecast

3. Automotive Active Safety System Market Analysis APAC, Europe, North America, South America, Middle East and Africa - China, US, Germany, Japan, UK - Size and Forecast

Market Analyst Overview

In the automotive industry, seat belt sensors are integral components of advanced safety technologies aimed at enhancing vehicle occupant protection. From sedans to hatchbacks and vans, various vehicle types employ two-point, three-point, and even four-point safety belts to secure passengers during travel. Despite advancements, challenges like counterfeit seat belts and faulty seat belts in the aftermarket segment pose significant safety risks, emphasizing the importance of sourcing from reputable OEMs. Vehicle crash speed is a critical factor influencing the effectiveness of vehicle restraint systems, where occupant detection technologies utilize artificial intelligence and machine learning for precise response mechanisms. Internet of Things (IoT) connectivity enables service providers to monitor and optimize seat belt performance, ensuring compliance and functionality. Innovations such as five-point seat belts further enhance safety standards, particularly in light commercial vehicles and heavy commercial vehicles, where vehicle ownership and safety remain top priorities for automakers and consumers alike.

Market  Scope

Report Coverage

Details

Page number

163

Base year

2022

Historic period

2017 - 2021

Forecast period

2023-2027

Growth momentum & CAGR

Accelerate at a CAGR of 3.78%

Market growth 2023-2027

44.26 million

Market structure

Fragmented

YoY growth 2022-2023(%)

3.49

Regional analysis

Europe, APAC, North America, South America, and Middle East and Africa

Performing market contribution

Europe at 30%

Key countries

US, China, Japan, India, UK, and Germany

Competitive landscape

Leading Companies, Market Positioning of Companies, Competitive Strategies, and Industry Risks

Key companies profiled

Allegro MicroSystems Inc., Amber Valley Developments LLP, Amphenol Corp., Aptiv, CTS Corp., Hesham Industrial Solutions, IEE International Electronics and Engineering S.A., InterMotive Inc., Littelfuse Inc., Lockliv Holdings Pty Ltd., Olea Systems Inc., Reed Relays and Electronics India Ltd., Securon (Amersham) LTD, Standex Electronics Inc., TE Connectivity Ltd., Wenzhou Far Europe Automobile Safety System Co. Ltd., and ZF Friedrichshafen AG

Market dynamics

Parent market analysis, Market forecasting growth inducers and obstacles, Fast-growing and slow-growing segment analysis, Market growth and Forecasting, COVID 19 impact and recovery analysis and future consumer dynamics, Market condition analysis for forecast period

Customization purview

If our market report has not included the data that you are looking for, you can reach out to our analysts and get segments customized.

Request PDF sample

What are the Key Data Covered in this Market Forecast Report?

  • CAGR of the market during the forecast period
  • Detailed information on factors that will drive the market growth and forecasting of the market between 2023 and 2027
  • Precise estimation of the market size and its contribution to the parent market
  • Accurate predictions about upcoming market trends and analysis and changes in consumer behavior
  • Growth of the market across Europe, North America, APAC, South America, and Middle East and Africa
  • Thorough market growth analysis of the market's competitive landscape and detailed information about companies
  • Comprehensive market analysis and report on the factors that will challenge the market research and growth of market companies

We can help! Our analysts can customize this market research report to meet your requirements. Get in touch

1 Executive Summary

  • 1.1 Market overview
    • Exhibit 01: Executive Summary – Chart on Market Overview
    • Exhibit 02: Executive Summary – Data Table on Market Overview
    • Exhibit 03: Executive Summary – Chart on Global Market Characteristics
    • Exhibit 04: Executive Summary – Chart on Market by Geography
    • Exhibit 05: Executive Summary – Chart on Market Segmentation by Application
    • Exhibit 06: Executive Summary – Chart on Market Segmentation by Type
    • Exhibit 07: Executive Summary – Chart on Incremental Growth
    • Exhibit 08: Executive Summary – Data Table on Incremental Growth
    • Exhibit 09: Executive Summary – Chart on Vendor Market Positioning

2 Market Landscape

  • 2.1 Market ecosystem
    • Exhibit 10: Parent market
    • Exhibit 11: Market Characteristics

3 Market Sizing

  • 3.1 Market definition
    • Exhibit 12: Offerings of vendors included in the market definition
  • 3.2 Market segment analysis
    • Exhibit 13: Market segments
  • 3.3 Market size 2022
    • 3.4 Market outlook: Forecast for 2022-2027
      • Exhibit 14: Chart on Global - Market size and forecast 2022-2027 (million units)
      • Exhibit 15: Data Table on Global - Market size and forecast 2022-2027 (million units)
      • Exhibit 16: Chart on Global Market- Year-over-year growth 2022-2027 (%)
      • Exhibit 17: Data Table on Global Market- Year-over-year growth 2022-2027 (%)

    4 Historic Market Size

    • 4.1 Global automotive seat belt sensor market 2017 - 2021
      • Exhibit 18: Historic Market Size – Data Table on Global automotive seat belt sensor market 2017 - 2021 (million units)
    • 4.2 Application Segment Analysis 2017 - 2021
      • Exhibit 19: Historic Market Size – Application Segment 2017 - 2021 (million units)
    • 4.3 Type Segment Analysis 2017 - 2021
      • Exhibit 20: Historic Market Size – Type Segment 2017 - 2021 (million units)
    • 4.4 Geography Segment Analysis 2017 - 2021
      • Exhibit 21: Historic Market Size – Geography Segment 2017 - 2021 (million units)
    • 4.5 Country Segment Analysis 2017 - 2021
      • Exhibit 22: Historic Market Size – Country Segment 2017 - 2021 (million units)

    5 Five Forces Analysis

    • 5.1 Five forces summary
      • Exhibit 23: Five forces analysis - Comparison between 2022 and 2027
    • 5.2 Bargaining power of buyers
      • Exhibit 24: Chart on Bargaining power of buyers – Impact of key factors 2022 and 2027
    • 5.3 Bargaining power of suppliers
      • Exhibit 25: Bargaining power of suppliers – Impact of key factors in 2022 and 2027
    • 5.4 Threat of new entrants
      • Exhibit 26: Threat of new entrants – Impact of key factors in 2022 and 2027
    • 5.5 Threat of substitutes
      • Exhibit 27: Threat of substitutes – Impact of key factors in 2022 and 2027
    • 5.6 Threat of rivalry
      • Exhibit 28: Threat of rivalry – Impact of key factors in 2022 and 2027
    • 5.7 Market condition
      • Exhibit 29: Chart on Market condition - Five forces 2022 and 2027

    6 Market Segmentation by Application

    • 6.1 Market segments
      • Exhibit 30: Chart on Application - Market share 2022-2027 (%)
      • Exhibit 31: Data Table on Application - Market share 2022-2027 (%)
    • 6.2 Comparison by Application
      • Exhibit 32: Chart on Comparison by Application
      • Exhibit 33: Data Table on Comparison by Application
    • 6.3 Passenger cars - Market size and forecast 2022-2027
      • Exhibit 34: Chart on Passenger cars - Market size and forecast 2022-2027 (million units)
      • Exhibit 35: Data Table on Passenger cars - Market size and forecast 2022-2027 (million units)
      • Exhibit 36: Chart on Passenger cars - Year-over-year growth 2022-2027 (%)
      • Exhibit 37: Data Table on Passenger cars - Year-over-year growth 2022-2027 (%)
    • 6.4 Commercial vehicles - Market size and forecast 2022-2027
      • Exhibit 38: Chart on Commercial vehicles - Market size and forecast 2022-2027 (million units)
      • Exhibit 39: Data Table on Commercial vehicles - Market size and forecast 2022-2027 (million units)
      • Exhibit 40: Chart on Commercial vehicles - Year-over-year growth 2022-2027 (%)
      • Exhibit 41: Data Table on Commercial vehicles - Year-over-year growth 2022-2027 (%)
    • 6.5 Market opportunity by Application
      • Exhibit 42: Market opportunity by Application (million units)

    7 Market Segmentation by Type

    • 7.1 Market segments
      • Exhibit 43: Chart on Type - Market share 2022-2027 (%)
      • Exhibit 44: Data Table on Type - Market share 2022-2027 (%)
    • 7.2 Comparison by Type
      • Exhibit 45: Chart on Comparison by Type
      • Exhibit 46: Data Table on Comparison by Type
    • 7.3 Two point seat belt - Market size and forecast 2022-2027
      • Exhibit 47: Chart on Two point seat belt - Market size and forecast 2022-2027 (million units)
      • Exhibit 48: Data Table on Two point seat belt - Market size and forecast 2022-2027 (million units)
      • Exhibit 49: Chart on Two point seat belt - Year-over-year growth 2022-2027 (%)
      • Exhibit 50: Data Table on Two point seat belt - Year-over-year growth 2022-2027 (%)
    • 7.4 Three point seat belt - Market size and forecast 2022-2027
      • Exhibit 51: Chart on Three point seat belt - Market size and forecast 2022-2027 (million units)
      • Exhibit 52: Data Table on Three point seat belt - Market size and forecast 2022-2027 (million units)
      • Exhibit 53: Chart on Three point seat belt - Year-over-year growth 2022-2027 (%)
      • Exhibit 54: Data Table on Three point seat belt - Year-over-year growth 2022-2027 (%)
    • 7.5 Four point seat belt - Market size and forecast 2022-2027
      • Exhibit 55: Chart on Four point seat belt - Market size and forecast 2022-2027 (million units)
      • Exhibit 56: Data Table on Four point seat belt - Market size and forecast 2022-2027 (million units)
      • Exhibit 57: Chart on Four point seat belt - Year-over-year growth 2022-2027 (%)
      • Exhibit 58: Data Table on Four point seat belt - Year-over-year growth 2022-2027 (%)
    • 7.6 Market opportunity by Type
      • Exhibit 59: Market opportunity by Type (million units)

    8 Customer Landscape

    • 8.1 Customer landscape overview
      • Exhibit 60: Analysis of price sensitivity, lifecycle, customer purchase basket, adoption rates, and purchase criteria

    9 Geographic Landscape

    • 9.1 Geographic segmentation
      • Exhibit 61: Chart on Market share by geography 2022-2027 (%)
      • Exhibit 62: Data Table on Market share by geography 2022-2027 (%)
    • 9.2 Geographic comparison
      • Exhibit 63: Chart on Geographic comparison
      • Exhibit 64: Data Table on Geographic comparison
    • 9.3 Europe - Market size and forecast 2022-2027
      • Exhibit 65: Chart on Europe - Market size and forecast 2022-2027 (million units)
      • Exhibit 66: Data Table on Europe - Market size and forecast 2022-2027 (million units)
      • Exhibit 67: Chart on Europe - Year-over-year growth 2022-2027 (%)
      • Exhibit 68: Data Table on Europe - Year-over-year growth 2022-2027 (%)
    • 9.4 APAC - Market size and forecast 2022-2027
      • Exhibit 69: Chart on APAC - Market size and forecast 2022-2027 (million units)
      • Exhibit 70: Data Table on APAC - Market size and forecast 2022-2027 (million units)
      • Exhibit 71: Chart on APAC - Year-over-year growth 2022-2027 (%)
      • Exhibit 72: Data Table on APAC - Year-over-year growth 2022-2027 (%)
    • 9.5 North America - Market size and forecast 2022-2027
      • Exhibit 73: Chart on North America - Market size and forecast 2022-2027 (million units)
      • Exhibit 74: Data Table on North America - Market size and forecast 2022-2027 (million units)
      • Exhibit 75: Chart on North America - Year-over-year growth 2022-2027 (%)
      • Exhibit 76: Data Table on North America - Year-over-year growth 2022-2027 (%)
    • 9.6 South America - Market size and forecast 2022-2027
      • Exhibit 77: Chart on South America - Market size and forecast 2022-2027 (million units)
      • Exhibit 78: Data Table on South America - Market size and forecast 2022-2027 (million units)
      • Exhibit 79: Chart on South America - Year-over-year growth 2022-2027 (%)
      • Exhibit 80: Data Table on South America - Year-over-year growth 2022-2027 (%)
    • 9.7 Middle East and Africa - Market size and forecast 2022-2027
      • Exhibit 81: Chart on Middle East and Africa - Market size and forecast 2022-2027 (million units)
      • Exhibit 82: Data Table on Middle East and Africa - Market size and forecast 2022-2027 (million units)
      • Exhibit 83: Chart on Middle East and Africa - Year-over-year growth 2022-2027 (%)
      • Exhibit 84: Data Table on Middle East and Africa - Year-over-year growth 2022-2027 (%)
    • 9.8 UK - Market size and forecast 2022-2027
      • Exhibit 85: Chart on UK - Market size and forecast 2022-2027 (million units)
      • Exhibit 86: Data Table on UK - Market size and forecast 2022-2027 (million units)
      • Exhibit 87: Chart on UK - Year-over-year growth 2022-2027 (%)
      • Exhibit 88: Data Table on UK - Year-over-year growth 2022-2027 (%)
    • 9.9 Germany - Market size and forecast 2022-2027
      • Exhibit 89: Chart on Germany - Market size and forecast 2022-2027 (million units)
      • Exhibit 90: Data Table on Germany - Market size and forecast 2022-2027 (million units)
      • Exhibit 91: Chart on Germany - Year-over-year growth 2022-2027 (%)
      • Exhibit 92: Data Table on Germany - Year-over-year growth 2022-2027 (%)
    • 9.10 China - Market size and forecast 2022-2027
      • Exhibit 93: Chart on China - Market size and forecast 2022-2027 (million units)
      • Exhibit 94: Data Table on China - Market size and forecast 2022-2027 (million units)
      • Exhibit 95: Chart on China - Year-over-year growth 2022-2027 (%)
      • Exhibit 96: Data Table on China - Year-over-year growth 2022-2027 (%)
    • 9.11 US - Market size and forecast 2022-2027
      • Exhibit 97: Chart on US - Market size and forecast 2022-2027 (million units)
      • Exhibit 98: Data Table on US - Market size and forecast 2022-2027 (million units)
      • Exhibit 99: Chart on US - Year-over-year growth 2022-2027 (%)
      • Exhibit 100: Data Table on US - Year-over-year growth 2022-2027 (%)
    • 9.12 Japan - Market size and forecast 2022-2027
      • Exhibit 101: Chart on Japan - Market size and forecast 2022-2027 (million units)
      • Exhibit 102: Data Table on Japan - Market size and forecast 2022-2027 (million units)
      • Exhibit 103: Chart on Japan - Year-over-year growth 2022-2027 (%)
      • Exhibit 104: Data Table on Japan - Year-over-year growth 2022-2027 (%)
    • 9.13 India - Market size and forecast 2022-2027
      • Exhibit 105: Chart on India - Market size and forecast 2022-2027 (million units)
      • Exhibit 106: Data Table on India - Market size and forecast 2022-2027 (million units)
      • Exhibit 107: Chart on India - Year-over-year growth 2022-2027 (%)
      • Exhibit 108: Data Table on India - Year-over-year growth 2022-2027 (%)
    • 9.14 Market opportunity by geography
      • Exhibit 109: Market opportunity by geography (million units)

    10 Drivers, Challenges, and Trends

    • 10.1 Market drivers
      • 10.2 Market challenges
        • 10.3 Impact of drivers and challenges
          • Exhibit 110: Impact of drivers and challenges in 2022 and 2027
        • 10.4 Market trends

          11 Vendor Landscape

          • 11.1 Overview
            • 11.2 Vendor landscape
              • Exhibit 111: Overview on Criticality of inputs and Factors of differentiation
            • 11.3 Landscape disruption
              • Exhibit 112: Overview on factors of disruption
            • 11.4 Industry risks
              • Exhibit 113: Impact of key risks on business

            12 Vendor Analysis

            • 12.1 Vendors covered
              • Exhibit 114: Vendors covered
            • 12.2 Market positioning of vendors
              • Exhibit 115: Matrix on vendor position and classification
            • 12.3 Allegro MicroSystems Inc.
              • Exhibit 116: Allegro MicroSystems Inc. - Overview
              • Exhibit 117: Allegro MicroSystems Inc. - Product / Service
              • Exhibit 118: Allegro MicroSystems Inc. - Key offerings
            • 12.4 Amphenol Corp.
              • Exhibit 119: Amphenol Corp. - Overview
              • Exhibit 120: Amphenol Corp. - Business segments
              • Exhibit 121: Amphenol Corp. - Key news
              • Exhibit 122: Amphenol Corp. - Key offerings
              • Exhibit 123: Amphenol Corp. - Segment focus
            • 12.5 Aptiv
              • Exhibit 124: Aptiv - Overview
              • Exhibit 125: Aptiv - Business segments
              • Exhibit 126: Aptiv - Key offerings
              • Exhibit 127: Aptiv - Segment focus
            • 12.6 CTS Corp.
              • Exhibit 128: CTS Corp. - Overview
              • Exhibit 129: CTS Corp. - Product / Service
              • Exhibit 130: CTS Corp. - Key offerings
            • 12.7 Hesham Industrial Solutions
              • Exhibit 131: Hesham Industrial Solutions - Overview
              • Exhibit 132: Hesham Industrial Solutions - Product / Service
              • Exhibit 133: Hesham Industrial Solutions - Key offerings
            • 12.8 IEE International Electronics and Engineering S.A.
              • Exhibit 134: IEE International Electronics and Engineering S.A. - Overview
              • Exhibit 135: IEE International Electronics and Engineering S.A. - Product / Service
              • Exhibit 136: IEE International Electronics and Engineering S.A. - Key offerings
            • 12.9 InterMotive Inc.
              • Exhibit 137: InterMotive Inc. - Overview
              • Exhibit 138: InterMotive Inc. - Product / Service
              • Exhibit 139: InterMotive Inc. - Key offerings
            • 12.10 Littelfuse Inc.
              • Exhibit 140: Littelfuse Inc. - Overview
              • Exhibit 141: Littelfuse Inc. - Business segments
              • Exhibit 142: Littelfuse Inc. - Key offerings
              • Exhibit 143: Littelfuse Inc. - Segment focus
            • 12.11 Lockliv Holdings Pty Ltd.
              • Exhibit 144: Lockliv Holdings Pty Ltd. - Overview
              • Exhibit 145: Lockliv Holdings Pty Ltd. - Product / Service
              • Exhibit 146: Lockliv Holdings Pty Ltd. - Key offerings
            • 12.12 Olea Systems Inc.
              • Exhibit 147: Olea Systems Inc. - Overview
              • Exhibit 148: Olea Systems Inc. - Product / Service
              • Exhibit 149: Olea Systems Inc. - Key offerings
            • 12.13 Reed Relays and Electronics India Ltd.
              • Exhibit 150: Reed Relays and Electronics India Ltd. - Overview
              • Exhibit 151: Reed Relays and Electronics India Ltd. - Product / Service
              • Exhibit 152: Reed Relays and Electronics India Ltd. - Key offerings
            • 12.14 Securon (Amersham) LTD
              • Exhibit 153: Securon (Amersham) LTD - Overview
              • Exhibit 154: Securon (Amersham) LTD - Product / Service
              • Exhibit 155: Securon (Amersham) LTD - Key offerings
            • 12.15 Standex Electronics Inc.
              • Exhibit 156: Standex Electronics Inc. - Overview
              • Exhibit 157: Standex Electronics Inc. - Product / Service
              • Exhibit 158: Standex Electronics Inc. - Key offerings
            • 12.16 TE Connectivity Ltd.
              • Exhibit 159: TE Connectivity Ltd. - Overview
              • Exhibit 160: TE Connectivity Ltd. - Business segments
              • Exhibit 161: TE Connectivity Ltd. - Key offerings
              • Exhibit 162: TE Connectivity Ltd. - Segment focus
            • 12.17 ZF Friedrichshafen AG
              • Exhibit 163: ZF Friedrichshafen AG - Overview
              • Exhibit 164: ZF Friedrichshafen AG - Business segments
              • Exhibit 165: ZF Friedrichshafen AG - Key news
              • Exhibit 166: ZF Friedrichshafen AG - Key offerings
              • Exhibit 167: ZF Friedrichshafen AG - Segment focus

            13 Appendix

            • 13.1 Scope of the report
              • 13.2 Inclusions and exclusions checklist
                • Exhibit 168: Inclusions checklist
                • Exhibit 169: Exclusions checklist
              • 13.3 Currency conversion rates for US$
                • Exhibit 170: Currency conversion rates for US$
              • 13.4 Research methodology
                • Exhibit 171: Research methodology
                • Exhibit 172: Validation techniques employed for market sizing
                • Exhibit 173: Information sources
              • 13.5 List of abbreviations
                • Exhibit 174: List of abbreviations

              Research Methodology

              Technavio presents a detailed picture of the market by way of study, synthesis, and summation of data from multiple sources. The analysts have presented the various facets of the market with a particular focus on identifying the key industry influencers. The data thus presented is comprehensive, reliable, and the result of extensive research, both primary and secondary.

              INFORMATION SOURCES

              Primary sources

              • Manufacturers and suppliers
              • Channel partners
              • Industry experts
              • Strategic decision makers

              Secondary sources

              • Industry journals and periodicals
              • Government data
              • Financial reports of key industry players
              • Historical data
              • Press releases

              DATA ANALYSIS

              Data Synthesis

              • Collation of data
              • Estimation of key figures
              • Analysis of derived insights

              Data Validation

              • Triangulation with data models
              • Reference against proprietary databases
              • Corroboration with industry experts

              REPORT WRITING

              Qualitative

              • Market drivers
              • Market challenges
              • Market trends
              • Five forces analysis

              Quantitative

              • Market size and forecast
              • Market segmentation
              • Geographical insights
              • Competitive landscape

              Interested in this report?

              Get your sample now to see our research methodology and insights!

              Download Now

              Frequently Asked Questions

              Automotive Seat Belt Sensor market growth will increase by 44.26 mn during 2023-2027.

              The Automotive Seat Belt Sensor market is expected to grow at a CAGR of 3.78% during 2023-2027.

              Automotive Seat Belt Sensor market is segmented by Application( Passenger cars, Commercial vehicles) Type( Two point seat belt, Three point seat belt, Four point seat belt, South America, MEA)

              Allegro MicroSystems Inc., Amber Valley Developments LLP, Amphenol Corp., Aptiv, CTS Corp., Hesham Industrial Solutions, IEE International Electronics and Engineering S.A., InterMotive Inc., Littelfuse Inc., Lockliv Holdings Pty Ltd., Olea Systems Inc., Reed Relays and Electronics India Ltd., Securon (Amersham) LTD, Standex Electronics Inc., TE Connectivity Ltd., Wenzhou Far Europe Automobile Safety System Co. Ltd., ZF Friedrichshafen AG are a few of the key vendors in the Automotive Seat Belt Sensor market.

              Europe will register the highest growth rate of 30% among the other regions. Therefore, the Automotive Seat Belt Sensor market in Europe is expected to garner significant business opportunities for the vendors during the forecast period.

              US, China, Japan, India, UK, Germany

              • Improvising occupant safety across value chainIn an automobile is the driving factor this market.
              • passenger safety has become a primary concern for players across the value chain and has increased the adoption of passive and active safety systems. Automobile manufacturers are focusing on improvising the integration of passive safety systems with active safety systems is the driving factor this market.
              • such as seat belts is the driving factor this market.
              • seat belt sensors is the driving factor this market.
              • seat belt lock engagement is the driving factor this market.
              • and side airbags is the driving factor this market.
              • as they have proven results in reducing the impact of accidents. Passive safety systems such as airbag sensors have become a standard component in every vehicle (especially in developed regions) because of regulatory mandates and increasing consumer awareness of automobile safety. Therefore is the driving factor this market.
              • the safety systems is the driving factor this market.
              • which were once restricted only to premium vehicles is the driving factor this market.
              • were made as standard components in the mass market segment. The inclusion of such safety features in the automobile has sustained the growth levels of the global automotive safety systems market throughout the forecast period. Increasing emphasis on safety systems has resulted in double-digit growth rates in the overall automotive safety systems market. This is also evident from the weightage scale for the EU NCAP rating over the past couple of years. With the increasing emphasis on safety systems is the driving factor this market.
              • we expect more safety systems is the driving factor this market.
              • such as seat belts is the driving factor this market.
              • seat belt sensors is the driving factor this market.
              • airbags is the driving factor this market.
              • and several other enhancements on seat belts is the driving factor this market.
              • such as the active seat belts is the driving factor this market.
              • to be considered as an important fitment in vehicles. Such factors are expected to drive the market in focus during the forecast period. is the driving factor this market.

              The Automotive Seat Belt Sensor market vendors should focus on grabbing business opportunities from the Passenger cars segment as it accounted for the largest market share in the base year.
              RIA - Research AI Assistant
              Ask RIA