Baghouse Filters Market Size 2025-2029
The baghouse filters market size is forecast to increase by USD 540 million at a CAGR of 7% between 2024 and 2029.
- The market is driven by the increasing demand for power and electricity, which in turn necessitates the use of efficient filtration systems to minimize emissions and maintain environmental regulations. Another key trend in the market is the development of high-efficiency filters, which offer improved filtration performance and reduced energy consumption. These challenges include the need for regular maintenance, the cost of filter media replacement, and the potential for filter clogging, which can impact filter performance and overall system efficiency.
- Companies seeking to capitalize on market opportunities must focus on developing innovative filter designs and materials that address these challenges, while also ensuring compliance with stringent environmental regulations. Additionally, collaboration with industry partners and continuous research and development efforts will be crucial for long-term success in the market. However, the market faces challenges in the form of complexities in the design and operation of baghouse dust filters.
What will be the Size of the Baghouse Filters Market during the forecast period?

Explore in-depth regional segment analysis with market size data - historical 2019-2023 and forecasts 2025-2029 - in the full report.
Request Free Sample
- In the dynamic industrial landscape, the market for dust control solutions continues to evolve, driven by the demand for effective particulate removal in various sectors. Pharmaceutical manufacturing, for instance, relies heavily on emission control systems to maintain air quality and ensure product purity. Mining operations and food processing plants also prioritize industrial air filtration to minimize air pollution and meet regulatory requirements. Automatic pulse-jet systems and fabric filter technology are at the forefront of this market, offering high efficiency filtration and sustainable air filtration solutions. Air filtration equipment, including filter media selection and optimization, plays a crucial role in improving air quality and reducing particulate matter.
- Monitoring systems enable real-time air quality assessment, ensuring environmental compliance and maximizing filter performance. Reverse air cleaning and baghouse filter design are essential aspects of industrial dust collection, with filter bags made from advanced materials offering enhanced filtration capabilities. Industrial air purification and cleanroom air filtration services are increasingly in demand, as businesses seek to maintain optimal air quality and minimize downtime. Filter maintenance services are also essential for ensuring the longevity and effectiveness of filtration systems. The market for dust control solutions is diverse, encompassing sectors such as mining, pharmaceuticals, food processing, and fabrication. With a focus on emission control, air quality improvement, and sustainable filtration technologies, this market is poised for continued growth.
How is this Baghouse Filters Industry segmented?
The baghouse filters industry research report provides comprehensive data (region-wise segment analysis), with forecasts and estimates in "USD million" for the period 2025-2029, as well as historical data from 2019-2023 for the following segments.
- Type
- Shaker baghouse filters
- Reverse air baghouse filters
- Pulse jet baghouse filters
- Application
- Woodworking
- Pharmaceuticals
- Cement
- Power generation
- Others
- Material
- Non-woven
- Woven
- Others
- Geography
- North America
- US
- Canada
- Europe
- France
- Germany
- Italy
- UK
- APAC
- China
- India
- Japan
- South America
- Brazil
- Rest of World (ROW)
- North America
By Type Insights
The shaker baghouse filters segment is estimated to witness significant growth during the forecast period. Baghouse filters, a critical component in industrial dust collection systems, have gained significance due to increasing regulatory pressures for cleaner air. These filters employ fabric filters, primarily made of synthetic materials like polyester, to trap airborne particulate matter. Technological advances have led to the development of high-efficiency fabric filters, which can capture finer particles and reduce health risks. Baghouse filters consist of a chamber housing a filter medium, typically tubular bags suspended from horizontal beams. The polluted gas enters the bottom of the chamber and passes through the filter, collecting dust on the inside surface of the bags.
Regulatory bodies set emission standards, necessitating frequent monitoring and maintenance to ensure optimal performance. Automatic pulse-jet cleaning systems have streamlined the cleaning process, reducing downtime. Mining and pharmaceutical industries, among others, heavily rely on baghouse filters for dust control. Reverse-air systems, an alternative design, have gained traction due to their ability to minimize dust re-entrainment. Despite the advantages, maintenance remains a challenge, with accumulated dust requiring regular removal to maintain efficiency.
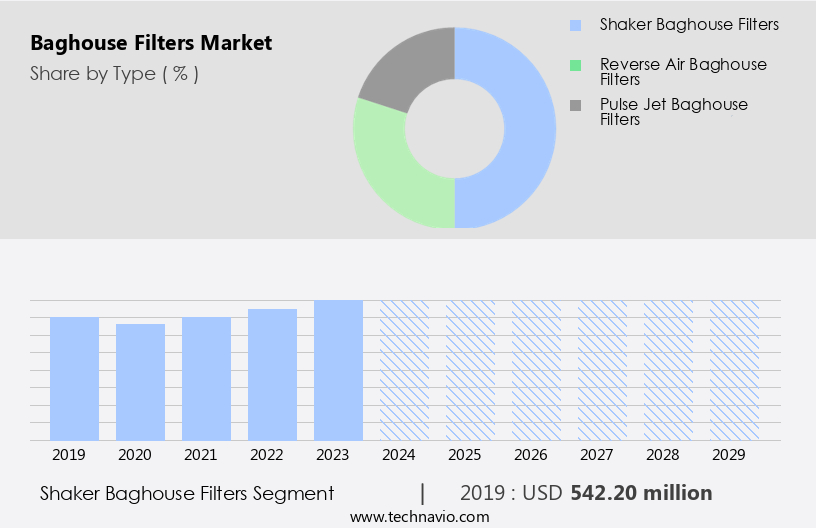
The Shaker baghouse filters segment was valued at USD 542.20 million in 2019 and showed a gradual increase during the forecast period.
The Baghouse Filters Market is expanding as industries prioritize particulate matter control to meet stringent environmental regulations. These filters play a crucial role in air pollution reduction, efficiently capturing dust and contaminants from industrial emissions. Continuous advancements in filter performance optimization enhance efficiency, ensuring maximum dust collection and reduced emissions. The selection of filter materials influences durability and filtration effectiveness, driving innovation in high-efficiency fabric technologies. Advanced air quality monitoring systems integrate with baghouse filters to ensure compliance and real-time performance tracking.
Regional Analysis
APAC is estimated to contribute 57% to the growth of the global market during the forecast period. Technavio's analysts have elaborately explained the regional trends and drivers that shape the market during the forecast period.

In the market, regulatory pressures to maintain clean air quality drive the demand for effective dust collection systems. Baghouse filters, specifically high-efficiency fabric filters, play a crucial role in capturing airborne particulate matter and ensuring compliance with emission standards. Technological advances, such as automatic pulse-jet cleaning systems and reverse-air designs, enhance filter efficiency and reduce maintenance downtime. Manufacturing facilities in industries like mining, cement, and power generation, which produce large amounts of dust, are major consumers of baghouse filters.
These industries are particularly prevalent in countries like China, India, and Japan, where the growth of industries and associated pollution levels are increasing the demand for baghouse filters. The use of synthetic materials like polyester in filter bags and the ability to handle finer particles contribute to the market's growth. The pharmaceutical industry also utilizes baghouse filters for dust collection, further expanding the market's scope. This market caters to various industries, including food processing, pharmaceuticals, mining, and cleanroom applications, among others.
Market Dynamics
Our researchers analyzed the data with 2024 as the base year, along with the key drivers, trends, and challenges. A holistic analysis of drivers will help companies refine their marketing strategies to gain a competitive advantage.
What are the Baghouse Filters market drivers leading to the rise in the adoption of Industry?
- The primary factor fueling market growth is the rising demand for power and electricity, which necessitates an increase in supply and production capacity. The electricity sector's expansion, driven by the increasing demand for electricity in heating applications and the proliferation of connected devices, has led to a rise in coal usage for power generation. Coal is a significant energy source for electricity production in countries like the US, China, and India. According to the International Energy Agency (IEA), China's coal-fired power generation grew by 4% in 2023 compared to 2020 due to the rise in electricity demand. Similarly, India's coal-fired electricity generation increased by 13% in 2023 from the previous year. To ensure the health and safety of workers and the environment, it's crucial to monitor and control the emission of particulate matter during coal combustion.
- Baghouse filters, specifically automatic pulse-jet filters, are an effective solution for removing particulate matter from the exhaust gases. These filters consist of a chamber filled with filter media, such as fabric or felt, that traps the particles as the exhaust passes through. The filters are periodically cleaned using a pulse of compressed air to dislodge the accumulated particles, ensuring optimal filtration efficiency. Manufacturing facilities that rely on coal-fired power generation can benefit significantly from implementing baghouse filters to maintain a cleaner and healthier work environment and adhere to environmental regulations.
What are the Baghouse Filters market trends shaping the Industry?
- High-efficiency filters are currently a significant market trend, with increasing demand for advanced filtration systems due to their superior performance and energy savings. The development and implementation of these filters represent a key innovation in various industries, including water treatment, HVAC systems, and manufacturing processes. Baghouse filters, a crucial component of air pollution control systems, are essential for the efficient collection and removal of particulate matter from industrial processes. The choice of appropriate filters and system parameters significantly impacts the baghouse's performance and lifespan.
- The ease of maintenance, with easy-access doors, makes them a preferred choice over other dust collectors. Compliance with emission standards necessitates the use of finer filter media, often made of synthetic materials like polyester. Advanced high-efficiency fabric filters, such as ultra-flow baghouse filters, are gaining popularity due to their self-cleaning technology and improved design. These filters use powerful reverse blasts of compressed air to inflate the filter bags, causing the dust cake to fall outside the bag and into the hopper.
How does Baghouse Filters market face challenges during its growth?
- The intricacies of baghouse dust filters' design and operation pose a significant challenge to the industry's growth, requiring continuous innovation and expertise to ensure efficient and effective dust collection and minimization of maintenance costs and downtime. Baghouse filters play a vital role in various manufacturing and processing industries, including mining and pharmaceuticals, by collecting dust particles from exhaust gases. Technological advances have led to the development of high-efficiency fabric filters, such as high-efficiency particulate air (HEPA) filters and synthetic materials like polyester.
- Effective design solutions for these challenges can help minimize maintenance downtime and ensure optimal filter performance. However, the market faces challenges that require careful attention. One issue is the use of undersized filters, which can lead to increased airflow and a vacuum inside the filter, potentially causing clogging and failure. Inlet design is another critical factor, as an inadequately designed inlet can result in uneven airflow distribution, causing dust build-up on filter bags and necessitating frequent replacement.
Exclusive Customer Landscape
The baghouse filters market forecasting report includes the adoption lifecycle of the market, covering from the innovator's stage to the laggard's stage. It focuses on adoption rates in different regions based on penetration. Furthermore, the baghouse filters market report also includes key purchase criteria and drivers of price sensitivity to help companies evaluate and develop their market growth analysis strategies.

Customer Landscape
Key Companies & Market Insights
Companies are implementing various strategies, such as strategic alliances, baghouse filters market forecast, partnerships, mergers and acquisitions, geographical expansion, and product/service launches, to enhance their presence in the industry.
AGET Manufacturing Co. - The company specializes in Baghouse Filters, with FH Series After Filters, a type of baghouse filter, serving various industries, including woodworking, metalworking, and more.
The industry research and growth report includes detailed analyses of the competitive landscape of the market and information about key companies, including:
- AGET Manufacturing Co.
- Aircon Corp.
- Airex Industries Inc.
- Amerair Industries LLC
- Baghouse America Inc.
- Camfil AB
- CECO Environmental Corp.
- CPE Filters Inc.
- Daikin Industries Ltd.
- Donaldson Co. Inc.
- Dynavac India Pvt. Ltd.
- Fine Filteration Technology Pvt. Ltd.
- FLSmidth and Co. AS
- Griffin Filters LLC
- Imperial Systems Inc.
- Micronics Filtration LLC
- Parker Hannifin Corp.
- Redlands Manufacturing Company LLC
- Scheuch Industrial Solutions
- Shandong Haihui Environmental Protection Equipment Co. Ltd.
Qualitative and quantitative analysis of companies has been conducted to help clients understand the wider business environment as well as the strengths and weaknesses of key industry players. Data is qualitatively analyzed to categorize companies as pure play, category-focused, industry-focused, and diversified; it is quantitatively analyzed to categorize companies as dominant, leading, strong, tentative, and weak.
Recent Development and News in Baghouse Filters Market
- In January 2024, leading baghouse filter manufacturer, Aerodyne Industries, announced the launch of its innovative, self-cleaning baghouse filter system, "AeroClean," at the Power-Gen International conference. This new product offering aims to reduce downtime and maintenance costs for power plants and cement industries (Aerodyne Industries Press Release, 2024).
- In March 2024, Pall Corporation, a global leader in filtration, entered into a strategic partnership with Clean Air Engineering, a prominent baghouse filter solutions provider. This collaboration aims to expand Pall's presence in the Asian market and strengthen its offerings in the industrial air filtration sector (Pall Corporation Press Release, 2024).
- In May 2024, Donaldson Company, a leading filtration solutions provider, completed the acquisition of Filtration Group, a prominent player in the industrial filtration market. This acquisition significantly expanded Donaldson's product portfolio and market share in the baghouse filters segment (Donaldson Company Press Release, 2024).
- In February 2025, the European Union passed the new Industrial Emissions Directive (IED), which includes stricter regulations on particulate matter emissions. This policy change is expected to boost the demand for advanced baghouse filters in European industries, particularly in power generation and cement manufacturing sectors (European Commission Press Release, 2025).
Research Analyst Overview
The market continues to evolve, driven by regulatory pressures aimed at ensuring clean air and improving public health. Technological advances have led to the development of high-efficiency fabric filters, which can capture even the smallest particles, including those in the sub-micron range. These filters are increasingly being adopted in various sectors, such as manufacturing facilities and mining operations, to meet stringent emission standards. Chamber housing, a critical component of baghouse filters, is being made from advanced materials like polyester to enhance durability and resistance to wear and tear. The use of finer particles and synthetic materials in filter media has also gained popularity due to their superior filtration capabilities.
Monitoring and maintenance of baghouse filters are essential to ensure optimal performance and minimize downtime. Reverse-air systems and automatic pulse-jet cleaning methods have emerged as effective solutions to minimize maintenance requirements and improve overall system efficiency. The pharmaceutical industries, which require stringent cleanliness standards, are also adopting baghouse filters to maintain a controlled environment and prevent contamination. The ongoing unfolding of market activities reveals a dynamic industry where continuous innovation and adaptation to evolving regulations are key to staying competitive.
Dive into Technavio's robust research methodology, blending expert interviews, extensive data synthesis, and validated models for unparalleled Baghouse Filters Market insights. See full methodology.
|
Market Scope |
|
|
Report Coverage |
Details |
|
Page number |
227 |
|
Base year |
2024 |
|
Historic period |
2019-2023 |
|
Forecast period |
2025-2029 |
|
Growth momentum & CAGR |
Accelerate at a CAGR of 7% |
|
Market growth 2025-2029 |
USD 540 million |
|
Market structure |
Fragmented |
|
YoY growth 2024-2025(%) |
6.6 |
|
Key countries |
China, US, India, Japan, Canada, Germany, France, UK, Brazil, and Italy |
|
Competitive landscape |
Leading Companies, Market Positioning of Companies, Competitive Strategies, and Industry Risks |
What are the Key Data Covered in this Baghouse Filters Market Research and Growth Report?
- CAGR of the Baghouse Filters industry during the forecast period
- Detailed information on factors that will drive the growth and forecasting between 2025 and 2029
- Precise estimation of the size of the market and its contribution of the industry in focus to the parent market
- Accurate predictions about upcoming growth and trends and changes in consumer behaviour
- Growth of the market across APAC, North America, Europe, Middle East and Africa, and South America
- Thorough analysis of the market's competitive landscape and detailed information about companies
- Comprehensive analysis of factors that will challenge the baghouse filters market growth of industry companies
We can help! Our analysts can customize this baghouse filters market research report to meet your requirements.
 RIA -
RIA - 
