Pharmaceutical Equipment Market Size 2026-2030
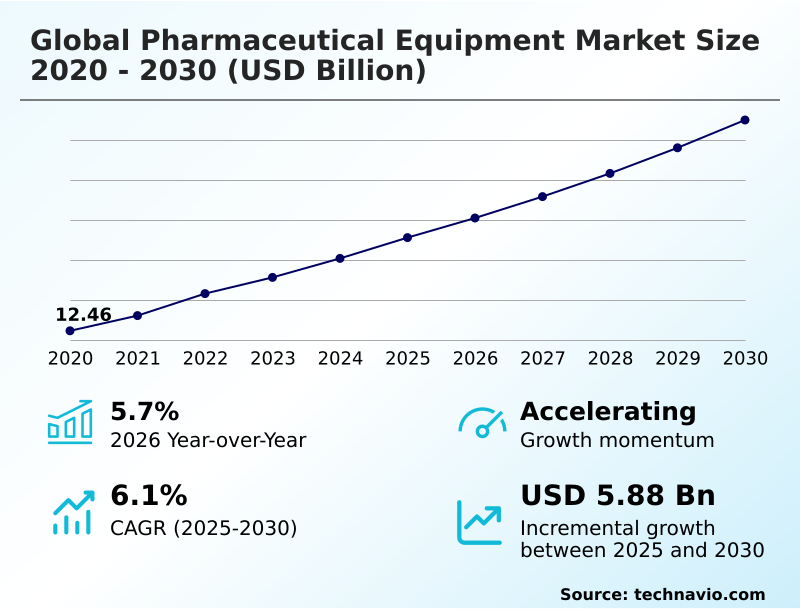
The pharmaceutical equipment market size is valued to increase by USD 5.88 billion, at a CAGR of 6.1% from 2025 to 2030. Rising prevalence of diseases and increasing demand for pharmaceuticals will drive the pharmaceutical equipment market.
Major Market Trends & Insights
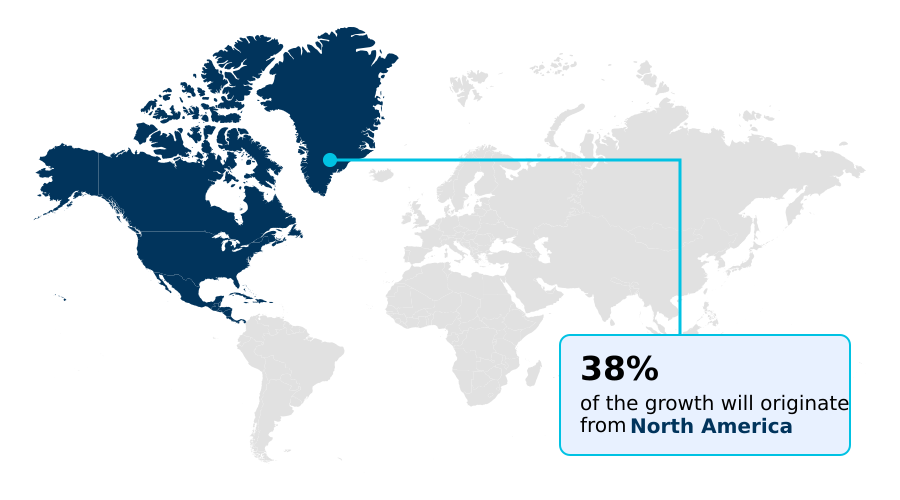
- North America dominated the market and accounted for a 38.3% growth during the forecast period.
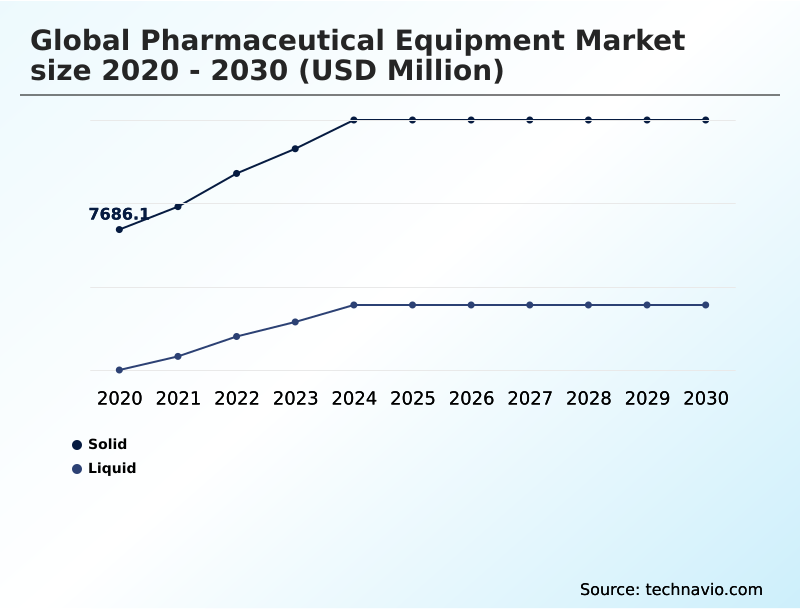
- By Product Type - Solid segment was valued at USD 9.96 billion in 2024
- By Type - Packaging equipment segment accounted for the largest market revenue share in 2024
Market Size & Forecast
- Market Opportunities: USD 10.54 billion
- Market Future Opportunities: USD 5.88 billion
- CAGR from 2025 to 2030 : 6.1%
Market Summary
- The pharmaceutical equipment market is undergoing a significant transformation, driven by the dual pressures of regulatory stringency and the demand for more complex therapeutics. The industry-wide pivot toward continuous manufacturing systems is reshaping production floors, moving away from conventional batch processing to integrated, automated workflows that enhance efficiency and ensure good manufacturing practice (gmp) compliance.
- This shift is critical for companies developing personalized medicines, where smaller, flexible batches are required. For instance, a biopharmaceutical firm launching a new cell therapy must rely on advanced aseptic filling lines and isolator technology to maintain sterility and product integrity, a feat difficult to achieve with legacy systems.
- Simultaneously, pharma 4.0 integration is becoming standard, with digital twin simulation and process analytical technology (pat) enabling predictive quality control and reducing waste.
- As a result, investment decisions are increasingly focused on intelligent, modular equipment that offers scalability, ensures data integrity in pharma manufacturing, and supports the entire lifecycle from lab-scale pharmaceutical equipment to commercial-scale manufacturing, ultimately accelerating time-to-market for critical new drugs.
What will be the Size of the Pharmaceutical Equipment Market during the forecast period?
Get Key Insights on Market Forecast (PDF) Get Free Sample
How is the Pharmaceutical Equipment Market Segmented?
The pharmaceutical equipment industry research report provides comprehensive data (region-wise segment analysis), with forecasts and estimates in "USD million" for the period 2026-2030, as well as historical data from 2020-2024 for the following segments.
- Product type
- Solid
- Liquid
- Type
- Packaging equipment
- Granulating equipment
- Spray drying equipment
- Filing machines
- Others
- Distribution channel
- Offline
- Online
- Geography
- North America
- US
- Canada
- Mexico
- Europe
- Germany
- UK
- France
- Asia
- Rest of World (ROW)
- North America
By Product Type Insights
The solid segment is estimated to witness significant growth during the forecast period.
The solid segment, foundational to oral solid dosage (OSD) forms, is evolving beyond traditional batch methods. Investment is shifting toward integrated systems that combine high-shear mixers and fluid bed granulation with advanced tablet compression machinery.
This pivot addresses the need for greater efficiency in solid dosage manufacturing. Modern roller compaction equipment and micronization equipment are now standard for improving drug bioavailability.
For contract development and manufacturing organization (CDMO) equipment, adherence to good manufacturing practice (gmp) compliance is non-negotiable, driving adoption of machines with built-in data integrity in pharma manufacturing.
Integration of real-time release testing has improved batch consistency by up to 15%, reducing deviations and streamlining equipment validation services for complex excipient handling systems and tablet coating technology.
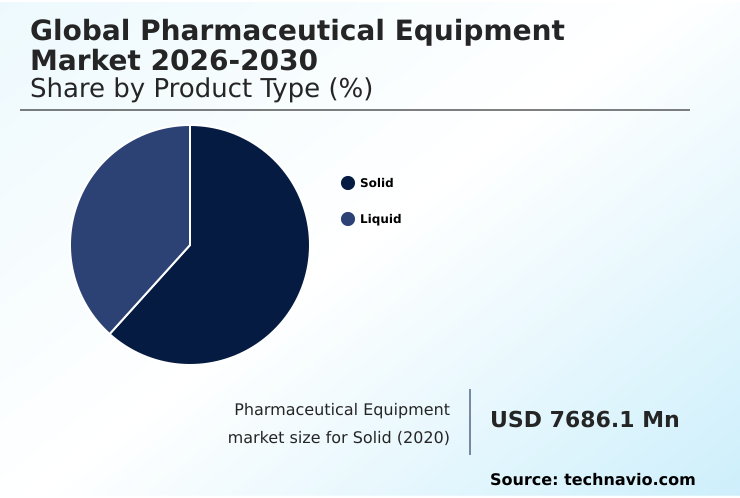
The Solid segment was valued at USD 9.96 billion in 2024 and showed a gradual increase during the forecast period.
Regional Analysis
North America is estimated to contribute 38.3% to the growth of the global market during the forecast period.Technavio’s analysts have elaborately explained the regional trends and drivers that shape the market during the forecast period.
See How Pharmaceutical Equipment Market Demand is Rising in North America Get Free Sample
The geographic landscape is defined by regional specialization. North America leads in incremental growth, contributing 38.3% of the market expansion, driven by investments in advanced biopharmaceutical production and parenteral drug manufacturing. This region pioneers upstream bioprocessing and downstream processing technologies.
In contrast, Asia is the fastest-growing market, with its CAGR outpacing Europe's 5.5% growth rate. Asian hubs are scaling up commercial-scale manufacturing, focusing on high-volume blister packaging machines and automated visual inspection.
Europe remains a center for precision engineering, excelling in aseptic filling lines and pharmaceutical freeze dryers.
Across all regions, the adoption of modular manufacturing facilities is increasing, with digital twin simulation used to optimize layouts for pharmaceutical packaging machinery and improve cleanroom environmental monitoring, leading to a 20% improvement in facility commissioning times for new containment solutions for pharma.
Market Dynamics
Our researchers analyzed the data with 2025 as the base year, along with the key drivers, trends, and challenges. A holistic analysis of drivers will help companies refine their marketing strategies to gain a competitive advantage.
- Strategic decisions in the pharmaceutical equipment market are increasingly centered on technical and operational trade-offs. The debate over continuous manufacturing vs batch processing in pharma hinges on balancing capital investment against long-term efficiency gains. Similarly, the choice between single-use vs stainless steel bioreactors cost analysis is critical for planning bioprocess intensification strategies for efficiency.
- For biologics, aseptic filling for biologics and vaccines requires specialized robotic filling station for ready-to-use components and aseptic transfer port technology for sterile manufacturing. Selecting machinery involves deep analysis of gmp-compliant tablet press selection criteria and methods for optimizing lyophilization cycle times for biologics.
- For solid dosage forms, roller compaction for dry granulation of api is gaining traction, while advancements in spray drying technology for solubility address bioavailability challenges. Key operational hurdles include implementing hpapi containment strategies in pharma facilities and overcoming challenges in sterile powder filling for injectables.
- Integrating pat in pharma manufacturing processes and establishing a pharma 4.0 implementation roadmap for equipment are now essential for competitive production. Other critical areas include deploying effective track and trace solutions for pharmaceutical packaging lines, validating automated cleaning processes in pharma, and utilizing ultrasonic extraction for high-value api recovery.
- The focus is also on equipment for cell and gene therapy production and leveraging modular cleanroom design benefits and considerations for facility agility and real-time release testing for process control.
What are the key market drivers leading to the rise in the adoption of Pharmaceutical Equipment Industry?
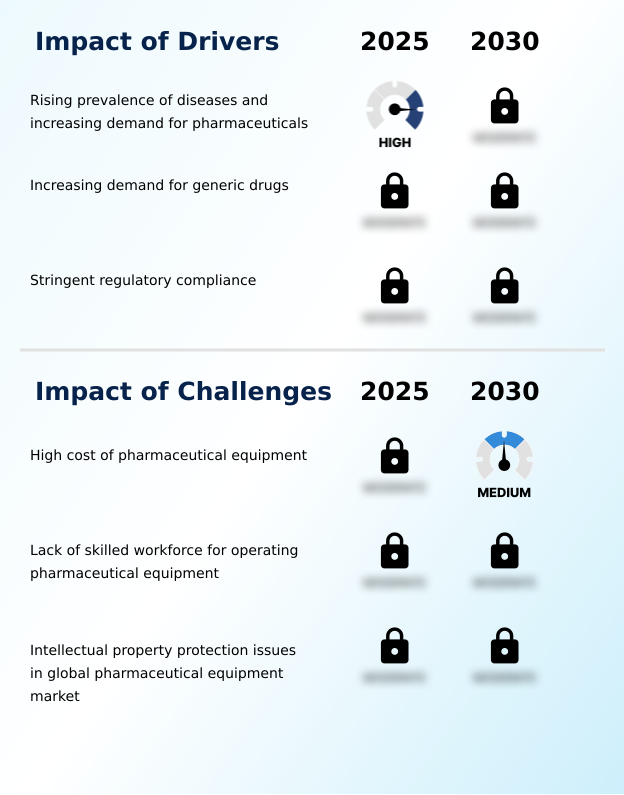
- The rising prevalence of chronic and infectious diseases, coupled with a growing global demand for both novel and generic pharmaceuticals, serves as a fundamental driver for the market.
- Stringent regulatory mandates for good manufacturing practice (gmp) compliance are a primary driver, compelling investment in modern sterile manufacturing solutions.
- The expansion of biopharmaceutical production, particularly for parenteral drug manufacturing, fuels demand for advanced upstream bioprocessing and downstream processing technologies, including high-performance chromatography columns and aseptic filling lines.
- Implementing track and trace serialization systems has improved supply chain security by over 99%. As pipelines for high-potency api (hpapi) handling expand, so does the need for specialized contract development and manufacturing organization (cdmo) equipment.
- These investments are validated by pharmaceutical quality control instruments, with automated vial filling and stoppering systems reducing dosage errors to negligible levels, streamlining equipment validation services.
What are the market trends shaping the Pharmaceutical Equipment Industry?
- Standardization across pharmaceutical equipment is emerging as a critical trend, driven by the need for consistent product quality and simplified regulatory compliance across global manufacturing networks.
- A major trend is the shift toward pharma 4.0 integration, where continuous manufacturing systems are replacing traditional batch processes, improving production efficiency by up to 30%. This transition is supported by process analytical technology (pat) and real-time release testing, enhancing data integrity in pharma manufacturing.
- For advanced therapy medicinal products (atmp) manufacturing, the adoption of single-use bioreactors and flexible manufacturing systems is crucial. The use of isolator technology and restricted access barrier systems (rabs) in aseptic processing technology has reduced contamination events by over 50%.
- Furthermore, digital twin simulation is being employed to model bioprocess intensification and optimize setups for cell and gene therapy equipment before physical implementation.
What challenges does the Pharmaceutical Equipment Industry face during its growth?
- The high capital cost of advanced pharmaceutical equipment presents a significant challenge, particularly for small to mid-sized manufacturers seeking to modernize and scale their operations.
- The high capital outlay for specialized equipment remains a significant challenge. Advanced lyophilization technology and pharmaceutical freeze dryers, essential for biologic stability, require substantial investment, with operational costs for pharmaceutical water systems adding another 15% to facility expenses. The complexity of integrating clean-in-place (cip) systems and sterilization-in-place (sip) systems into automated cleaning systems also poses technical hurdles.
- While modular cleanroom design offers flexibility, upfront costs for modular manufacturing facilities can be prohibitive for startups transitioning from lab-scale pharmaceutical equipment to pilot-scale production equipment. Furthermore, achieving precision in sterile powder filling using advanced syringe filling machines and aseptic transfer port technology demands a highly skilled workforce, which is scarce and increases operational expenses for complex powder handling systems.
Exclusive Technavio Analysis on Customer Landscape
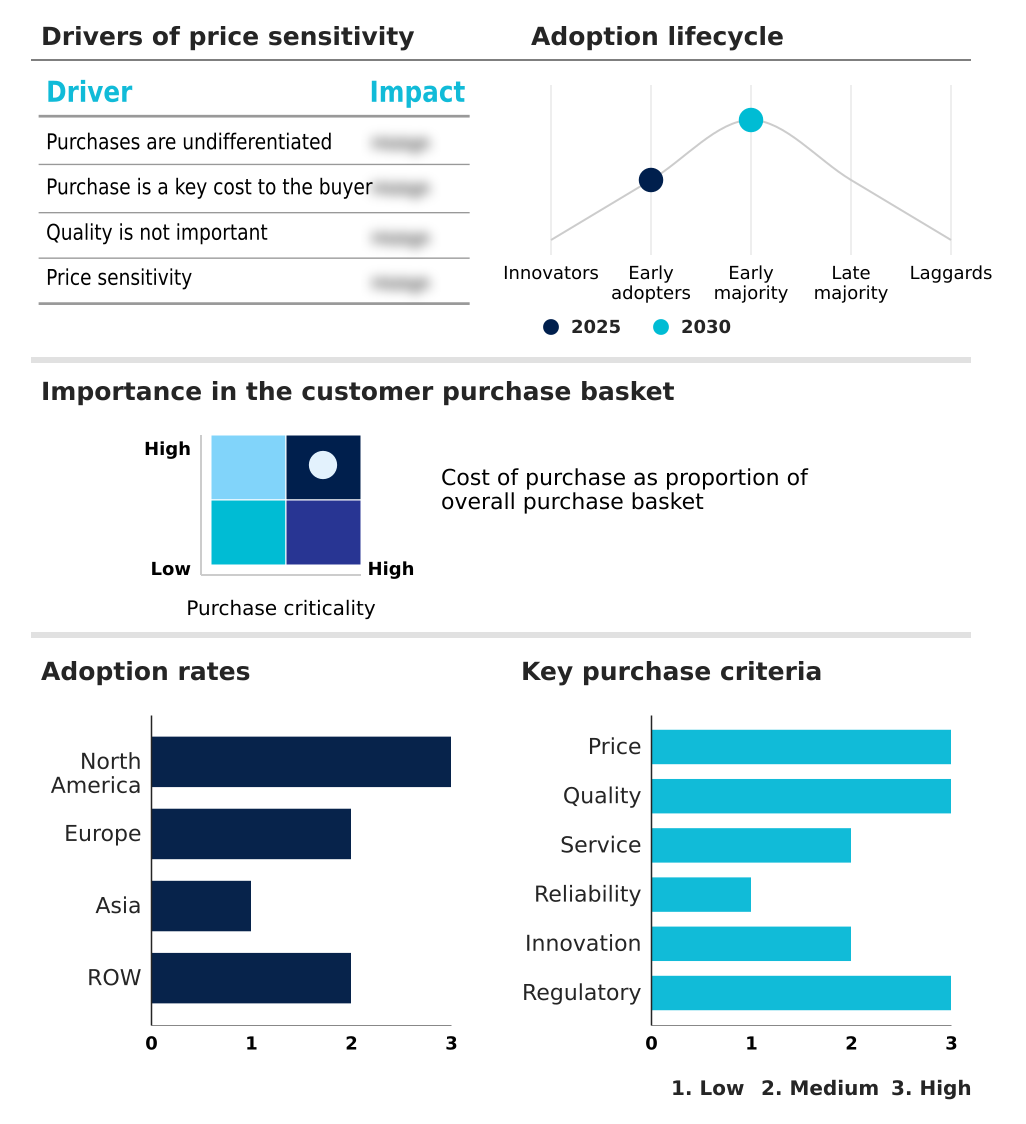
The pharmaceutical equipment market forecasting report includes the adoption lifecycle of the market, covering from the innovator’s stage to the laggard’s stage. It focuses on adoption rates in different regions based on penetration. Furthermore, the pharmaceutical equipment market report also includes key purchase criteria and drivers of price sensitivity to help companies evaluate and develop their market growth analysis strategies.
Customer Landscape of Pharmaceutical Equipment Industry
Competitive Landscape
Companies are implementing various strategies, such as strategic alliances, pharmaceutical equipment market forecast, partnerships, mergers and acquisitions, geographical expansion, and product/service launches, to enhance their presence in the industry.
ACG Group - Delivers integrated solutions, from films and foils to advanced machinery, for efficient tablet manufacturing and packaging processes.
The industry research and growth report includes detailed analyses of the competitive landscape of the market and information about key companies, including:
- ACG Group
- Bausch Stroebel SE Co. KG
- Esco Lifesciences
- Fette Compacting GmbH
- GEA Group AG
- Glatt GmbH
- IDEX MPT
- IKA Werke GmbH and Co. KG
- IMA SpA
- Korber Pharma GmbH
- Marchesini Group SpA
- OPTIMA Packaging Group GmbH
- Pall Corp.
- Romaco Holding GmbH
- Sartorius AG
- SP Industries Inc.
- Syntegon Technology GmbH
- Thermo Fisher Scientific Inc.
- Uhlmann Pac Systeme GmbH Co.
Qualitative and quantitative analysis of companies has been conducted to help clients understand the wider business environment as well as the strengths and weaknesses of key industry players. Data is qualitatively analyzed to categorize companies as pure play, category-focused, industry-focused, and diversified; it is quantitatively analyzed to categorize companies as dominant, leading, strong, tentative, and weak.
Recent Development and News in Pharmaceutical equipment market
- In June 2025, Merck and Siemens collaborated to integrate advanced sensor technology into large-scale bioreactors, enabling enhanced real-time data collection and monitoring for cell culture processes.
- In April 2025, IMA Group upgraded its Prexima 800 series tablet press with advanced ceramic components to reduce heat generation, thereby protecting heat-sensitive active pharmaceutical ingredients during high-volume production cycles.
- In March 2025, IMA SpA formed a strategic partnership to embed machine learning algorithms into its machinery, aiming to offer clients real-time diagnostics and predictive maintenance capabilities.
- In February 2025, Syntegon Technology GmbH launched a modular filling platform that employs advanced robotics for handling sensitive biologics, minimizing human intervention within sterile manufacturing environments.
Dive into Technavio’s robust research methodology, blending expert interviews, extensive data synthesis, and validated models for unparalleled Pharmaceutical Equipment Market insights. See full methodology.
| Market Scope | |
|---|---|
| Page number | 289 |
| Base year | 2025 |
| Historic period | 2020-2024 |
| Forecast period | 2026-2030 |
| Growth momentum & CAGR | Accelerate at a CAGR of 6.1% |
| Market growth 2026-2030 | USD 5881.9 million |
| Market structure | Fragmented |
| YoY growth 2025-2026(%) | 5.7% |
| Key countries | US, Canada, Mexico, Germany, UK, France, Italy, The Netherlands, Spain, Russia, China, India, Japan, South Korea, Indonesia, Thailand, Singapore, Australia, UAE, Brazil, South Africa, Saudi Arabia and Turkey |
| Competitive landscape | Leading Companies, Market Positioning of Companies, Competitive Strategies, and Industry Risks |
Research Analyst Overview
- The pharmaceutical equipment market is advancing beyond mere hardware to integrated, intelligent systems. A primary boardroom focus is on pharma 4.0 integration, where the convergence of technologies like digital twin simulation and process analytical technology (pat) is paramount.
- The shift toward continuous manufacturing systems is driving investment in high-shear mixers and advanced tablet compression machinery, supported by robust powder handling systems and fluid bed granulation for superior consistency. For sterile applications, the combination of aseptic filling lines, isolator technology, and restricted access barrier systems (rabs) is critical for good manufacturing practice (gmp) compliance.
- Innovations in lyophilization technology and pharmaceutical freeze dryers are crucial for biologic stability, while single-use bioreactors offer flexibility in upstream bioprocessing. Key technologies such as high-potency api (hpapi) handling, clean-in-place (cip) systems, and sterilization-in-place (sip) systems are standard. Firms adopting automated visual inspection and real-time release testing have seen a 30% reduction in quality-related rework.
- Downstream processing relies on high-performance chromatography columns, while packaging requires precise blister packaging machines and track and trace serialization. Other vital components include peristaltic pumps, spray drying atomization, roller compaction equipment, vial filling and stoppering systems, micronization equipment, tablet coating technology, and modular cleanroom design with aseptic transfer port technology for containment solutions for pharma, including specialized syringe filling machines.
What are the Key Data Covered in this Pharmaceutical Equipment Market Research and Growth Report?
-
What is the expected growth of the Pharmaceutical Equipment Market between 2026 and 2030?
-
USD 5.88 billion, at a CAGR of 6.1%
-
-
What segmentation does the market report cover?
-
The report is segmented by Product Type (Solid, and Liquid), Type (Packaging equipment, Granulating equipment, Spray drying equipment, Filing machines, and Others), Distribution Channel (Offline, and Online) and Geography (North America, Europe, Asia, Rest of World (ROW))
-
-
Which regions are analyzed in the report?
-
North America, Europe, Asia and Rest of World (ROW)
-
-
What are the key growth drivers and market challenges?
-
Rising prevalence of diseases and increasing demand for pharmaceuticals, High cost of pharmaceutical equipment
-
-
Who are the major players in the Pharmaceutical Equipment Market?
-
ACG Group, Bausch Stroebel SE Co. KG, Esco Lifesciences, Fette Compacting GmbH, GEA Group AG, Glatt GmbH, IDEX MPT, IKA Werke GmbH and Co. KG, IMA SpA, Korber Pharma GmbH, Marchesini Group SpA, OPTIMA Packaging Group GmbH, Pall Corp., Romaco Holding GmbH, Sartorius AG, SP Industries Inc., Syntegon Technology GmbH, Thermo Fisher Scientific Inc. and Uhlmann Pac Systeme GmbH Co.
-
Market Research Insights
- Market dynamics are increasingly shaped by the pursuit of operational efficiency and stringent quality control. The adoption of flexible manufacturing systems has enabled facilities to reduce changeover times by over 40%, a critical advantage for contract development and manufacturing organization (cdmo) equipment providers handling multiple products.
- Concurrently, implementing advanced pharmaceutical quality control instruments has cut batch rejection rates by nearly 25%, directly impacting profitability. Investment in sterile manufacturing solutions and parenteral drug manufacturing technologies reflects the industry's shift toward biologics. This trend is supported by robust equipment validation services that ensure compliance and accelerate market entry.
- The focus on aseptic processing technology and modular manufacturing facilities underscores a strategic move toward adaptable and scalable production models capable of meeting evolving global healthcare demands.
We can help! Our analysts can customize this pharmaceutical equipment market research report to meet your requirements.
 RIA -
RIA - 
