Barite Market Analysis, Size, and Forecast 2026-2030: APAC (China, India, and Japan), North America (US, Canada, and Mexico), Europe (Germany, UK, and France), Middle East and Africa (Saudi Arabia, UAE, and South Africa), South America (Brazil and Argentina), and Rest of World (ROW)

Barite Market Analysis, Size, and Forecast 2026-2030:
APAC (China, India, and Japan), North America (US, Canada, and Mexico), Europe (Germany, UK, and France), Middle East and Africa (Saudi Arabia, UAE, and South Africa), South America (Brazil and Argentina), and Rest of World (ROW)

Published: Mar 2026 296 Pages SKU: IRTNTR73871

Market Overview at a Glance

$368.8 Mn
Market Opportunity
4.1%
CAGR 2025 - 2030
59.9%
APAC Growth
$1.28 B
Powder segment 2024

Barite Market Size 2026-2030

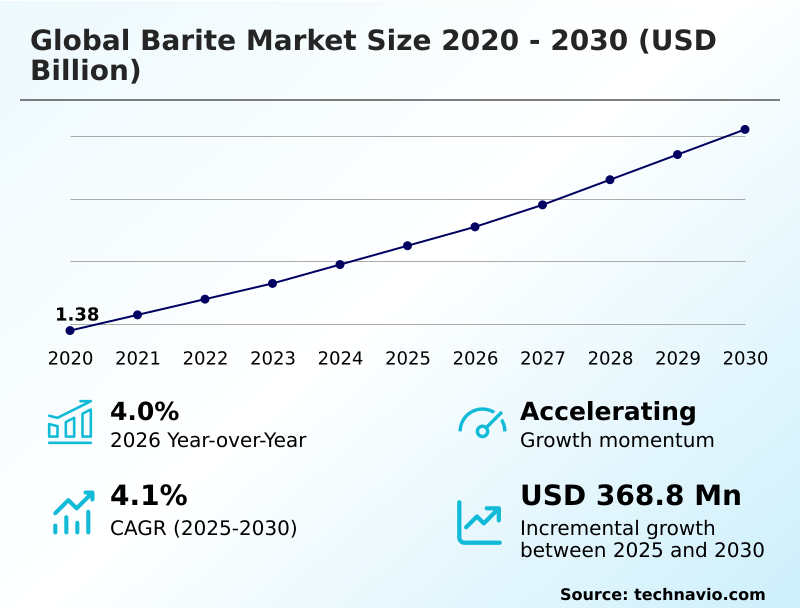
The barite market size is valued to increase by USD 368.8 million, at a CAGR of 4.1% from 2025 to 2030. Increasing demand for oil and gas drilling operations will drive the barite market.

Major Market Trends & Insights

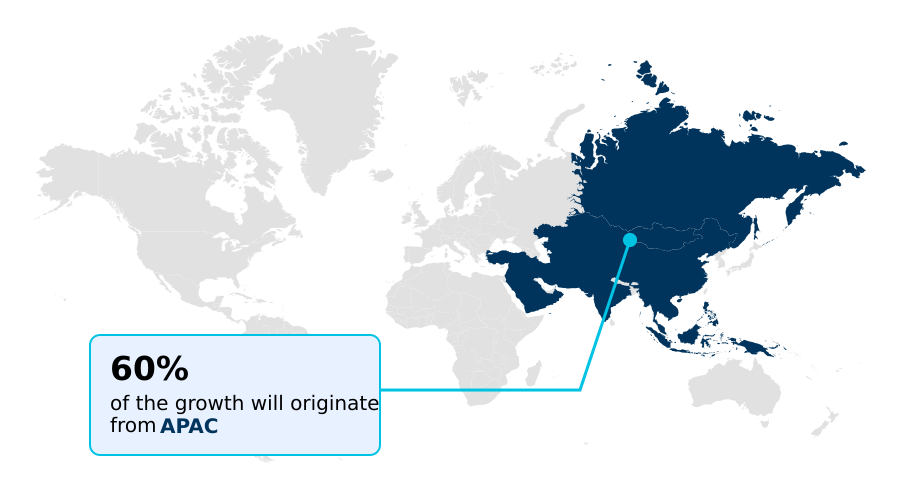
  • APAC dominated the market and accounted for a 59.9% growth during the forecast period.
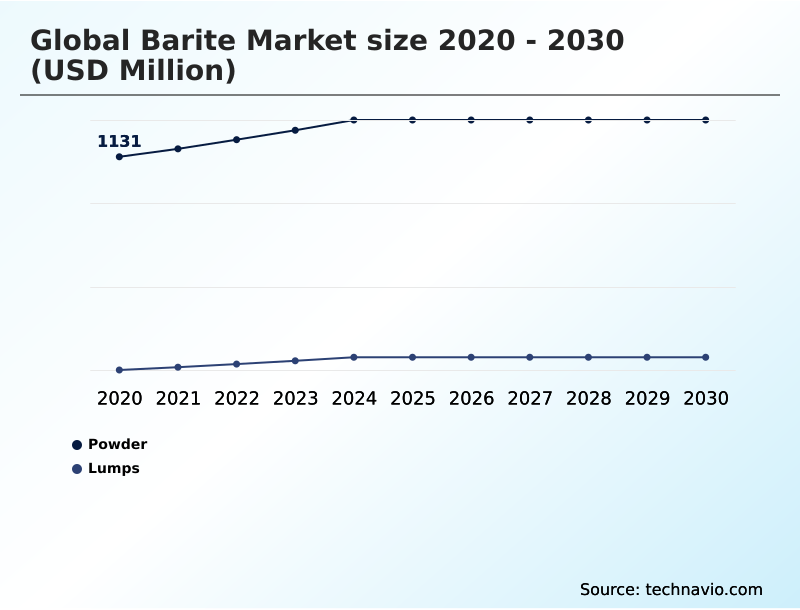
  • By Type - Powder segment was valued at USD 1.28 billion in 2024
  • By End-user - Drilling mud segment accounted for the largest market revenue share in 2024

Market Size & Forecast

  • Market Opportunities: USD 634.4 million
  • Market Future Opportunities: USD 368.8 million
  • CAGR from 2025 to 2030 : 4.1%

Market Summary

  • The barite market is defined by its critical role as a non-substitutable weighting agent in the upstream energy sector. The mineral’s primary function in formation pressure control, a necessity that intensifies as exploration moves into high-pressure environments, requiring high-density drilling fluids.
  • This core demand for energy exploration materials is supplemented by a diverse range of industrial mineral applications where barite is valued as a functional filler additive due to its chemical inertness property. A key trend is the industry's pivot toward a circular economy in mining, with a focus on spent drilling mud recycling.
  • For instance, an operator can implement a closed-loop fluid model, which uses solids control technology to recover api grade barite, reducing the need for virgin material. However, the market faces challenges from fluctuating drilling rig activity, which directly impacts demand, and stringent environmental compliance in mining.
  • The market's reliance on a concentrated mineral processing capacity creates supply chain vulnerabilities tied to maritime logistics and geopolitical trade tensions.

What will be the Size of the Barite Market during the forecast period?

Get Key Insights on Market Forecast (PDF) Request Free Sample

How is the Barite Market Segmented?

The barite industry research report provides comprehensive data (region-wise segment analysis), with forecasts and estimates in "USD million" for the period 2026-2030, as well as historical data from 2020-2024 for the following segments.

  • Type
    • Powder
    • Lumps
  • End-user
    • Drilling mud
    • Chemical manufacturing
    • Paints and coatings
    • Others
  • Grade type
    • Type 1
    • Type 2
    • Type 3
    • Type 4
  • Geography
    • APAC
      • China
      • India
      • Japan
    • North America
      • US
      • Canada
      • Mexico
    • Europe
      • Germany
      • UK
      • France
    • Middle East and Africa
      • Saudi Arabia
      • UAE
      • South Africa
    • South America
      • Brazil
      • Argentina
    • Rest of World (ROW)

By Type Insights

The powder segment is estimated to witness significant growth during the forecast period.

The powder segment dominates the market, serving as a primary upstream energy sector material for ensuring wellbore stability and integrity.

Its application as a key component in energy exploration materials is expanding with advancements in solids control technology and centrifugation systems. These technologies facilitate spent drilling mud recycling, creating a closed-loop fluid model that reduces waste.

The push for sustainability has increased the use of recycled drilling mud, with some operations recovering up to 80% of the mineral content. Beyond energy, the segment supplies crucial chemical manufacturing inputs for industrial mineral applications.

The designation of barite as a critical minerals list component, alongside growing demand for synthetic barium sulfate, further diversifies the segment's growth trajectory.

Request Free Sample

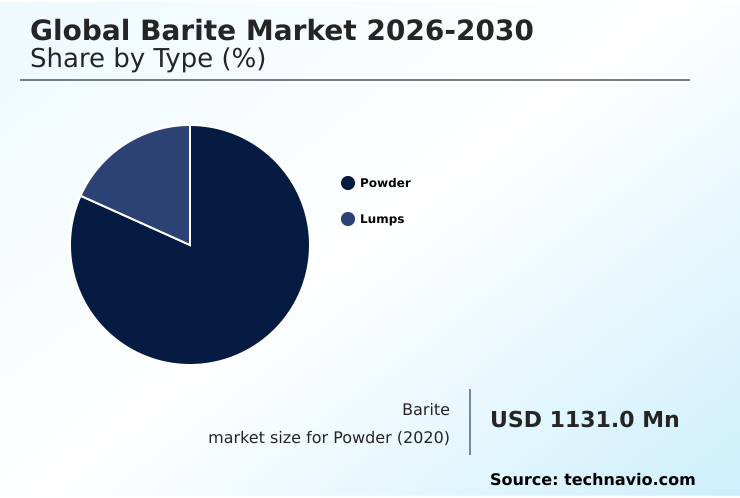
The Powder segment was valued at USD 1.28 billion in 2024 and showed a gradual increase during the forecast period.

Request Free Sample

Regional Analysis

APAC is estimated to contribute 59.9% to the growth of the global market during the forecast period.Technavio’s analysts have elaborately explained the regional trends and drivers that shape the market during the forecast period.

See How Barite Market Demand is Rising in APAC Request Free Sample

The geographic landscape is characterized by concentrated production hubs serving global demand for high-density drilling fluids used in formation pressure control.

Regions with advanced processing capabilities produce micronized barite powder and other high-purity mineral grades essential for controlling drilling mud rheology. These regions have seen a 5.4% uptick in industrial applications.

Beyond drilling, demand is growing for its use as an architectural coatings additive and in sound-dampening insulation.

The mineral's chemical inertness property makes it ideal for specialized applications like radiation shielding concrete for nuclear power facility shielding and in gastrointestinal diagnostics.

Investment in the beneficiation of low-grade ore is expanding, aiming to increase the supply of high-density aggregates and sound-dampening material to meet diverse industrial needs worldwide.

Market Dynamics

Our researchers analyzed the data with 2025 as the base year, along with the key drivers, trends, and challenges. A holistic analysis of drivers will help companies refine their marketing strategies to gain a competitive advantage.

  • Strategic decision-making in the barite market is increasingly influenced by specific end-use requirements and supply chain dynamics. The use of barite in high-temperature drilling fluids is non-negotiable for deepwater oil drilling, where controlling wellbore pressure is paramount. Here, the quality specifications for drilling barite are exceptionally strict, often demanding specific api grade barite to ensure performance.
  • In contrast, using barite for radiation shielding in medical and nuclear facilities relies on its density. As a functional filler, barite for automotive sound dampening and in plastics leverages its weight and inertness. Its application in paints and coatings provides opacity and durability, while its use in chemical manufacturing depends on purity.
  • The growing practice of recycling barite from drilling mud reflects a shift toward sustainability and cost control. This approach has proven more efficient than sourcing from new mines, reducing logistical dependencies by over 50% in some onshore operations.
  • Comparing barite versus alternative weighting agents is a constant analysis for operators, factoring in cost, availability, and the environmental impact of barite mining. The expansion of barite in unconventional shale drilling and the emerging use of barite for geothermal drilling fluids are broadening the mineral's application profile.
  • Finally, understanding the beneficiation process for barite ore is crucial for evaluating supply quality and addressing barite supply chain logistics challenges.

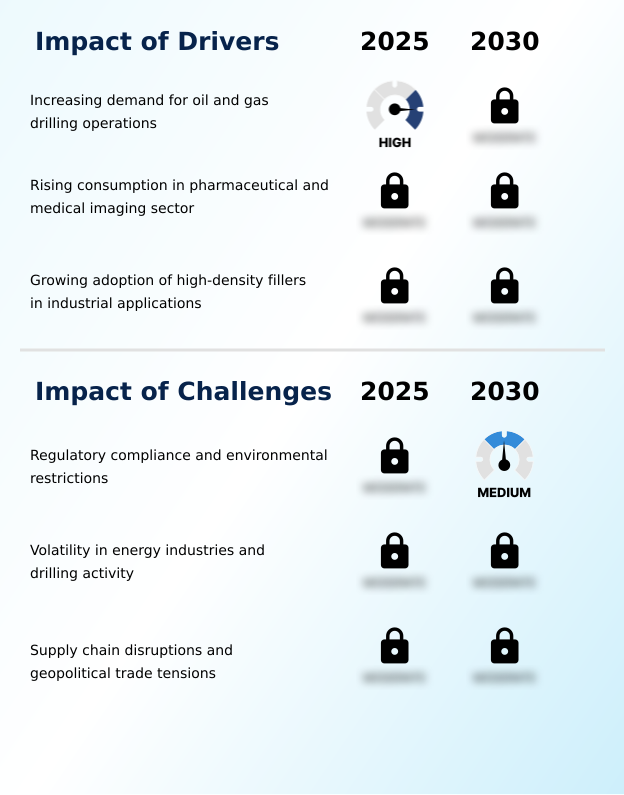
What are the key market drivers leading to the rise in the adoption of Barite Industry?

  • The increasing demand for oil and gas drilling operations, particularly in deepwater and unconventional reserves, serves as a key driver for market growth.

  • The primary driver remains the use of barite as a drilling fluid weighting agent, valued for being a high specific gravity mineral essential for hydrostatic pressure management.
  • Renewed investment in deepwater drilling campaigns and sustained shale gas production require vast quantities of api grade barite for blowout prevention and to ensure wellbore integrity. These operations can improve drilling fluid density by up to 40% in high-pressure zones.
  • Beyond energy, the market is driven by healthcare applications, where a specific barium sulfate formulation acts as a radiopaque contrast agent in medical imaging contrast procedures, which have seen a 5% increase in annual volume.
  • Additionally, its role as a versatile industrial filler additive in manufacturing continues to expand, providing a stable secondary demand driver.

What are the market trends shaping the Barite Industry?

  • The increasing complexity of deepwater and ultra-deepwater energy exploration is a primary trend shaping the market. This shift necessitates advanced materials to manage challenging drilling environments.

  • Market trends are increasingly shaped by the adoption of circular economy in mining principles, focusing on the recovery of materials from spent fluids. Innovations in solids control systems enable the reuse of barite that meets api specification 13a, reducing waste by as much as 80%.
  • Concurrently, demand is growing for the mineral's unique properties like gamma ray absorption and x-ray absorption shielding, making it vital for radiation protection materials in new oncological facility construction. In industrial sectors, barite serves as a functional extender in coatings and a low oil absorption filler.
  • Its use in automotive friction materials and as heavy-weight aggregates highlights its versatility beyond the energy sector, although geopolitical trade tensions are compelling companies toward greater supply chain diversification.

What challenges does the Barite Industry face during its growth?

  • Stringent regulatory compliance standards and environmental restrictions on exploration and mining activities present a key challenge affecting industry growth.

  • Market challenges are tied to fluctuating drilling rig activity and complex maritime logistics, which impact the supply of this deepwater exploration mineral. As a critical subsea drilling component and offshore well control agent, its role as a non-substitutable weighting agent creates supply pressures.
  • For oilfield service companies, ensuring consistent drilling fluid composition for unconventional gas drilling and HPHT drilling is a constant challenge. Stricter environmental compliance in mining is increasing operational costs, while limited mineral processing capacity in certain regions requires companies to rely on strategic mineral stockpiling.
  • Even in specialty sectors, producing pharmaceutical-grade barium sulfate consistently presents technical and regulatory hurdles, with compliance adding 15-20% to production costs.

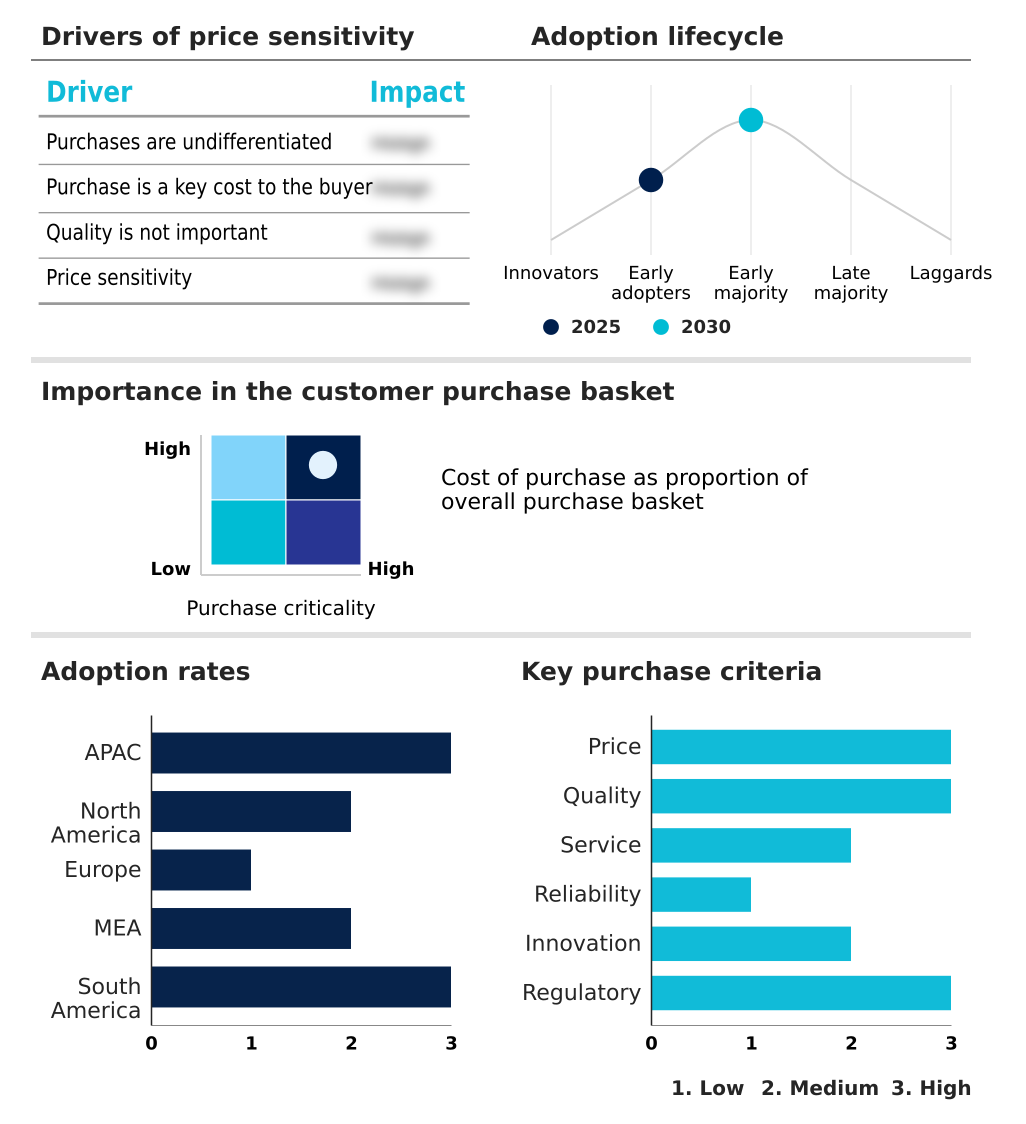
Exclusive Technavio Analysis on Customer Landscape

The barite market forecasting report includes the adoption lifecycle of the market, covering from the innovator’s stage to the laggard’s stage. It focuses on adoption rates in different regions based on penetration. Furthermore, the barite market report also includes key purchase criteria and drivers of price sensitivity to help companies evaluate and develop their market growth analysis strategies.

Customer Landscape of Barite Industry

Competitive Landscape

Companies are implementing various strategies, such as strategic alliances, barite market forecast, partnerships, mergers and acquisitions, geographical expansion, and product/service launches, to enhance their presence in the industry.

ADO Mining - Specializing in the provision of barite aggregates and ground industrial minerals, the portfolio supports diverse applications requiring specific density and composition.

The industry research and growth report includes detailed analyses of the competitive landscape of the market and information about key companies, including:

  • ADO Mining
  • Akrochem Corp.
  • Arvind Minerals
  • Ashapura Microns LLP
  • China zhashui heqi barite mining
  • CIMBAR RESOURCES INC.
  • Gimpex Pvt Ltd
  • Ishtar Company LLC
  • J and H Minerals Pvt. Ltd.
  • JAM GROUP CO
  • Polaris mining
  • PVS Global Trade Pvt. Ltd.
  • RUA GROUP
  • Sachtleben Minerals GmbH and Co
  • SCR Sibelco NV
  • Sinobarite Industrials Ltd.
  • SNDB
  • Trimex Group
  • Vishnu Chemicals Ltd.
  • Yingfengyuan Industrial Group

Qualitative and quantitative analysis of companies has been conducted to help clients understand the wider business environment as well as the strengths and weaknesses of key industry players. Data is qualitatively analyzed to categorize companies as pure play, category-focused, industry-focused, and diversified; it is quantitatively analyzed to categorize companies as dominant, leading, strong, tentative, and weak.

Recent Development and News in Barite market

  • In August 2024, the Oil and Natural Gas Corp. Ltd. (ONGC) initiated a major deepwater project in the Krishna Godavari Basin, significantly increasing regional demand for API-grade barite.
  • In January 2025, SLB launched a new drilling fluid recycling facility in the Permian Basin to recover and reuse barite from spent drilling muds in active operations.
  • In March 2025, Cimbar Performance Minerals formed a strategic partnership with ChemSpec Canada to enhance the distribution of its performance minerals, including barium sulfate, throughout the Canadian market.
  • In May 2025, TotalEnergies' GranMorgu project in Suriname achieved a key construction milestone, signaling an upcoming intensive drilling phase requiring substantial volumes of high-performance drilling fluids.

Dive into Technavio’s robust research methodology, blending expert interviews, extensive data synthesis, and validated models for unparalleled Barite Market insights. See full methodology.

Market Scope
Page number 296
Base year 2025
Historic period 2020-2024
Forecast period 2026-2030
Growth momentum & CAGR Accelerate at a CAGR of 4.1%
Market growth 2026-2030 USD 368.8 million
Market structure Fragmented
YoY growth 2025-2026(%) 4.0%
Key countries China, India, Japan, South Korea, Australia, Indonesia, US, Canada, Mexico, Germany, UK, France, Italy, Spain, The Netherlands, Saudi Arabia, UAE, South Africa, Turkey, Israel, Brazil, Argentina and Chile
Competitive landscape Leading Companies, Market Positioning of Companies, Competitive Strategies, and Industry Risks

Request Free Sample

Research Analyst Overview

  • The market is anchored by barite's function as a drilling fluid weighting agent, a high specific gravity mineral essential for hydrostatic pressure management and formation pressure control. Its role as a non-substitutable weighting agent is critical for ensuring wellbore stability in high-pressure high-temperature (HPHT) drilling.
  • A key trend impacting boardroom strategy is supply chain resilience, leading to investment in the beneficiation of low-grade ore, which has improved yields from secondary sources by over 20%. Beyond its use as a deepwater exploration mineral, industrial applications for micronized barite powder are expanding.
  • It serves as an industrial filler additive, a sound-dampening material, and is used in radiation shielding concrete. The mineral’s chemical inertness property also supports the creation of pharmaceutical-grade barium sulfate from a specific barium sulfate formulation, which acts as a radiopaque contrast agent.
  • As an unconventional gas drilling agent and key subsea drilling component, its strategic value as a critical minerals list component is undeniable.

What are the Key Data Covered in this Barite Market Research and Growth Report?

  • What is the expected growth of the Barite Market between 2026 and 2030?

    • USD 368.8 million, at a CAGR of 4.1%

  • What segmentation does the market report cover?

    • The report is segmented by Type (Powder, and Lumps), End-user (Drilling mud, Chemical manufacturing, Paints and coatings, and Others), Grade Type (Type 1, Type 2, Type 3, and Type 4) and Geography (APAC, North America, Europe, Middle East and Africa, South America)

  • Which regions are analyzed in the report?

    • APAC, North America, Europe, Middle East and Africa and South America

  • What are the key growth drivers and market challenges?

    • Increasing demand for oil and gas drilling operations, Regulatory compliance and environmental restrictions

  • Who are the major players in the Barite Market?

    • ADO Mining, Akrochem Corp., Arvind Minerals, Ashapura Microns LLP, China zhashui heqi barite mining, CIMBAR RESOURCES INC., Gimpex Pvt Ltd, Ishtar Company LLC, J and H Minerals Pvt. Ltd., JAM GROUP CO, Polaris mining, PVS Global Trade Pvt. Ltd., RUA GROUP, Sachtleben Minerals GmbH and Co, SCR Sibelco NV, Sinobarite Industrials Ltd., SNDB, Trimex Group, Vishnu Chemicals Ltd. and Yingfengyuan Industrial Group

Market Research Insights

  • The market is shaped by demand from the upstream energy sector for materials that ensure wellbore integrity during deepwater drilling campaigns. The adoption of advanced solids control systems has enabled operators to increase drilling fluid recovery by up to 80%, a significant factor in managing costs.
  • Beyond energy, growth is supported by demand for high-purity mineral grades in chemical manufacturing and for sound-dampening insulation in industrial applications. Architectural coatings that incorporate barite see a 15% improvement in durability. The diversification into radiation protection materials for oncological facility construction provides a stable, non-cyclical demand stream.
  • However, supply chain diversification remains a strategic priority, as reliance on a few production centers introduces risks related to maritime logistics and geopolitical trade tensions, impacting the availability of key energy exploration materials.

We can help! Our analysts can customize this barite market research report to meet your requirements.

Get in touch

1. Executive Summary

1.1 Market overview

Executive Summary - Chart on Market Overview
Executive Summary - Data Table on Market Overview
Executive Summary - Chart on Global Market Characteristics
Executive Summary - Chart on Market by Geography
Executive Summary - Chart on Market Segmentation by Type
Executive Summary - Chart on Market Segmentation by End-user
Executive Summary - Chart on Market Segmentation by Grade Type
Executive Summary - Chart on Incremental Growth
Executive Summary - Data Table on Incremental Growth
Executive Summary - Chart on Company Market Positioning

2. Technavio Analysis

2.1 Analysis of price sensitivity, lifecycle, customer purchase basket, adoption rates, and purchase criteria

2.2 Criticality of inputs and Factors of differentiation

Chart on Overview on criticality of inputs and factors of differentiation

2.3 Factors of disruption

Chart on Overview on factors of disruption

2.4 Impact of drivers and challenges

Chart on Impact of drivers and challenges in 2025 and 2030

3. Market Landscape

3.1 Market ecosystem

Chart on Parent Market
Data Table on - Parent Market

3.2 Market characteristics

Chart on Market characteristics analysis

3.3 Value chain analysis

Chart on Value chain analysis

4. Market Sizing

4.1 Market definition

Data Table on Offerings of companies included in the market definition

4.2 Market segment analysis

Market segments

4.3 Market size 2025

4.4 Market outlook: Forecast for 2025-2030

Chart on Global - Market size and forecast 2025-2030 ($ million)
Data Table on Global - Market size and forecast 2025-2030 ($ million)
Chart on Global Market: Year-over-year growth 2025-2030 (%)
Data Table on Global Market: Year-over-year growth 2025-2030 (%)

5. Historic Market Size

5.1 Global Barite Market 2020 - 2024

Historic Market Size - Data Table on Global Barite Market 2020 - 2024 ($ million)

5.2 Type segment analysis 2020 - 2024

Historic Market Size - Type Segment 2020 - 2024 ($ million)

5.3 End-user segment analysis 2020 - 2024

Historic Market Size - End-user Segment 2020 - 2024 ($ million)

5.4 Grade Type segment analysis 2020 - 2024

Historic Market Size - Grade Type Segment 2020 - 2024 ($ million)

5.5 Geography segment analysis 2020 - 2024

Historic Market Size - Geography Segment 2020 - 2024 ($ million)

5.6 Country segment analysis 2020 - 2024

Historic Market Size - Country Segment 2020 - 2024 ($ million)

6. Qualitative Analysis

6.1 Impact of AI on Global Barite Market

7. Five Forces Analysis

7.1 Five forces summary

Five forces analysis - Comparison between 2025 and 2030

7.2 Bargaining power of buyers

Bargaining power of buyers - Impact of key factors 2025 and 2030

7.3 Bargaining power of suppliers

Bargaining power of suppliers - Impact of key factors in 2025 and 2030

7.4 Threat of new entrants

Threat of new entrants - Impact of key factors in 2025 and 2030

7.5 Threat of substitutes

Threat of substitutes - Impact of key factors in 2025 and 2030

7.6 Threat of rivalry

Threat of rivalry - Impact of key factors in 2025 and 2030

7.7 Market condition

Chart on Market condition - Five forces 2025 and 2030

8. Market Segmentation by Type

8.1 Market segments

Chart on Type - Market share 2025-2030 (%)
Data Table on Type - Market share 2025-2030 (%)

8.2 Comparison by Type

Chart on Comparison by Type
Data Table on Comparison by Type

8.3 Powder - Market size and forecast 2025-2030

Chart on Powder - Market size and forecast 2025-2030 ($ million)
Data Table on Powder - Market size and forecast 2025-2030 ($ million)
Chart on Powder - Year-over-year growth 2025-2030 (%)
Data Table on Powder - Year-over-year growth 2025-2030 (%)

8.4 Lumps - Market size and forecast 2025-2030

Chart on Lumps - Market size and forecast 2025-2030 ($ million)
Data Table on Lumps - Market size and forecast 2025-2030 ($ million)
Chart on Lumps - Year-over-year growth 2025-2030 (%)
Data Table on Lumps - Year-over-year growth 2025-2030 (%)

8.5 Market opportunity by Type

Market opportunity by Type ($ million)
Data Table on Market opportunity by Type ($ million)

9. Market Segmentation by End-user

9.1 Market segments

Chart on End-user - Market share 2025-2030 (%)
Data Table on End-user - Market share 2025-2030 (%)

9.2 Comparison by End-user

Chart on Comparison by End-user
Data Table on Comparison by End-user

9.3 Drilling mud - Market size and forecast 2025-2030

Chart on Drilling mud - Market size and forecast 2025-2030 ($ million)
Data Table on Drilling mud - Market size and forecast 2025-2030 ($ million)
Chart on Drilling mud - Year-over-year growth 2025-2030 (%)
Data Table on Drilling mud - Year-over-year growth 2025-2030 (%)

9.4 Chemical manufacturing - Market size and forecast 2025-2030

Chart on Chemical manufacturing - Market size and forecast 2025-2030 ($ million)
Data Table on Chemical manufacturing - Market size and forecast 2025-2030 ($ million)
Chart on Chemical manufacturing - Year-over-year growth 2025-2030 (%)
Data Table on Chemical manufacturing - Year-over-year growth 2025-2030 (%)

9.5 Paints and coatings - Market size and forecast 2025-2030

Chart on Paints and coatings - Market size and forecast 2025-2030 ($ million)
Data Table on Paints and coatings - Market size and forecast 2025-2030 ($ million)
Chart on Paints and coatings - Year-over-year growth 2025-2030 (%)
Data Table on Paints and coatings - Year-over-year growth 2025-2030 (%)

9.6 Others - Market size and forecast 2025-2030

Chart on Others - Market size and forecast 2025-2030 ($ million)
Data Table on Others - Market size and forecast 2025-2030 ($ million)
Chart on Others - Year-over-year growth 2025-2030 (%)
Data Table on Others - Year-over-year growth 2025-2030 (%)

9.7 Market opportunity by End-user

Market opportunity by End-user ($ million)
Data Table on Market opportunity by End-user ($ million)

10. Market Segmentation by Grade Type

10.1 Market segments

Chart on Grade Type - Market share 2025-2030 (%)
Data Table on Grade Type - Market share 2025-2030 (%)

10.2 Comparison by Grade Type

Chart on Comparison by Grade Type
Data Table on Comparison by Grade Type

10.3 Type 1 - Market size and forecast 2025-2030

Chart on Type 1 - Market size and forecast 2025-2030 ($ million)
Data Table on Type 1 - Market size and forecast 2025-2030 ($ million)
Chart on Type 1 - Year-over-year growth 2025-2030 (%)
Data Table on Type 1 - Year-over-year growth 2025-2030 (%)

10.4 Type 2 - Market size and forecast 2025-2030

Chart on Type 2 - Market size and forecast 2025-2030 ($ million)
Data Table on Type 2 - Market size and forecast 2025-2030 ($ million)
Chart on Type 2 - Year-over-year growth 2025-2030 (%)
Data Table on Type 2 - Year-over-year growth 2025-2030 (%)

10.5 Type 3 - Market size and forecast 2025-2030

Chart on Type 3 - Market size and forecast 2025-2030 ($ million)
Data Table on Type 3 - Market size and forecast 2025-2030 ($ million)
Chart on Type 3 - Year-over-year growth 2025-2030 (%)
Data Table on Type 3 - Year-over-year growth 2025-2030 (%)

10.6 Type 4 - Market size and forecast 2025-2030

Chart on Type 4 - Market size and forecast 2025-2030 ($ million)
Data Table on Type 4 - Market size and forecast 2025-2030 ($ million)
Chart on Type 4 - Year-over-year growth 2025-2030 (%)
Data Table on Type 4 - Year-over-year growth 2025-2030 (%)

10.7 Market opportunity by Grade Type

Market opportunity by Grade Type ($ million)
Data Table on Market opportunity by Grade Type ($ million)

11. Customer Landscape

11.1 Customer landscape overview

Analysis of price sensitivity, lifecycle, customer purchase basket, adoption rates, and purchase criteria

12. Geographic Landscape

12.1 Geographic segmentation

Chart on Market share by geography 2025-2030 (%)
Data Table on Market share by geography 2025-2030 (%)

12.2 Geographic comparison

Chart on Geographic comparison
Data Table on Geographic comparison

12.3 APAC - Market size and forecast 2025-2030

Chart on APAC - Market size and forecast 2025-2030 ($ million)
Data Table on APAC - Market size and forecast 2025-2030 ($ million)
Chart on APAC - Year-over-year growth 2025-2030 (%)
Data Table on APAC - Year-over-year growth 2025-2030 (%)
Chart on Regional Comparison - APAC
Data Table on Regional Comparison - APAC

12.3.1 China - Market size and forecast 2025-2030

Chart on China - Market size and forecast 2025-2030 ($ million)
Data Table on China - Market size and forecast 2025-2030 ($ million)
Chart on China - Year-over-year growth 2025-2030 (%)
Data Table on China - Year-over-year growth 2025-2030 (%)

12.3.2 India - Market size and forecast 2025-2030

Chart on India - Market size and forecast 2025-2030 ($ million)
Data Table on India - Market size and forecast 2025-2030 ($ million)
Chart on India - Year-over-year growth 2025-2030 (%)
Data Table on India - Year-over-year growth 2025-2030 (%)

12.3.3 Japan - Market size and forecast 2025-2030

Chart on Japan - Market size and forecast 2025-2030 ($ million)
Data Table on Japan - Market size and forecast 2025-2030 ($ million)
Chart on Japan - Year-over-year growth 2025-2030 (%)
Data Table on Japan - Year-over-year growth 2025-2030 (%)

12.3.4 South Korea - Market size and forecast 2025-2030

Chart on South Korea - Market size and forecast 2025-2030 ($ million)
Data Table on South Korea - Market size and forecast 2025-2030 ($ million)
Chart on South Korea - Year-over-year growth 2025-2030 (%)
Data Table on South Korea - Year-over-year growth 2025-2030 (%)

12.3.5 Australia - Market size and forecast 2025-2030

Chart on Australia - Market size and forecast 2025-2030 ($ million)
Data Table on Australia - Market size and forecast 2025-2030 ($ million)
Chart on Australia - Year-over-year growth 2025-2030 (%)
Data Table on Australia - Year-over-year growth 2025-2030 (%)

12.3.6 Indonesia - Market size and forecast 2025-2030

Chart on Indonesia - Market size and forecast 2025-2030 ($ million)
Data Table on Indonesia - Market size and forecast 2025-2030 ($ million)
Chart on Indonesia - Year-over-year growth 2025-2030 (%)
Data Table on Indonesia - Year-over-year growth 2025-2030 (%)

12.4 North America - Market size and forecast 2025-2030

Chart on North America - Market size and forecast 2025-2030 ($ million)
Data Table on North America - Market size and forecast 2025-2030 ($ million)
Chart on North America - Year-over-year growth 2025-2030 (%)
Data Table on North America - Year-over-year growth 2025-2030 (%)
Chart on Regional Comparison - North America
Data Table on Regional Comparison - North America

12.4.1 US - Market size and forecast 2025-2030

Chart on US - Market size and forecast 2025-2030 ($ million)
Data Table on US - Market size and forecast 2025-2030 ($ million)
Chart on US - Year-over-year growth 2025-2030 (%)
Data Table on US - Year-over-year growth 2025-2030 (%)

12.4.2 Canada - Market size and forecast 2025-2030

Chart on Canada - Market size and forecast 2025-2030 ($ million)
Data Table on Canada - Market size and forecast 2025-2030 ($ million)
Chart on Canada - Year-over-year growth 2025-2030 (%)
Data Table on Canada - Year-over-year growth 2025-2030 (%)

12.4.3 Mexico - Market size and forecast 2025-2030

Chart on Mexico - Market size and forecast 2025-2030 ($ million)
Data Table on Mexico - Market size and forecast 2025-2030 ($ million)
Chart on Mexico - Year-over-year growth 2025-2030 (%)
Data Table on Mexico - Year-over-year growth 2025-2030 (%)

12.5 Europe - Market size and forecast 2025-2030

Chart on Europe - Market size and forecast 2025-2030 ($ million)
Data Table on Europe - Market size and forecast 2025-2030 ($ million)
Chart on Europe - Year-over-year growth 2025-2030 (%)
Data Table on Europe - Year-over-year growth 2025-2030 (%)
Chart on Regional Comparison - Europe
Data Table on Regional Comparison - Europe

12.5.1 Germany - Market size and forecast 2025-2030

Chart on Germany - Market size and forecast 2025-2030 ($ million)
Data Table on Germany - Market size and forecast 2025-2030 ($ million)
Chart on Germany - Year-over-year growth 2025-2030 (%)
Data Table on Germany - Year-over-year growth 2025-2030 (%)

12.5.2 UK - Market size and forecast 2025-2030

Chart on UK - Market size and forecast 2025-2030 ($ million)
Data Table on UK - Market size and forecast 2025-2030 ($ million)
Chart on UK - Year-over-year growth 2025-2030 (%)
Data Table on UK - Year-over-year growth 2025-2030 (%)

12.5.3 France - Market size and forecast 2025-2030

Chart on France - Market size and forecast 2025-2030 ($ million)
Data Table on France - Market size and forecast 2025-2030 ($ million)
Chart on France - Year-over-year growth 2025-2030 (%)
Data Table on France - Year-over-year growth 2025-2030 (%)

12.5.4 Italy - Market size and forecast 2025-2030

Chart on Italy - Market size and forecast 2025-2030 ($ million)
Data Table on Italy - Market size and forecast 2025-2030 ($ million)
Chart on Italy - Year-over-year growth 2025-2030 (%)
Data Table on Italy - Year-over-year growth 2025-2030 (%)

12.5.5 Spain - Market size and forecast 2025-2030

Chart on Spain - Market size and forecast 2025-2030 ($ million)
Data Table on Spain - Market size and forecast 2025-2030 ($ million)
Chart on Spain - Year-over-year growth 2025-2030 (%)
Data Table on Spain - Year-over-year growth 2025-2030 (%)

12.5.6 The Netherlands - Market size and forecast 2025-2030

Chart on The Netherlands - Market size and forecast 2025-2030 ($ million)
Data Table on The Netherlands - Market size and forecast 2025-2030 ($ million)
Chart on The Netherlands - Year-over-year growth 2025-2030 (%)
Data Table on The Netherlands - Year-over-year growth 2025-2030 (%)

12.6 Middle East and Africa - Market size and forecast 2025-2030

Chart on Middle East and Africa - Market size and forecast 2025-2030 ($ million)
Data Table on Middle East and Africa - Market size and forecast 2025-2030 ($ million)
Chart on Middle East and Africa - Year-over-year growth 2025-2030 (%)
Data Table on Middle East and Africa - Year-over-year growth 2025-2030 (%)
Chart on Regional Comparison - Middle East and Africa
Data Table on Regional Comparison - Middle East and Africa

12.6.1 Saudi Arabia - Market size and forecast 2025-2030

Chart on Saudi Arabia - Market size and forecast 2025-2030 ($ million)
Data Table on Saudi Arabia - Market size and forecast 2025-2030 ($ million)
Chart on Saudi Arabia - Year-over-year growth 2025-2030 (%)
Data Table on Saudi Arabia - Year-over-year growth 2025-2030 (%)

12.6.2 UAE - Market size and forecast 2025-2030

Chart on UAE - Market size and forecast 2025-2030 ($ million)
Data Table on UAE - Market size and forecast 2025-2030 ($ million)
Chart on UAE - Year-over-year growth 2025-2030 (%)
Data Table on UAE - Year-over-year growth 2025-2030 (%)

12.6.3 South Africa - Market size and forecast 2025-2030

Chart on South Africa - Market size and forecast 2025-2030 ($ million)
Data Table on South Africa - Market size and forecast 2025-2030 ($ million)
Chart on South Africa - Year-over-year growth 2025-2030 (%)
Data Table on South Africa - Year-over-year growth 2025-2030 (%)

12.6.4 Turkey - Market size and forecast 2025-2030

Chart on Turkey - Market size and forecast 2025-2030 ($ million)
Data Table on Turkey - Market size and forecast 2025-2030 ($ million)
Chart on Turkey - Year-over-year growth 2025-2030 (%)
Data Table on Turkey - Year-over-year growth 2025-2030 (%)

12.6.5 Israel - Market size and forecast 2025-2030

Chart on Israel - Market size and forecast 2025-2030 ($ million)
Data Table on Israel - Market size and forecast 2025-2030 ($ million)
Chart on Israel - Year-over-year growth 2025-2030 (%)
Data Table on Israel - Year-over-year growth 2025-2030 (%)

12.7 South America - Market size and forecast 2025-2030

Chart on South America - Market size and forecast 2025-2030 ($ million)
Data Table on South America - Market size and forecast 2025-2030 ($ million)
Chart on South America - Year-over-year growth 2025-2030 (%)
Data Table on South America - Year-over-year growth 2025-2030 (%)
Chart on Regional Comparison - South America
Data Table on Regional Comparison - South America

12.7.1 Brazil - Market size and forecast 2025-2030

Chart on Brazil - Market size and forecast 2025-2030 ($ million)
Data Table on Brazil - Market size and forecast 2025-2030 ($ million)
Chart on Brazil - Year-over-year growth 2025-2030 (%)
Data Table on Brazil - Year-over-year growth 2025-2030 (%)

12.7.2 Argentina - Market size and forecast 2025-2030

Chart on Argentina - Market size and forecast 2025-2030 ($ million)
Data Table on Argentina - Market size and forecast 2025-2030 ($ million)
Chart on Argentina - Year-over-year growth 2025-2030 (%)
Data Table on Argentina - Year-over-year growth 2025-2030 (%)

12.7.3 Chile - Market size and forecast 2025-2030

Chart on Chile - Market size and forecast 2025-2030 ($ million)
Data Table on Chile - Market size and forecast 2025-2030 ($ million)
Chart on Chile - Year-over-year growth 2025-2030 (%)
Data Table on Chile - Year-over-year growth 2025-2030 (%)

12.8 Market opportunity by geography

Market opportunity by geography ($ million)
Data Tables on Market opportunity by geography ($ million)

13. Drivers, Challenges, and Opportunity

13.1 Market drivers

Increasing demand for oil and gas drilling operations
Rising consumption in pharmaceutical and medical imaging sector
Growing adoption of high-density fillers in industrial applications

13.2 Market challenges

Regulatory compliance and environmental restrictions
Volatility in energy industries and drilling activity
Supply chain disruptions and geopolitical trade tensions

13.3 Impact of drivers and challenges

Impact of drivers and challenges in 2025 and 2030

13.4 Market opportunities

Increasing complexity in deepwater and ultra-deepwater energy exploration efforts
Adoption of circular economy principles and barite recovery technologies
Rising global demand for radiation shielding in healthcare and nuclear power infrastructure

14. Competitive Landscape

14.1 Overview

14.2

Overview on criticality of inputs and factors of differentiation

14.3 Landscape disruption

Overview on factors of disruption

14.4 Industry risks

Impact of key risks on business

15. Competitive Analysis

15.1 Companies profiled

Companies covered

15.2 Company ranking index

15.3 Market positioning of companies

Matrix on companies position and classification

15.4 ADO Mining

ADO Mining - Overview
ADO Mining - Product / Service
ADO Mining - Key offerings
SWOT

15.5 Akrochem Corp.

Akrochem Corp. - Overview
Akrochem Corp. - Product / Service
Akrochem Corp. - Key offerings
SWOT

15.6 Arvind Minerals

Arvind Minerals - Overview
Arvind Minerals - Product / Service
Arvind Minerals - Key offerings
SWOT

15.7 Ashapura Microns LLP

Ashapura Microns LLP - Overview
Ashapura Microns LLP - Product / Service
Ashapura Microns LLP - Key offerings
SWOT

15.8 China zhashui heqi barite mining

China zhashui heqi barite mining - Overview
China zhashui heqi barite mining - Product / Service
China zhashui heqi barite mining - Key offerings
SWOT

15.9 CIMBAR RESOURCES INC.

CIMBAR RESOURCES INC. - Overview
CIMBAR RESOURCES INC. - Product / Service
CIMBAR RESOURCES INC. - Key offerings
SWOT

15.10 Gimpex Pvt Ltd

Gimpex Pvt Ltd - Overview
Gimpex Pvt Ltd - Product / Service
Gimpex Pvt Ltd - Key offerings
SWOT

15.11 Ishtar Company LLC

Ishtar Company LLC - Overview
Ishtar Company LLC - Product / Service
Ishtar Company LLC - Key offerings
SWOT

15.12 J and H Minerals Pvt. Ltd.

J and H Minerals Pvt. Ltd. - Overview
J and H Minerals Pvt. Ltd. - Product / Service
J and H Minerals Pvt. Ltd. - Key offerings
SWOT

15.13 JAM GROUP CO

JAM GROUP CO - Overview
JAM GROUP CO - Product / Service
JAM GROUP CO - Key offerings
SWOT

15.14 Polaris mining

Polaris mining - Overview
Polaris mining - Product / Service
Polaris mining - Key offerings
SWOT

15.15 PVS Global Trade Pvt. Ltd.

PVS Global Trade Pvt. Ltd. - Overview
PVS Global Trade Pvt. Ltd. - Product / Service
PVS Global Trade Pvt. Ltd. - Key offerings
SWOT

15.16 RUA GROUP

RUA GROUP - Overview
RUA GROUP - Product / Service
RUA GROUP - Key offerings
SWOT

15.17 Trimex Group

Trimex Group - Overview
Trimex Group - Product / Service
Trimex Group - Key offerings
SWOT

15.18 Vishnu Chemicals Ltd.

Vishnu Chemicals Ltd. - Overview
Vishnu Chemicals Ltd. - Product / Service
Vishnu Chemicals Ltd. - Key offerings
SWOT

16. Appendix

16.1 Scope of the report

Market definition
Objectives
Notes and caveats

16.2 Inclusions and exclusions checklist

Inclusions checklist
Exclusions checklist

16.3 Currency conversion rates for US$

16.4 Research methodology

16.5 Data procurement

Information sources

16.6 Data validation

16.7 Validation techniques employed for market sizing

16.8 Data synthesis

16.9 360 degree market analysis

16.10 List of abbreviations

Research Methodology

Technavio presents a detailed picture of the market by way of study, synthesis, and summation of data from multiple sources. The analysts have presented the various facets of the market with a particular focus on identifying the key industry influencers. The data thus presented is comprehensive, reliable, and the result of extensive research, both primary and secondary.

INFORMATION SOURCES

Primary sources

  • Manufacturers and suppliers
  • Channel partners
  • Industry experts
  • Strategic decision makers

Secondary sources

  • Industry journals and periodicals
  • Government data
  • Financial reports of key industry players
  • Historical data
  • Press releases

DATA ANALYSIS

Data Synthesis

  • Collation of data
  • Estimation of key figures
  • Analysis of derived insights

Data Validation

  • Triangulation with data models
  • Reference against proprietary databases
  • Corroboration with industry experts

REPORT WRITING

Qualitative

  • Market drivers
  • Market challenges
  • Market trends
  • Five forces analysis

Quantitative

  • Market size and forecast
  • Market segmentation
  • Geographical insights
  • Competitive landscape

Interested in this report?

Get your sample now to see our research methodology and insights!

Download Now

Frequently Asked Questions

Barite market growth will increase by USD 368.8 million during 2026-2030.

The Barite market is expected to grow at a CAGR of 4.1% during 2026-2030.

Barite market is segmented by Type (Powder, Lumps) End-user (Drilling mud, Chemical manufacturing, Paints and coatings, Others) Grade type (Type 1, Type 2, Type 3, Type 4)

ADO Mining, Akrochem Corp., Arvind Minerals, Ashapura Microns LLP, China zhashui heqi barite mining, CIMBAR RESOURCES INC., Gimpex Pvt Ltd, Ishtar Company LLC, J and H Minerals Pvt. Ltd., JAM GROUP CO, Polaris mining, PVS Global Trade Pvt. Ltd., RUA GROUP, Sachtleben Minerals GmbH and Co, SCR Sibelco NV, Sinobarite Industrials Ltd., SNDB, Trimex Group, Vishnu Chemicals Ltd., Yingfengyuan Industrial Group are a few of the key vendors in the Barite market.

APAC will register the highest growth rate of 59.9% among the other regions. Therefore, the Barite market in APAC is expected to garner significant business opportunities for the vendors during the forecast period.

China, India, Japan, South Korea, Australia, Indonesia, US, Canada, Mexico, Germany, UK, France, Italy, Spain, The Netherlands, Saudi Arabia, UAE, South Africa, Turkey, Israel, Brazil, Argentina, Chile

  • Increasing demand for oil and gas drilling operations is the driving factor this market.

The Barite market vendors should focus on grabbing business opportunities from the Type segment as it accounted for the largest market share in the base year.
RIA - Research AI Assistant
Ask RIA