Basalt Rock Market Analysis, Size, and Forecast 2025-2029: APAC (China, India, and Japan), Europe (Germany, France, and UK), North America (US, Canada, and Mexico), South America (Brazil and Argentina), Middle East and Africa (Turkey, Saudi Arabia, and South Africa), and Rest of World (ROW)

Basalt Rock Market Analysis, Size, and Forecast 2025-2029:
APAC (China, India, and Japan), Europe (Germany, France, and UK), North America (US, Canada, and Mexico), South America (Brazil and Argentina), Middle East and Africa (Turkey, Saudi Arabia, and South Africa), and Rest of World (ROW)

Published: Dec 2025 301 Pages SKU: IRTNTR81134

Market Overview at a Glance

$788.9 Mn
Market Opportunity
7%
CAGR 2024 - 2029
52.7%
APAC Growth
$1.69 B
Natural basalt segment 2023

Basalt Rock Market Size 2025-2029

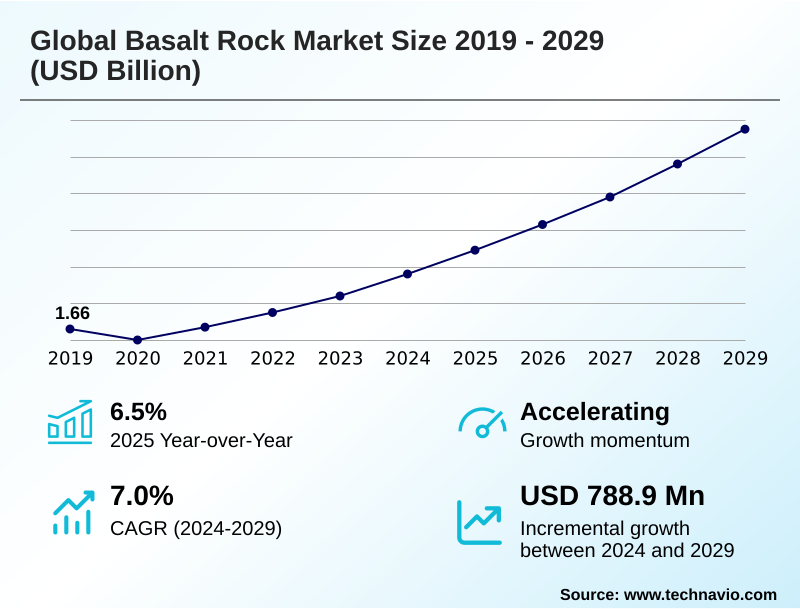
The basalt rock market size is valued to increase by USD 788.9 million, at a CAGR of 7% from 2024 to 2029. Sustained growth in global infrastructure and construction activity will drive the basalt rock market.

Major Market Trends & Insights

  • APAC dominated the market and accounted for a 52.7% growth during the forecast period.
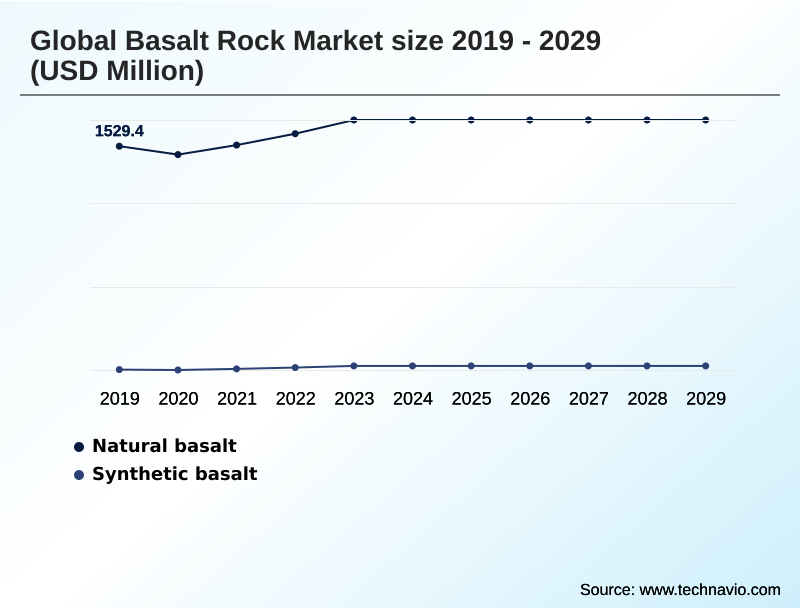
  • By Type - Natural basalt segment was valued at USD 1.69 billion in 2023
  • By End-user - Building and construction segment accounted for the largest market revenue share in 2023

Market Size & Forecast

  • Market Opportunities: USD 1.09 billion
  • Market Future Opportunities: USD 788.9 million
  • CAGR from 2024 to 2029 : 7%

Market Summary

What will be the Size of the Basalt Rock Market during the forecast period?

Get Key Insights on Market Forecast (PDF) Request Free Sample

How is the Basalt Rock Market Segmented?

The basalt rock industry research report provides comprehensive data (region-wise segment analysis), with forecasts and estimates in "USD million" for the period 2025-2029, as well as historical data from 2019-2023 for the following segments.

  • Type
    • Natural basalt
    • Synthetic basalt
  • End-user
    • Building and construction
    • Infrastructure
    • Automotive and transportation
    • Aerospace and defense
    • Others
  • Product type
    • Basalt fiber
    • Basalt aggregates
    • Basalt tiles or slabs
    • Others
  • Geography
    • APAC
      • China
      • India
      • Japan
    • Europe
      • Germany
      • France
      • UK
    • North America
      • US
      • Canada
      • Mexico
    • South America
      • Brazil
      • Argentina
    • Middle East and Africa
      • Turkey
      • Saudi Arabia
      • South Africa
    • Rest of World (ROW)

By Type Insights

The natural basalt segment is estimated to witness significant growth during the forecast period.

Request Free Sample

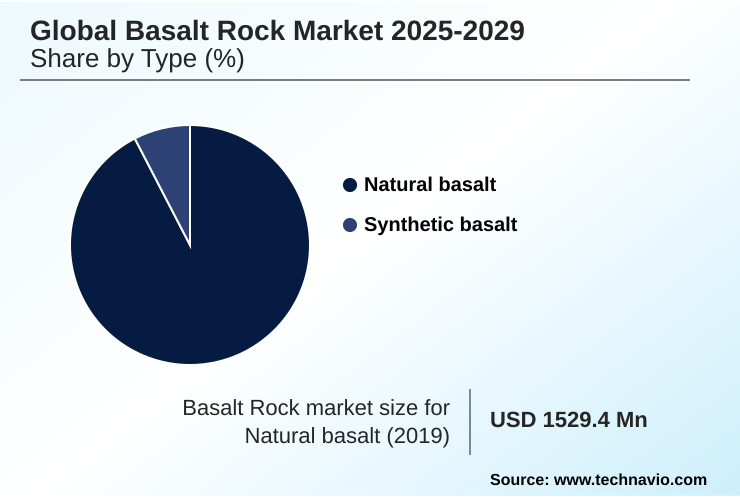
The Natural basalt segment was valued at USD 1.69 billion in 2023 and showed a gradual increase during the forecast period.

Request Free Sample

Regional Analysis

APAC is estimated to contribute 52.7% to the growth of the global market during the forecast period.Technavio’s analysts have elaborately explained the regional trends and drivers that shape the market during the forecast period.

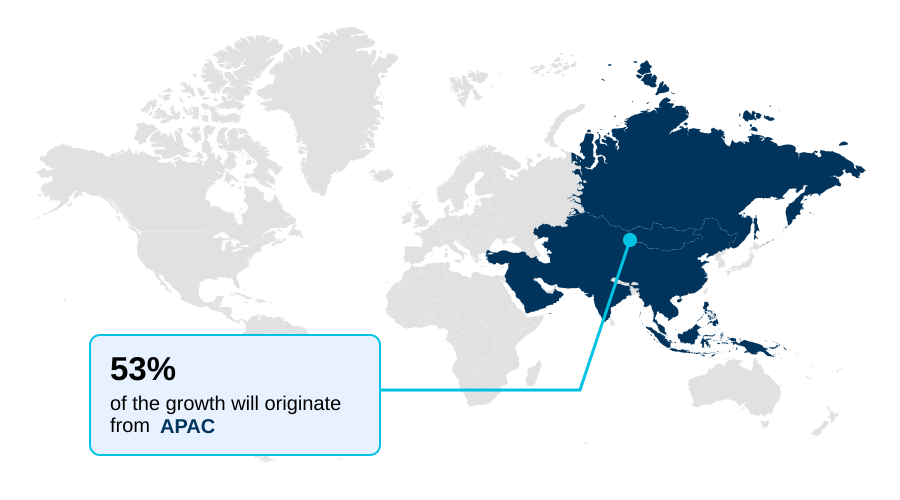
See How Basalt Rock Market Demand is Rising in APAC Request Free Sample

Market Dynamics

Our researchers analyzed the data with 2024 as the base year, along with the key drivers, trends, and challenges. A holistic analysis of drivers will help companies refine their marketing strategies to gain a competitive advantage.

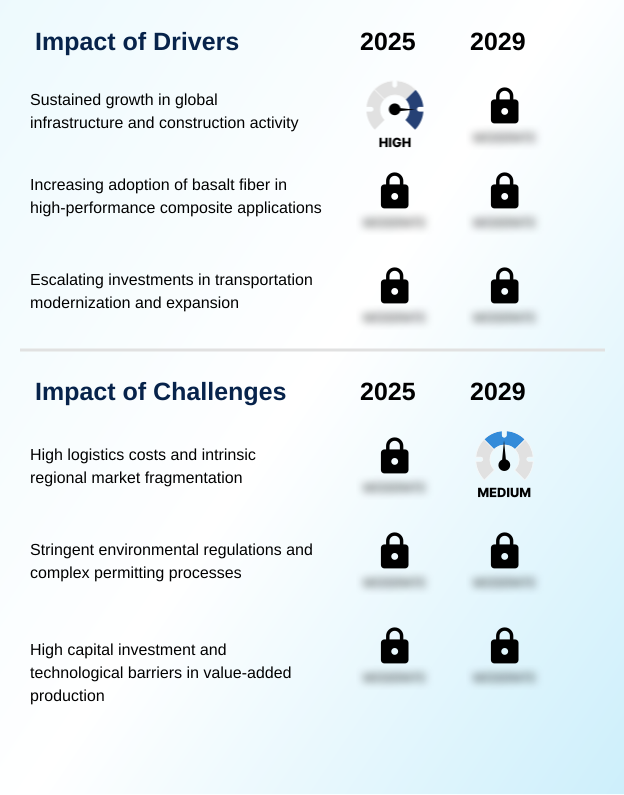
What are the key market drivers leading to the rise in the adoption of Basalt Rock Industry?

What are the market trends shaping the Basalt Rock Industry?

What challenges does the Basalt Rock Industry face during its growth?

Exclusive Technavio Analysis on Customer Landscape

The basalt rock market forecasting report includes the adoption lifecycle of the market, covering from the innovator’s stage to the laggard’s stage. It focuses on adoption rates in different regions based on penetration. Furthermore, the basalt rock market report also includes key purchase criteria and drivers of price sensitivity to help companies evaluate and develop their market growth analysis strategies.

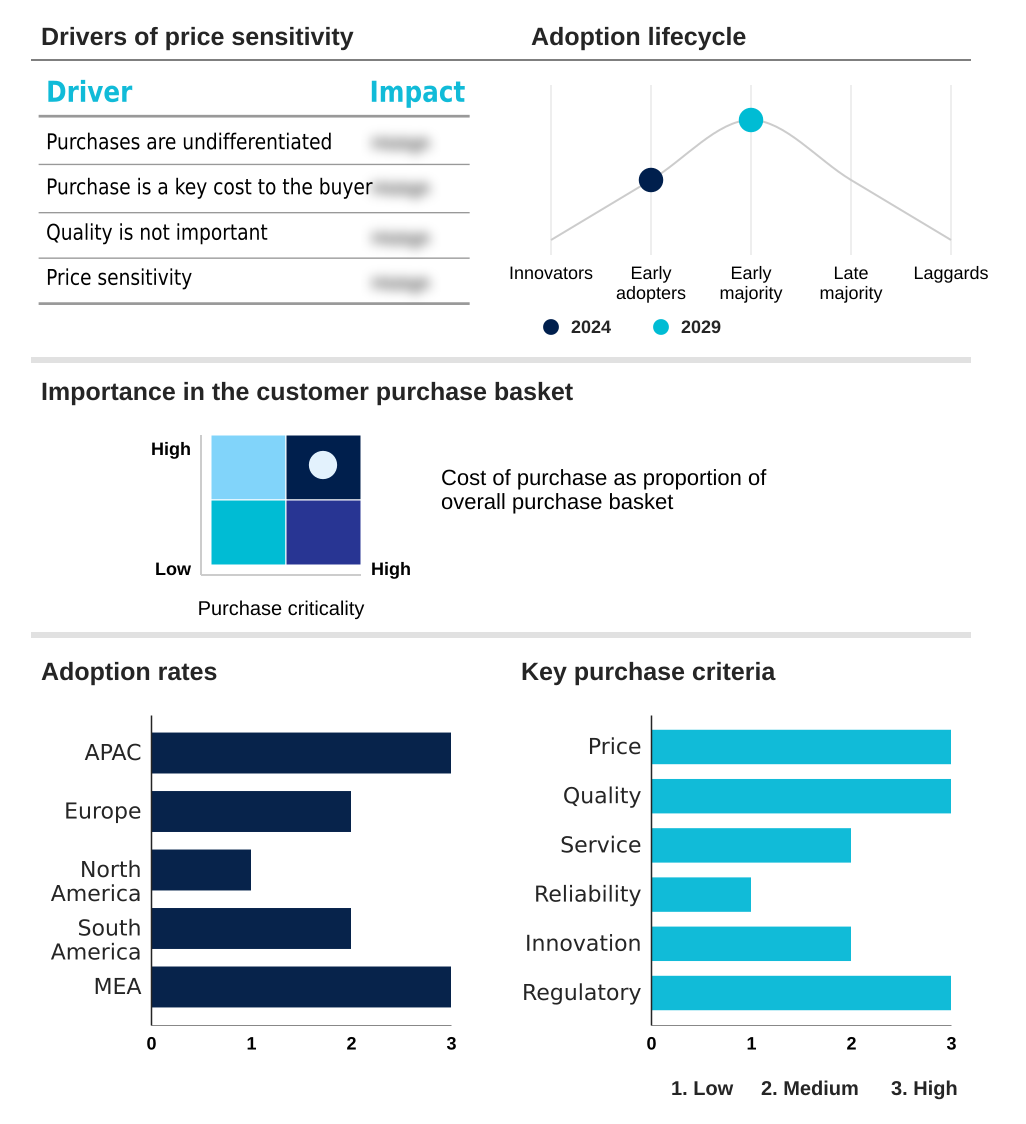
Customer Landscape of Basalt Rock Industry

Competitive Landscape

Companies are implementing various strategies, such as strategic alliances, basalt rock market forecast, partnerships, mergers and acquisitions, geographical expansion, and product/service launches, to enhance their presence in the industry.

Albarrie Canada Ltd. -

The industry research and growth report includes detailed analyses of the competitive landscape of the market and information about key companies, including:

  • Albarrie Canada Ltd.
  • Arab Basalt Fiber
  • Aravali India Marbles
  • Basalt Engineering LLC
  • Basalt Fiber Tech
  • Basalt International
  • BASALTEX NV
  • BASFIBER TRADE LLC
  • Deutsche Basalt Faser GmbH
  • ISOMATEX SA
  • Jilin Tongxin Basalt
  • Jumeisheng Co. Ltd.
  • Kamenny Vek
  • ROCKWOOL AS
  • Sudaglass Fiber Technology Inc.
  • Technobasalt LLC
  • Zhejiang GBF Basalt Fiber

Qualitative and quantitative analysis of companies has been conducted to help clients understand the wider business environment as well as the strengths and weaknesses of key industry players. Data is qualitatively analyzed to categorize companies as pure play, category-focused, industry-focused, and diversified; it is quantitatively analyzed to categorize companies as dominant, leading, strong, tentative, and weak.

Recent Development and News in Basalt rock market

Dive into Technavio’s robust research methodology, blending expert interviews, extensive data synthesis, and validated models for unparalleled Basalt Rock Market insights. See full methodology.

Market Scope
Page number 301
Base year 2024
Historic period 2019-2023
Forecast period 2025-2029
Growth momentum & CAGR Accelerate at a CAGR of 7%
Market growth 2025-2029 USD 788.9 million
Market structure Fragmented
YoY growth 2024-2025(%) 6.5%
Key countries China, India, Japan, South Korea, Australia, Indonesia, Germany, France, UK, Italy, Spain, The Netherlands, US, Canada, Mexico, Brazil, Argentina, Chile, Turkey, Saudi Arabia, South Africa, UAE and Egypt
Competitive landscape Leading Companies, Market Positioning of Companies, Competitive Strategies, and Industry Risks

Request Free Sample

Research Analyst Overview

What are the Key Data Covered in this Basalt Rock Market Research and Growth Report?

  • What is the expected growth of the Basalt Rock Market between 2025 and 2029?

    • USD 788.9 million, at a CAGR of 7%

  • What segmentation does the market report cover?

    • The report is segmented by Type (Natural basalt, and Synthetic basalt), End-user (Building and construction, Infrastructure, Automotive and transportation, Aerospace and defense, and Others), Product Type (Basalt fiber, Basalt aggregates, Basalt tiles or slabs, and Others) and Geography (APAC, Europe, North America, South America, Middle East and Africa)

  • Which regions are analyzed in the report?

    • APAC, Europe, North America, South America and Middle East and Africa

  • What are the key growth drivers and market challenges?

    • Sustained growth in global infrastructure and construction activity, High logistics costs and intrinsic regional market fragmentation

  • Who are the major players in the Basalt Rock Market?

    • Albarrie Canada Ltd., Arab Basalt Fiber, Aravali India Marbles, Basalt Engineering LLC, Basalt Fiber Tech, Basalt International, BASALTEX NV, BASFIBER TRADE LLC, Deutsche Basalt Faser GmbH, ISOMATEX SA, Jilin Tongxin Basalt, Jumeisheng Co. Ltd., Kamenny Vek, ROCKWOOL AS, Sudaglass Fiber Technology Inc., Technobasalt LLC and Zhejiang GBF Basalt Fiber

Market Research Insights

We can help! Our analysts can customize this basalt rock market research report to meet your requirements.

Get in touch

1. Executive Summary

1.1 Market overview

Executive Summary - Chart on Market Overview
Executive Summary - Data Table on Market Overview
Executive Summary - Chart on Global Market Characteristics
Executive Summary - Chart on Market by Geography
Executive Summary - Chart on Market Segmentation by Type
Executive Summary - Chart on Market Segmentation by End-user
Executive Summary - Chart on Market Segmentation by Product Type
Executive Summary - Chart on Incremental Growth
Executive Summary - Data Table on Incremental Growth
Executive Summary - Chart on Company Market Positioning

2. Technavio Analysis

2.1 Analysis of price sensitivity, lifecycle, customer purchase basket, adoption rates, and purchase criteria

2.2 Criticality of inputs and Factors of differentiation

Chart on Overview on criticality of inputs and factors of differentiation

2.3 Factors of disruption

Chart on Overview on factors of disruption

2.4 Impact of drivers and challenges

Chart on Impact of drivers and challenges in 2024 and 2029

3. Market Landscape

3.1 Market ecosystem

Chart on Parent Market
Data Table on - Parent Market

3.2 Market characteristics

Chart on Market characteristics analysis

3.3 Value chain analysis

Chart on Value chain analysis

4. Market Sizing

4.1 Market definition

Data Table on Offerings of companies included in the market definition

4.2 Market segment analysis

Market segments

4.3 Market size 2024

4.4 Market outlook: Forecast for 2024-2029

Chart on Global - Market size and forecast 2024-2029 ($ million)
Data Table on Global - Market size and forecast 2024-2029 ($ million)
Chart on Global Market: Year-over-year growth 2024-2029 (%)
Data Table on Global Market: Year-over-year growth 2024-2029 (%)

5. Historic Market Size

5.1 Global Basalt Rock Market 2019 - 2023

Historic Market Size - Data Table on Global Basalt Rock Market 2019 - 2023 ($ million)

5.2 Type segment analysis 2019 - 2023

Historic Market Size - Type Segment 2019 - 2023 ($ million)

5.3 End-user segment analysis 2019 - 2023

Historic Market Size - End-user Segment 2019 - 2023 ($ million)

5.4 Product Type segment analysis 2019 - 2023

Historic Market Size - Product Type Segment 2019 - 2023 ($ million)

5.5 Geography segment analysis 2019 - 2023

Historic Market Size - Geography Segment 2019 - 2023 ($ million)

5.6 Country segment analysis 2019 - 2023

Historic Market Size - Country Segment 2019 - 2023 ($ million)

6. Qualitative Analysis

6.1 The AI impact on global basalt rock market

7. Five Forces Analysis

7.1 Five forces summary

Five forces analysis - Comparison between 2024 and 2029

7.2 Bargaining power of buyers

Bargaining power of buyers - Impact of key factors 2024 and 2029

7.3 Bargaining power of suppliers

Bargaining power of suppliers - Impact of key factors in 2024 and 2029

7.4 Threat of new entrants

Threat of new entrants - Impact of key factors in 2024 and 2029

7.5 Threat of substitutes

Threat of substitutes - Impact of key factors in 2024 and 2029

7.6 Threat of rivalry

Threat of rivalry - Impact of key factors in 2024 and 2029

7.7 Market condition

Chart on Market condition - Five forces 2024 and 2029

8. Market Segmentation by Type

8.1 Market segments

Chart on Type - Market share 2024-2029 (%)
Data Table on Type - Market share 2024-2029 (%)

8.2 Comparison by Type

Chart on Comparison by Type
Data Table on Comparison by Type

8.3 Natural basalt - Market size and forecast 2024-2029

Chart on Natural basalt - Market size and forecast 2024-2029 ($ million)
Data Table on Natural basalt - Market size and forecast 2024-2029 ($ million)
Chart on Natural basalt - Year-over-year growth 2024-2029 (%)
Data Table on Natural basalt - Year-over-year growth 2024-2029 (%)

8.4 Synthetic basalt - Market size and forecast 2024-2029

Chart on Synthetic basalt - Market size and forecast 2024-2029 ($ million)
Data Table on Synthetic basalt - Market size and forecast 2024-2029 ($ million)
Chart on Synthetic basalt - Year-over-year growth 2024-2029 (%)
Data Table on Synthetic basalt - Year-over-year growth 2024-2029 (%)

8.5 Market opportunity by Type

Market opportunity by Type ($ million)
Data Table on Market opportunity by Type ($ million)

9. Market Segmentation by End-user

9.1 Market segments

Chart on End-user - Market share 2024-2029 (%)
Data Table on End-user - Market share 2024-2029 (%)

9.2 Comparison by End-user

Chart on Comparison by End-user
Data Table on Comparison by End-user

9.3 Building and construction - Market size and forecast 2024-2029

Chart on Building and construction - Market size and forecast 2024-2029 ($ million)
Data Table on Building and construction - Market size and forecast 2024-2029 ($ million)
Chart on Building and construction - Year-over-year growth 2024-2029 (%)
Data Table on Building and construction - Year-over-year growth 2024-2029 (%)

9.4 Infrastructure - Market size and forecast 2024-2029

Chart on Infrastructure - Market size and forecast 2024-2029 ($ million)
Data Table on Infrastructure - Market size and forecast 2024-2029 ($ million)
Chart on Infrastructure - Year-over-year growth 2024-2029 (%)
Data Table on Infrastructure - Year-over-year growth 2024-2029 (%)

9.5 Automotive and transportation - Market size and forecast 2024-2029

Chart on Automotive and transportation - Market size and forecast 2024-2029 ($ million)
Data Table on Automotive and transportation - Market size and forecast 2024-2029 ($ million)
Chart on Automotive and transportation - Year-over-year growth 2024-2029 (%)
Data Table on Automotive and transportation - Year-over-year growth 2024-2029 (%)

9.6 Aerospace and defense - Market size and forecast 2024-2029

Chart on Aerospace and defense - Market size and forecast 2024-2029 ($ million)
Data Table on Aerospace and defense - Market size and forecast 2024-2029 ($ million)
Chart on Aerospace and defense - Year-over-year growth 2024-2029 (%)
Data Table on Aerospace and defense - Year-over-year growth 2024-2029 (%)

9.7 Others - Market size and forecast 2024-2029

Chart on Others - Market size and forecast 2024-2029 ($ million)
Data Table on Others - Market size and forecast 2024-2029 ($ million)
Chart on Others - Year-over-year growth 2024-2029 (%)
Data Table on Others - Year-over-year growth 2024-2029 (%)

9.8 Market opportunity by End-user

Market opportunity by End-user ($ million)
Data Table on Market opportunity by End-user ($ million)

10. Market Segmentation by Product Type

10.1 Market segments

Chart on Product Type - Market share 2024-2029 (%)
Data Table on Product Type - Market share 2024-2029 (%)

10.2 Comparison by Product Type

Chart on Comparison by Product Type
Data Table on Comparison by Product Type

10.3 Basalt fiber - Market size and forecast 2024-2029

Chart on Basalt fiber - Market size and forecast 2024-2029 ($ million)
Data Table on Basalt fiber - Market size and forecast 2024-2029 ($ million)
Chart on Basalt fiber - Year-over-year growth 2024-2029 (%)
Data Table on Basalt fiber - Year-over-year growth 2024-2029 (%)

10.4 Basalt aggregates - Market size and forecast 2024-2029

Chart on Basalt aggregates - Market size and forecast 2024-2029 ($ million)
Data Table on Basalt aggregates - Market size and forecast 2024-2029 ($ million)
Chart on Basalt aggregates - Year-over-year growth 2024-2029 (%)
Data Table on Basalt aggregates - Year-over-year growth 2024-2029 (%)

10.5 Basalt tiles or slabs - Market size and forecast 2024-2029

Chart on Basalt tiles or slabs - Market size and forecast 2024-2029 ($ million)
Data Table on Basalt tiles or slabs - Market size and forecast 2024-2029 ($ million)
Chart on Basalt tiles or slabs - Year-over-year growth 2024-2029 (%)
Data Table on Basalt tiles or slabs - Year-over-year growth 2024-2029 (%)

10.6 Others - Market size and forecast 2024-2029

Chart on Others - Market size and forecast 2024-2029 ($ million)
Data Table on Others - Market size and forecast 2024-2029 ($ million)
Chart on Others - Year-over-year growth 2024-2029 (%)
Data Table on Others - Year-over-year growth 2024-2029 (%)

10.7 Market opportunity by Product Type

Market opportunity by Product Type ($ million)
Data Table on Market opportunity by Product Type ($ million)

11. Customer Landscape

11.1 Customer landscape overview

Analysis of price sensitivity, lifecycle, customer purchase basket, adoption rates, and purchase criteria

12. Geographic Landscape

12.1 Geographic segmentation

Chart on Market share by geography 2024-2029 (%)
Data Table on Market share by geography 2024-2029 (%)

12.2 Geographic comparison

Chart on Geographic comparison
Data Table on Geographic comparison

12.3 APAC - Market size and forecast 2024-2029

Chart on APAC - Market size and forecast 2024-2029 ($ million)
Data Table on APAC - Market size and forecast 2024-2029 ($ million)
Chart on APAC - Year-over-year growth 2024-2029 (%)
Data Table on APAC - Year-over-year growth 2024-2029 (%)
Chart on Regional Comparison - APAC
Data Table on Regional Comparison - APAC

12.3.1 China - Market size and forecast 2024-2029

Chart on China - Market size and forecast 2024-2029 ($ million)
Data Table on China - Market size and forecast 2024-2029 ($ million)
Chart on China - Year-over-year growth 2024-2029 (%)
Data Table on China - Year-over-year growth 2024-2029 (%)

12.3.2 India - Market size and forecast 2024-2029

Chart on India - Market size and forecast 2024-2029 ($ million)
Data Table on India - Market size and forecast 2024-2029 ($ million)
Chart on India - Year-over-year growth 2024-2029 (%)
Data Table on India - Year-over-year growth 2024-2029 (%)

12.3.3 Japan - Market size and forecast 2024-2029

Chart on Japan - Market size and forecast 2024-2029 ($ million)
Data Table on Japan - Market size and forecast 2024-2029 ($ million)
Chart on Japan - Year-over-year growth 2024-2029 (%)
Data Table on Japan - Year-over-year growth 2024-2029 (%)

12.3.4 South Korea - Market size and forecast 2024-2029

Chart on South Korea - Market size and forecast 2024-2029 ($ million)
Data Table on South Korea - Market size and forecast 2024-2029 ($ million)
Chart on South Korea - Year-over-year growth 2024-2029 (%)
Data Table on South Korea - Year-over-year growth 2024-2029 (%)

12.3.5 Australia - Market size and forecast 2024-2029

Chart on Australia - Market size and forecast 2024-2029 ($ million)
Data Table on Australia - Market size and forecast 2024-2029 ($ million)
Chart on Australia - Year-over-year growth 2024-2029 (%)
Data Table on Australia - Year-over-year growth 2024-2029 (%)

12.3.6 Indonesia - Market size and forecast 2024-2029

Chart on Indonesia - Market size and forecast 2024-2029 ($ million)
Data Table on Indonesia - Market size and forecast 2024-2029 ($ million)
Chart on Indonesia - Year-over-year growth 2024-2029 (%)
Data Table on Indonesia - Year-over-year growth 2024-2029 (%)

12.4 Europe - Market size and forecast 2024-2029

Chart on Europe - Market size and forecast 2024-2029 ($ million)
Data Table on Europe - Market size and forecast 2024-2029 ($ million)
Chart on Europe - Year-over-year growth 2024-2029 (%)
Data Table on Europe - Year-over-year growth 2024-2029 (%)
Chart on Regional Comparison - Europe
Data Table on Regional Comparison - Europe

12.4.1 Germany - Market size and forecast 2024-2029

Chart on Germany - Market size and forecast 2024-2029 ($ million)
Data Table on Germany - Market size and forecast 2024-2029 ($ million)
Chart on Germany - Year-over-year growth 2024-2029 (%)
Data Table on Germany - Year-over-year growth 2024-2029 (%)

12.4.2 France - Market size and forecast 2024-2029

Chart on France - Market size and forecast 2024-2029 ($ million)
Data Table on France - Market size and forecast 2024-2029 ($ million)
Chart on France - Year-over-year growth 2024-2029 (%)
Data Table on France - Year-over-year growth 2024-2029 (%)

12.4.3 UK - Market size and forecast 2024-2029

Chart on UK - Market size and forecast 2024-2029 ($ million)
Data Table on UK - Market size and forecast 2024-2029 ($ million)
Chart on UK - Year-over-year growth 2024-2029 (%)
Data Table on UK - Year-over-year growth 2024-2029 (%)

12.4.4 Italy - Market size and forecast 2024-2029

Chart on Italy - Market size and forecast 2024-2029 ($ million)
Data Table on Italy - Market size and forecast 2024-2029 ($ million)
Chart on Italy - Year-over-year growth 2024-2029 (%)
Data Table on Italy - Year-over-year growth 2024-2029 (%)

12.4.5 Spain - Market size and forecast 2024-2029

Chart on Spain - Market size and forecast 2024-2029 ($ million)
Data Table on Spain - Market size and forecast 2024-2029 ($ million)
Chart on Spain - Year-over-year growth 2024-2029 (%)
Data Table on Spain - Year-over-year growth 2024-2029 (%)

12.4.6 The Netherlands - Market size and forecast 2024-2029

Chart on The Netherlands - Market size and forecast 2024-2029 ($ million)
Data Table on The Netherlands - Market size and forecast 2024-2029 ($ million)
Chart on The Netherlands - Year-over-year growth 2024-2029 (%)
Data Table on The Netherlands - Year-over-year growth 2024-2029 (%)

12.5 North America - Market size and forecast 2024-2029

Chart on North America - Market size and forecast 2024-2029 ($ million)
Data Table on North America - Market size and forecast 2024-2029 ($ million)
Chart on North America - Year-over-year growth 2024-2029 (%)
Data Table on North America - Year-over-year growth 2024-2029 (%)
Chart on Regional Comparison - North America
Data Table on Regional Comparison - North America

12.5.1 US - Market size and forecast 2024-2029

Chart on US - Market size and forecast 2024-2029 ($ million)
Data Table on US - Market size and forecast 2024-2029 ($ million)
Chart on US - Year-over-year growth 2024-2029 (%)
Data Table on US - Year-over-year growth 2024-2029 (%)

12.5.2 Canada - Market size and forecast 2024-2029

Chart on Canada - Market size and forecast 2024-2029 ($ million)
Data Table on Canada - Market size and forecast 2024-2029 ($ million)
Chart on Canada - Year-over-year growth 2024-2029 (%)
Data Table on Canada - Year-over-year growth 2024-2029 (%)

12.5.3 Mexico - Market size and forecast 2024-2029

Chart on Mexico - Market size and forecast 2024-2029 ($ million)
Data Table on Mexico - Market size and forecast 2024-2029 ($ million)
Chart on Mexico - Year-over-year growth 2024-2029 (%)
Data Table on Mexico - Year-over-year growth 2024-2029 (%)

12.6 South America - Market size and forecast 2024-2029

Chart on South America - Market size and forecast 2024-2029 ($ million)
Data Table on South America - Market size and forecast 2024-2029 ($ million)
Chart on South America - Year-over-year growth 2024-2029 (%)
Data Table on South America - Year-over-year growth 2024-2029 (%)
Chart on Regional Comparison - South America
Data Table on Regional Comparison - South America

12.6.1 Brazil - Market size and forecast 2024-2029

Chart on Brazil - Market size and forecast 2024-2029 ($ million)
Data Table on Brazil - Market size and forecast 2024-2029 ($ million)
Chart on Brazil - Year-over-year growth 2024-2029 (%)
Data Table on Brazil - Year-over-year growth 2024-2029 (%)

12.6.2 Argentina - Market size and forecast 2024-2029

Chart on Argentina - Market size and forecast 2024-2029 ($ million)
Data Table on Argentina - Market size and forecast 2024-2029 ($ million)
Chart on Argentina - Year-over-year growth 2024-2029 (%)
Data Table on Argentina - Year-over-year growth 2024-2029 (%)

12.6.3 Chile - Market size and forecast 2024-2029

Chart on Chile - Market size and forecast 2024-2029 ($ million)
Data Table on Chile - Market size and forecast 2024-2029 ($ million)
Chart on Chile - Year-over-year growth 2024-2029 (%)
Data Table on Chile - Year-over-year growth 2024-2029 (%)

12.7 Middle East and Africa - Market size and forecast 2024-2029

Chart on Middle East and Africa - Market size and forecast 2024-2029 ($ million)
Data Table on Middle East and Africa - Market size and forecast 2024-2029 ($ million)
Chart on Middle East and Africa - Year-over-year growth 2024-2029 (%)
Data Table on Middle East and Africa - Year-over-year growth 2024-2029 (%)
Chart on Regional Comparison - Middle East and Africa
Data Table on Regional Comparison - Middle East and Africa

12.7.1 Turkey - Market size and forecast 2024-2029

Chart on Turkey - Market size and forecast 2024-2029 ($ million)
Data Table on Turkey - Market size and forecast 2024-2029 ($ million)
Chart on Turkey - Year-over-year growth 2024-2029 (%)
Data Table on Turkey - Year-over-year growth 2024-2029 (%)

12.7.2 Saudi Arabia - Market size and forecast 2024-2029

Chart on Saudi Arabia - Market size and forecast 2024-2029 ($ million)
Data Table on Saudi Arabia - Market size and forecast 2024-2029 ($ million)
Chart on Saudi Arabia - Year-over-year growth 2024-2029 (%)
Data Table on Saudi Arabia - Year-over-year growth 2024-2029 (%)

12.7.3 South Africa - Market size and forecast 2024-2029

Chart on South Africa - Market size and forecast 2024-2029 ($ million)
Data Table on South Africa - Market size and forecast 2024-2029 ($ million)
Chart on South Africa - Year-over-year growth 2024-2029 (%)
Data Table on South Africa - Year-over-year growth 2024-2029 (%)

12.7.4 UAE - Market size and forecast 2024-2029

Chart on UAE - Market size and forecast 2024-2029 ($ million)
Data Table on UAE - Market size and forecast 2024-2029 ($ million)
Chart on UAE - Year-over-year growth 2024-2029 (%)
Data Table on UAE - Year-over-year growth 2024-2029 (%)

12.7.5 Egypt - Market size and forecast 2024-2029

Chart on Egypt - Market size and forecast 2024-2029 ($ million)
Data Table on Egypt - Market size and forecast 2024-2029 ($ million)
Chart on Egypt - Year-over-year growth 2024-2029 (%)
Data Table on Egypt - Year-over-year growth 2024-2029 (%)

12.8 Market opportunity by geography

Market opportunity by geography ($ million)
Data Tables on Market opportunity by geography ($ million)

13. Drivers, Challenges, and Opportunity

13.1 Market drivers

Sustained growth in global infrastructure and construction activity
Increasing adoption of basalt fiber in high-performance composite applications
Escalating investments in transportation modernization and expansion

13.2 Market challenges

High logistics costs and intrinsic regional market fragmentation
Stringent environmental regulations and complex permitting processes
High capital investment and technological barriers in value-added production

13.3 Impact of drivers and challenges

Impact of drivers and challenges in 2024 and 2029

13.4 Market opportunities

Growing emphasis on sustainability and circular economy
Rise of hybrid composites and advanced material formulations
Integration of digital technologies and automation in production

14. Competitive Landscape

14.1 Overview

14.2

Overview on criticality of inputs and factors of differentiation

14.3 Landscape disruption

Overview on factors of disruption

14.4 Industry risks

Impact of key risks on business

15. Competitive Analysis

15.1 Companies profiled

Companies covered

15.2 Company ranking index

15.3 Market positioning of companies

Matrix on companies position and classification

15.4 Albarrie Canada Ltd.

Albarrie Canada Ltd. - Overview
Albarrie Canada Ltd. - Product / Service
Albarrie Canada Ltd. - Key offerings
SWOT

15.5 Arab Basalt Fiber

Arab Basalt Fiber - Overview
Arab Basalt Fiber - Product / Service
Arab Basalt Fiber - Key offerings
SWOT

15.6 Aravali India Marbles

Aravali India Marbles - Overview
Aravali India Marbles - Product / Service
Aravali India Marbles - Key offerings
SWOT

15.7 Basalt Engineering LLC

Basalt Engineering LLC - Overview
Basalt Engineering LLC - Product / Service
Basalt Engineering LLC - Key offerings
SWOT

15.8 Basalt Fiber Tech

Basalt Fiber Tech - Overview
Basalt Fiber Tech - Product / Service
Basalt Fiber Tech - Key offerings
SWOT

15.9 BASALTEX NV

BASALTEX NV - Overview
BASALTEX NV - Product / Service
BASALTEX NV - Key offerings
SWOT

15.10 BASFIBER TRADE LLC

BASFIBER TRADE LLC - Overview
BASFIBER TRADE LLC - Product / Service
BASFIBER TRADE LLC - Key offerings
SWOT

15.11 Deutsche Basalt Faser GmbH

Deutsche Basalt Faser GmbH - Overview
Deutsche Basalt Faser GmbH - Product / Service
Deutsche Basalt Faser GmbH - Key offerings
SWOT

15.12 ISOMATEX SA

ISOMATEX SA - Overview
ISOMATEX SA - Product / Service
ISOMATEX SA - Key offerings
SWOT

15.13 Jumeisheng Co. Ltd.

Jumeisheng Co. Ltd. - Overview
Jumeisheng Co. Ltd. - Product / Service
Jumeisheng Co. Ltd. - Key offerings
SWOT

15.14 Kamenny Vek

Kamenny Vek - Overview
Kamenny Vek - Product / Service
Kamenny Vek - Key offerings
SWOT

15.15 ROCKWOOL AS

ROCKWOOL AS - Overview
ROCKWOOL AS - Business segments
ROCKWOOL AS - Key offerings
ROCKWOOL AS - Segment focus
SWOT

15.16 Sudaglass Fiber Technology Inc.

Sudaglass Fiber Technology Inc. - Overview
Sudaglass Fiber Technology Inc. - Product / Service
Sudaglass Fiber Technology Inc. - Key offerings
SWOT

15.17 Technobasalt LLC

Technobasalt LLC - Overview
Technobasalt LLC - Product / Service
Technobasalt LLC - Key offerings
SWOT

15.18 Zhejiang GBF Basalt Fiber

Zhejiang GBF Basalt Fiber - Overview
Zhejiang GBF Basalt Fiber - Product / Service
Zhejiang GBF Basalt Fiber - Key offerings
SWOT

16. Appendix

16.1 Scope of the report

Market definition
Objectives
Notes and caveats

16.2 Inclusions and exclusions checklist

Inclusions checklist
Exclusions checklist

16.3 Currency conversion rates for US$

16.4 Research methodology

16.5 Data procurement

Information sources

16.6 Data validation

16.7 Validation techniques employed for market sizing

16.8 Data synthesis

16.9 360 degree market analysis

16.10 List of abbreviations

Research Methodology

Technavio presents a detailed picture of the market by way of study, synthesis, and summation of data from multiple sources. The analysts have presented the various facets of the market with a particular focus on identifying the key industry influencers. The data thus presented is comprehensive, reliable, and the result of extensive research, both primary and secondary.

INFORMATION SOURCES

Primary sources

  • Manufacturers and suppliers
  • Channel partners
  • Industry experts
  • Strategic decision makers

Secondary sources

  • Industry journals and periodicals
  • Government data
  • Financial reports of key industry players
  • Historical data
  • Press releases

DATA ANALYSIS

Data Synthesis

  • Collation of data
  • Estimation of key figures
  • Analysis of derived insights

Data Validation

  • Triangulation with data models
  • Reference against proprietary databases
  • Corroboration with industry experts

REPORT WRITING

Qualitative

  • Market drivers
  • Market challenges
  • Market trends
  • Five forces analysis

Quantitative

  • Market size and forecast
  • Market segmentation
  • Geographical insights
  • Competitive landscape

Interested in this report?

Get your sample now to see our research methodology and insights!

Download Now

Frequently Asked Questions

Basalt Rock market growth will increase by USD 788.9 million during 2025-2029 .

The Basalt Rock market is expected to grow at a CAGR of 7% during 2025-2029 .

Basalt Rock market is segmented by Type (Natural basalt, Synthetic basalt) End-user (Building and construction, Infrastructure, Automotive and transportation, Aerospace and defense, Others) Product type (Basalt fiber, Basalt aggregates, Basalt tiles or slabs, Others)

Albarrie Canada Ltd., Arab Basalt Fiber, Aravali India Marbles, Basalt Engineering LLC, Basalt Fiber Tech, Basalt International, BASALTEX NV, BASFIBER TRADE LLC, Deutsche Basalt Faser GmbH, ISOMATEX SA, Jilin Tongxin Basalt, Jumeisheng Co. Ltd., Kamenny Vek, ROCKWOOL AS, Sudaglass Fiber Technology Inc., Technobasalt LLC, Zhejiang GBF Basalt Fiber are a few of the key vendors in the Basalt Rock market.

APAC will register the highest growth rate of 52.7% among the other regions. Therefore, the Basalt Rock market in APAC is expected to garner significant business opportunities for the vendors during the forecast period.

China, India, Japan, South Korea, Australia, Indonesia, Germany, France, UK, Italy, Spain, The Netherlands, US, Canada, Mexico, Brazil, Argentina, Chile, Turkey, Saudi Arabia, South Africa, UAE, Egypt

  • Sustained growth in global infrastructure and construction activity is the driving factor this market.

The Basalt Rock market vendors should focus on grabbing business opportunities from the Type segment as it accounted for the largest market share in the base year.