Beer Market Analysis, Size, and Forecast 2026-2030: APAC (China, India, and Japan), Europe (Germany, UK, and France), North America (US, Mexico, and Canada), South America (Brazil, Argentina, and Colombia), Middle East and Africa (South Africa, Turkey, and UAE), and Rest of World (ROW)

Beer Market Analysis, Size, and Forecast 2026-2030:
APAC (China, India, and Japan), Europe (Germany, UK, and France), North America (US, Mexico, and Canada), South America (Brazil, Argentina, and Colombia), Middle East and Africa (South Africa, Turkey, and UAE), and Rest of World (ROW)

Published: Mar 2026 292 Pages SKU: IRTNTR40198

Market Overview at a Glance

$292.9 B
Market Opportunity
5.9%
CAGR 2025 - 2030
36.8%
APAC Growth
$460.8 B
Bottles segment 2024

Beer Market Size 2026-2030

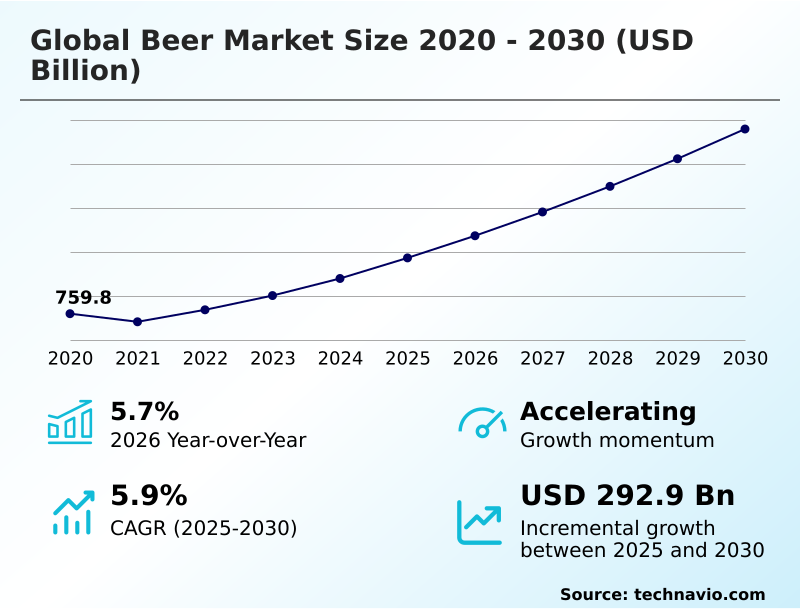
The beer market size is valued to increase by USD 292.9 billion, at a CAGR of 5.9% from 2025 to 2030. Intensification of premiumization trend and craft segment maturation will drive the beer market.

Major Market Trends & Insights

  • APAC dominated the market and accounted for a 36.8% growth during the forecast period.
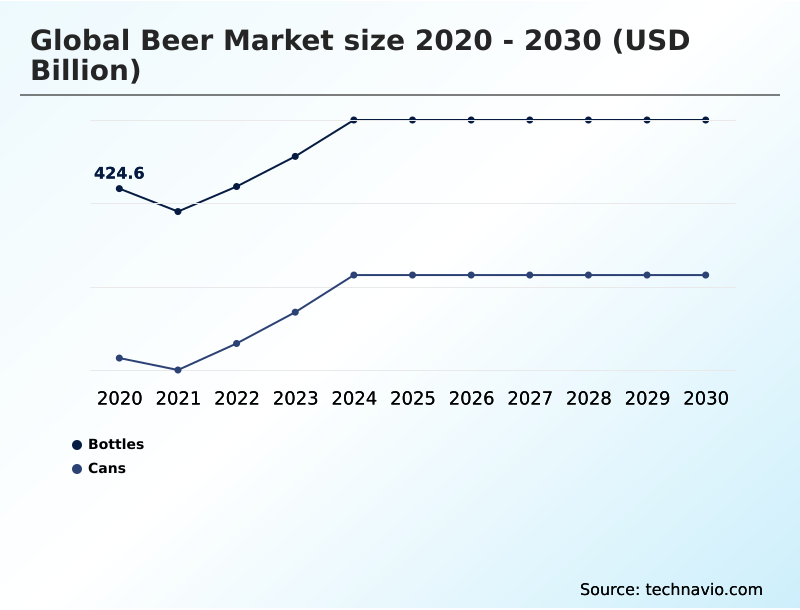
  • By Packaging - Bottles segment was valued at USD 460.8 billion in 2024
  • By Distribution Channel - On-trade segment accounted for the largest market revenue share in 2024

Market Size & Forecast

  • Market Opportunities: USD 419.7 billion
  • Market Future Opportunities: USD 292.9 billion
  • CAGR from 2025 to 2030 : 5.9%

Market Summary

  • The beer market is undergoing a significant transformation, driven by evolving consumer preferences and technological advancements. The premiumization trend continues to be a major force, with both macro breweries and an increasing number of craft breweries focusing on high-quality ingredients, including specialty malts and exotic hop varieties, to create premium lager and diverse ale styles.
  • This shift toward quality over quantity is steering the brewing industry toward greater innovation. A parallel driver is the rising demand for healthier options, which has propelled the growth of low-abv beer and non-alcoholic beer. Advanced dealcoholization process technologies are critical, allowing producers to create flavorful alternatives that meet consumer wellness goals.
  • For instance, a common business scenario involves optimizing the beer distribution network through supply chain verticalization and brewing process automation.
  • By integrating predictive analytics, a company can better forecast demand, streamline cold-chain logistics, and reduce transport costs by over 15%, ensuring both operational resilience and profit margin optimization in a competitive landscape defined by both on-trade distribution and expanding e-commerce beverage sales.

What will be the Size of the Beer Market during the forecast period?

Get Key Insights on Market Forecast (PDF) Request Free Sample

How is the Beer Market Segmented?

The beer industry research report provides comprehensive data (region-wise segment analysis), with forecasts and estimates in "USD billion" for the period 2026-2030, as well as historical data from 2020-2024 for the following segments.

  • Packaging
    • Bottles
    • Cans
  • Distribution channel
    • On-trade
    • Off-trade
  • Product type
    • Lager
    • Ale
    • Stouts
    • Others
  • Geography
    • APAC
      • China
      • India
      • Japan
    • Europe
      • Germany
      • UK
      • France
    • North America
      • US
      • Mexico
      • Canada
    • South America
      • Brazil
      • Argentina
      • Colombia
    • Middle East and Africa
      • South Africa
      • Turkey
      • UAE
    • Rest of World (ROW)

By Packaging Insights

The bottles segment is estimated to witness significant growth during the forecast period.

The bottles segment is a cornerstone of the beer market, intrinsically linked to the premiumization trend and the heritage of artisanal brewing. Glass is preferred for its superior ability in organoleptic properties preservation, protecting premium lager from oxygen and moisture.

The segment is evolving through the adoption of lightweighting technologies and increased use of post-consumer recycled cullet, driven by circular economy initiatives.

These advancements enhance sustainability and can reduce shipping weights by over 10%, optimizing logistics without compromising the durable packaging solutions consumers associate with high-end products.

As brewers focus on differentiation, the tactile and branding potential of glass remains critical for market positioning, especially for heritage and craft offerings.

Request Free Sample

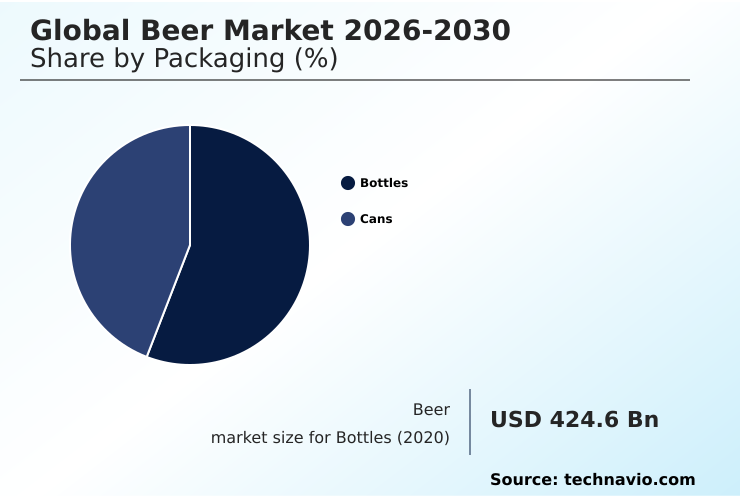
The Bottles segment was valued at USD 460.8 billion in 2024 and showed a gradual increase during the forecast period.

Request Free Sample

Regional Analysis

APAC is estimated to contribute 36.8% to the growth of the global market during the forecast period.Technavio’s analysts have elaborately explained the regional trends and drivers that shape the market during the forecast period.

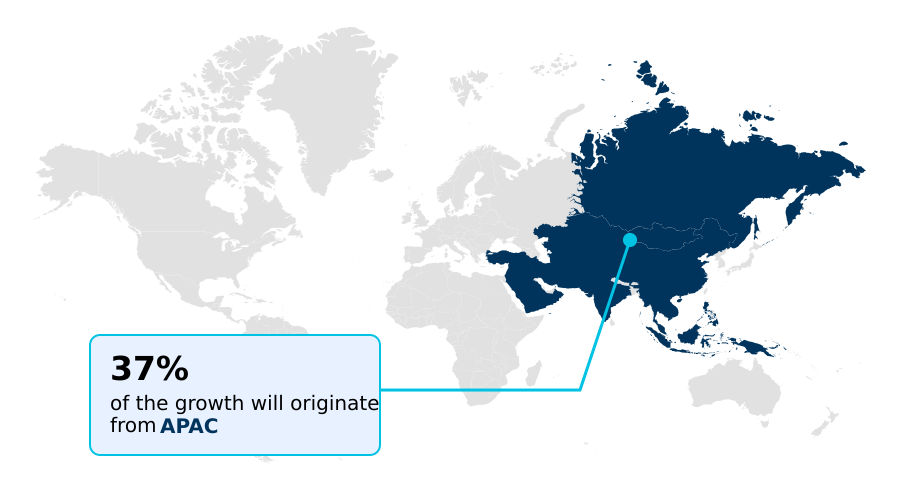
See How Beer Market Demand is Rising in APAC Request Free Sample

The beer market's growth is predominantly led by the APAC region, which is set to contribute over 36% of the market's incremental growth, outpacing North America and Europe.

In this region, rising disposable incomes are fueling a shift from economy-tier products to premium offerings, driving value. Innovation is centered on local tastes, with a surge in flavored beer and unique styles that resonate with regional palates.

This contrasts with Europe, where traditional lager brewing and stylistic heritage remain central, though demand for wheat beer is also strong. Effective beer distribution is key, with a focus on off-trade retail optimization through e-commerce and modern retail formats.

Concurrently, a revitalized on-trade channel strategy is crucial for brand-building and capturing high-margin sales in urban centers across all major regions.

Market Dynamics

Our researchers analyzed the data with 2025 as the base year, along with the key drivers, trends, and challenges. A holistic analysis of drivers will help companies refine their marketing strategies to gain a competitive advantage.

  • Analyzing the future of the global beer market reveals complex dynamics. The impact of premiumization on beer market is profound, shifting value away from volume and forcing innovation. A key aspect is the growth of non-alcoholic beer category, driven by health and wellness trends in beer. This necessitates technological advancements in beer production, particularly in flavor preservation.
  • Strategic decisions increasingly involve supply chain verticalization in brewing to counter rising ingredient costs and ensure stability, a more pressing concern for many firms than typical commodity price swings of 5-10%. The role of craft breweries in market evolution remains pivotal, as they often pioneer new styles and direct-to-consumer beer sales models.
  • However, the regulatory impact on beer marketing, including restrictions on digital advertising, presents a significant hurdle. Understanding on-trade vs off-trade channel dynamics is crucial as consumer purchasing habits evolve. There is also rising beer market competition from substitutes like seltzers and spirits.
  • The lager renaissance and market impact show a return to classic, high-quality styles, aligning with consumer preference for premium lagers. For new entrants, developing effective strategies for craft beer market entry requires navigating these trends, from AI applications in brewing industry to sustainability trends in beer packaging.
  • Ultimately, success depends on addressing the challenges of shifting consumer demographics and understanding regional beer market growth drivers.

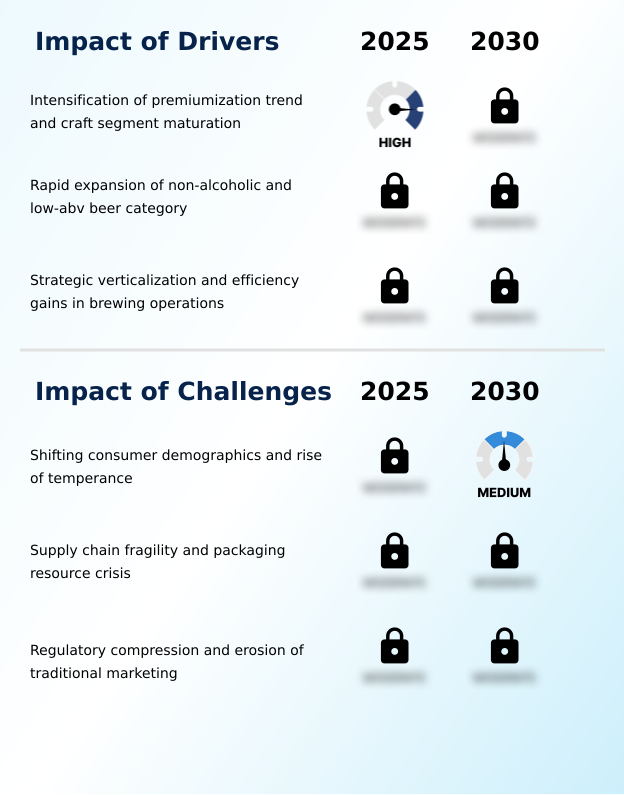
What are the key market drivers leading to the rise in the adoption of Beer Industry?

  • The intensification of the premiumization trend, coupled with the maturation of the craft segment, serves as a key driver for market growth.

  • The sustained consumer shift toward the premiumization trend is a primary market driver, fueled by craft segment maturation and a demand for unique flavor profiles from specialty malts and exotic hop varieties.
  • This allows for higher margins, offsetting raw material cost fluctuations. Concurrently, the rapid expansion of non-alcoholic variants and low-abv beer, driven by health consciousness, is reshaping the industry.
  • Advancements in the dealcoholization process preserve taste while meeting wellness demands, expanding the consumer base by over 15% in certain demographics. To enhance operational resilience, firms are pursuing strategic supply chain verticalization.
  • For example, one major player’s reacquisition of a 49.9% stake in its container plants ensures cost efficiency and insulates operations from external market shocks, providing a foundation for sustainable growth.

What are the market trends shaping the Beer Industry?

  • A strategic pivot toward premiumization and a renaissance in the lager category are defining the market's upcoming trajectory.

  • The beer market is rebalancing around a lager renaissance, where consumers prioritize quality over novelty. This trend, a core part of beer premiumization, sees macro-breweries and craft breweries alike focusing on well-executed classic styles.
  • Simultaneously, the brewing industry is seeing radical integration of agentic AI adoption, where predictive analytics optimize everything from recipe formulation in ale brewing to production schedules, improving forecast accuracy by over 18%. Packaging is also evolving, with aluminum cans gaining favor for their ability in photodegradation prevention.
  • This is coupled with the rise of sophisticated direct-to-consumer logistics, enabling smaller producers to bypass traditional retail channels and reach a wider audience, which is a significant shift in the competitive landscape.

What challenges does the Beer Industry face during its growth?

  • Shifting consumer demographics and the rise of temperance present a key challenge to industry growth.

  • The beer market faces pressure from shifting consumer demographics, as younger cohorts consume less alcohol, challenging both macro breweries and microbreweries. This trend forces investment in non-alcoholic alternatives to avoid permanent volume loss. Profit margin optimization becomes difficult amid persistent supply chain fragility, with volatile aluminum and glass costs compressing earnings.
  • A recent regional regulatory shift, for instance, created a shortfall of 130 million can units, highlighting the need for supply chain fragility mitigation. Furthermore, an intensifying regulatory environment, including the implementation of minimum unit pricing (MUP) and the threat of increased excise tax compliance burdens, restricts marketing and erodes the effectiveness of price-based promotions.
  • These factors create high barriers to entry and diminish the viability of traditional marketing channels.

Exclusive Technavio Analysis on Customer Landscape

The beer market forecasting report includes the adoption lifecycle of the market, covering from the innovator’s stage to the laggard’s stage. It focuses on adoption rates in different regions based on penetration. Furthermore, the beer market report also includes key purchase criteria and drivers of price sensitivity to help companies evaluate and develop their market growth analysis strategies.

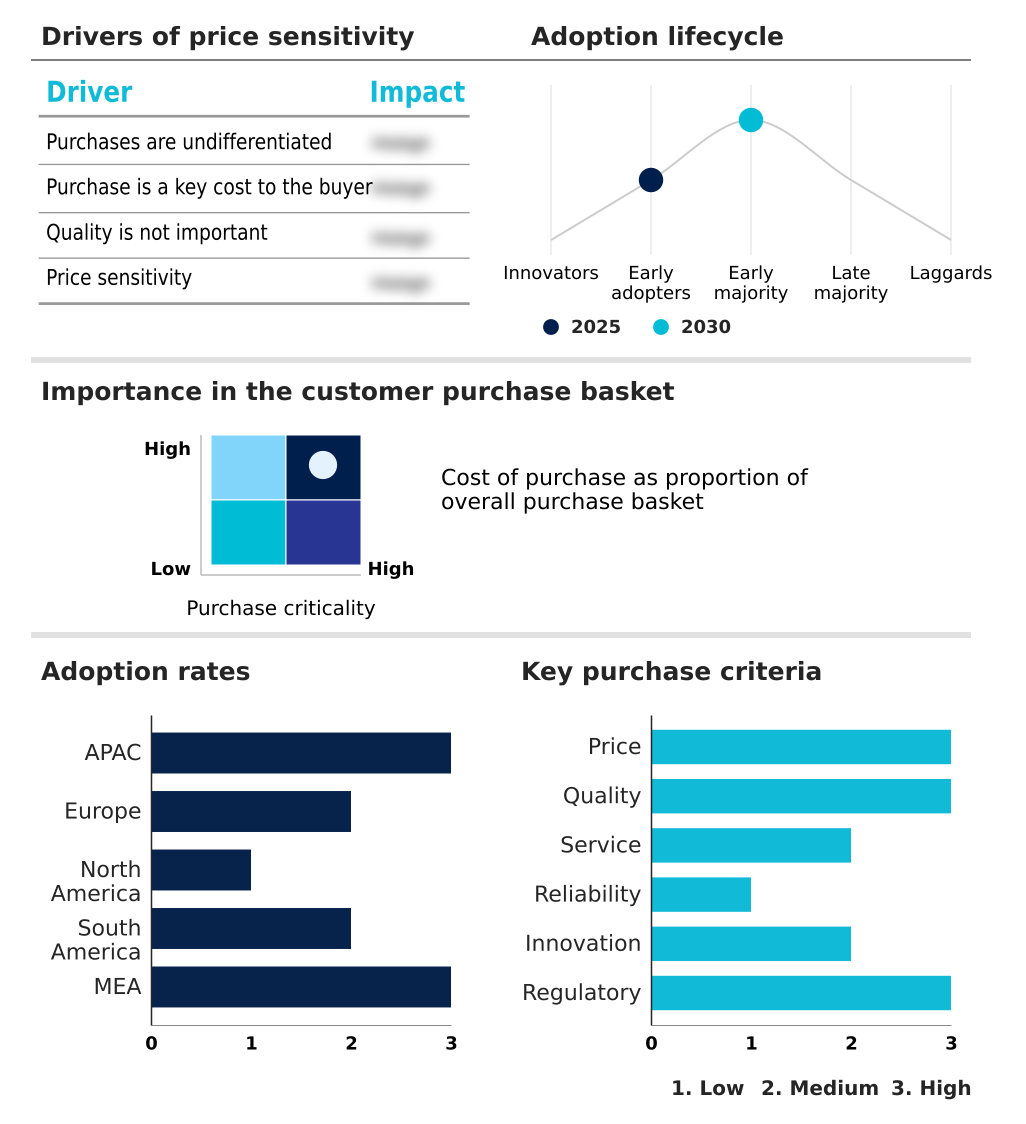
Customer Landscape of Beer Industry

Competitive Landscape

Companies are implementing various strategies, such as strategic alliances, beer market forecast, partnerships, mergers and acquisitions, geographical expansion, and product/service launches, to enhance their presence in the industry.

AleSmith Brewing Co. - This entity is recognized for its award-winning, handcrafted ales, which are distinguished by their bold flavor profiles and commitment to artisanal quality.

The industry research and growth report includes detailed analyses of the competitive landscape of the market and information about key companies, including:

  • AleSmith Brewing Co.
  • Anheuser Busch InBev SA NV
  • Asahi Group Holdings Ltd.
  • BrewDog Plc
  • Carlsberg Breweries AS
  • Cloudwater Brew Co.
  • Diageo PLC
  • Duvel Moortgat NV
  • East 9th Brewing Co.
  • Forbidden Root
  • Heineken NV
  • Kirin Holdings Co. Ltd.
  • Mikkeller APS
  • Mission Brewery
  • Molson Coors Beverage Co.
  • Saranac Brewery
  • Sierra Nevada Brewing Co.
  • Sprecher
  • Swinkels Family Brewers
  • The Boston Beer Co. Inc.

Qualitative and quantitative analysis of companies has been conducted to help clients understand the wider business environment as well as the strengths and weaknesses of key industry players. Data is qualitatively analyzed to categorize companies as pure play, category-focused, industry-focused, and diversified; it is quantitatively analyzed to categorize companies as dominant, leading, strong, tentative, and weak.

Recent Development and News in Beer market

  • In April 2025, The Bureau of Indian Standards implemented mandatory Quality Control Orders in India, creating a severe supply squeeze and a shortfall of approximately 130 million 500-milliliter cans during the peak summer consumption period.
  • In April 2025, The Brewers Association reported that the total number of breweries in the United States increased to nine thousand nine hundred twenty-two, indicating a persistent trend toward market diversification.
  • In March 2025, GE Aerospace announced a substantial $1 billion investment to modernize its manufacturing facilities, a development highlighting cross-industry advancements in high-precision manufacturing and material efficiency that influence the standards of the modern glass bottling industry.
  • In January 2025, United Breweries Limited introduced two new Kingfisher flavored beers, Lemon Masala and Mango Berry Twist, in India to appeal to the evolving tastes of younger consumers and diversify its product portfolio.

Dive into Technavio’s robust research methodology, blending expert interviews, extensive data synthesis, and validated models for unparalleled Beer Market insights. See full methodology.

Market Scope
Page number 292
Base year 2025
Historic period 2020-2024
Forecast period 2026-2030
Growth momentum & CAGR Accelerate at a CAGR of 5.9%
Market growth 2026-2030 USD 292.9 billion
Market structure Fragmented
YoY growth 2025-2026(%) 5.7%
Key countries China, India, Japan, Australia, South Korea, Indonesia, Germany, UK, France, Russia, Italy, Spain, US, Mexico, Canada, Brazil, Argentina, Colombia, South Africa, Turkey, Egypt, Nigeria and UAE
Competitive landscape Leading Companies, Market Positioning of Companies, Competitive Strategies, and Industry Risks

Request Free Sample

Research Analyst Overview

  • The beer market's evolution is shaped by the consumer-driven premiumization trend and craft segment maturation. Boardroom decisions now hinge on excise tax compliance and navigating regulations like minimum unit pricing. The lager renaissance is met with agentic AI adoption, where digital brewing techniques and fermentation monitoring are standard.
  • Predictive maintenance algorithms and computer vision for quality control are boosting efficiency, with defect detection now exceeding 99% accuracy. Supply chain fragility mitigation is driving supply chain verticalization and the use of digital tracking systems. Core processes like the dealcoholization technology and top-fermented process are refined for non-alcoholic variants and artisanal ales.
  • Brewers focus on organoleptic properties preservation through technologies that enable photodegradation prevention. Sustainability is key, with circular economy initiatives, use of post-consumer recycled cullet, and carbon capture technologies. Lightweighting technologies and water-efficient brewing technologies aid cost efficiency in brewing. The focus is on operational resilience, profit margin optimization, and managing alcohol by volume while ensuring caloric content transparency.
  • This is all enabled by direct-to-consumer logistics, advanced on-trade channel strategy, and off-trade retail optimization to deliver ready-to-drink formulation and other products.

What are the Key Data Covered in this Beer Market Research and Growth Report?

  • What is the expected growth of the Beer Market between 2026 and 2030?

    • USD 292.9 billion, at a CAGR of 5.9%

  • What segmentation does the market report cover?

    • The report is segmented by Packaging (Bottles, and Cans), Distribution Channel (On-trade, and Off-trade), Product Type (Lager, Ale, Stouts, and Others) and Geography (APAC, Europe, North America, South America, Middle East and Africa)

  • Which regions are analyzed in the report?

    • APAC, Europe, North America, South America and Middle East and Africa

  • What are the key growth drivers and market challenges?

    • Intensification of premiumization trend and craft segment maturation, Shifting consumer demographics and rise of temperance

  • Who are the major players in the Beer Market?

    • AleSmith Brewing Co., Anheuser Busch InBev SA NV, Asahi Group Holdings Ltd., BrewDog Plc, Carlsberg Breweries AS, Cloudwater Brew Co., Diageo PLC, Duvel Moortgat NV, East 9th Brewing Co., Forbidden Root, Heineken NV, Kirin Holdings Co. Ltd., Mikkeller APS, Mission Brewery, Molson Coors Beverage Co., Saranac Brewery, Sierra Nevada Brewing Co., Sprecher, Swinkels Family Brewers and The Boston Beer Co. Inc.

Market Research Insights

  • The global beer market is defined by key dynamics, from artisanal brewing and craft beer production to the dominance of macro breweries. The brewing industry is seeing a push for beer premiumization in premium lager, while also expanding into low-abv beer and non-alcoholic beer using an advanced dealcoholization process.
  • Innovation in lager brewing, ale brewing, and stout brewing now includes specialty malts and exotic hop varieties. The beer market ecosystem includes microbreweries and craft breweries leveraging direct-to-consumer beer sales and e-commerce beverage sales, challenging traditional on-trade distribution and off-trade distribution models. Brewing process automation and fermentation cycle optimization improve efficiency, with some systems reducing process deviations by 25%.
  • Strategic supply chain verticalization is being adopted for better control over beer distribution, while demand for flavored beer, wheat beer, and malt beverage grows, all requiring durable packaging solutions.

We can help! Our analysts can customize this beer market research report to meet your requirements.

Get in touch

1. Executive Summary

1.1 Market overview

Executive Summary - Chart on Market Overview
Executive Summary - Data Table on Market Overview
Executive Summary - Chart on Global Market Characteristics
Executive Summary - Chart on Market by Geography
Executive Summary - Chart on Market Segmentation by Packaging
Executive Summary - Chart on Market Segmentation by Distribution Channel
Executive Summary - Chart on Market Segmentation by Product Type
Executive Summary - Chart on Incremental Growth
Executive Summary - Data Table on Incremental Growth
Executive Summary - Chart on Company Market Positioning

2. Technavio Analysis

2.1 Analysis of price sensitivity, lifecycle, customer purchase basket, adoption rates, and purchase criteria

2.2 Criticality of inputs and Factors of differentiation

Chart on Overview on criticality of inputs and factors of differentiation

2.3 Factors of disruption

Chart on Overview on factors of disruption

2.4 Impact of drivers and challenges

Chart on Impact of drivers and challenges in 2025 and 2030

3. Market Landscape

3.1 Market ecosystem

Chart on Parent Market
Data Table on - Parent Market

3.2 Market characteristics

Chart on Market characteristics analysis

3.3 Value chain analysis

Chart on Value chain analysis

4. Market Sizing

4.1 Market definition

Data Table on Offerings of companies included in the market definition

4.2 Market segment analysis

Market segments

4.3 Market size 2025

4.4 Market outlook: Forecast for 2025-2030

Chart on Global - Market size and forecast 2025-2030 ($ billion)
Data Table on Global - Market size and forecast 2025-2030 ($ billion)
Chart on Global Market: Year-over-year growth 2025-2030 (%)
Data Table on Global Market: Year-over-year growth 2025-2030 (%)

5. Historic Market Size

5.1 Global Beer Market 2020 - 2024

Historic Market Size - Data Table on Global Beer Market 2020 - 2024 ($ billion)

5.2 Packaging segment analysis 2020 - 2024

Historic Market Size - Packaging Segment 2020 - 2024 ($ billion)

5.3 Distribution Channel segment analysis 2020 - 2024

Historic Market Size - Distribution Channel Segment 2020 - 2024 ($ billion)

5.4 Product Type segment analysis 2020 - 2024

Historic Market Size - Product Type Segment 2020 - 2024 ($ billion)

5.5 Geography segment analysis 2020 - 2024

Historic Market Size - Geography Segment 2020 - 2024 ($ billion)

5.6 Country segment analysis 2020 - 2024

Historic Market Size - Country Segment 2020 - 2024 ($ billion)

6. Qualitative Analysis

6.1 Impact of AI in global beer market

7. Five Forces Analysis

7.1 Five forces summary

Five forces analysis - Comparison between 2025 and 2030

7.2 Bargaining power of buyers

Bargaining power of buyers - Impact of key factors 2025 and 2030

7.3 Bargaining power of suppliers

Bargaining power of suppliers - Impact of key factors in 2025 and 2030

7.4 Threat of new entrants

Threat of new entrants - Impact of key factors in 2025 and 2030

7.5 Threat of substitutes

Threat of substitutes - Impact of key factors in 2025 and 2030

7.6 Threat of rivalry

Threat of rivalry - Impact of key factors in 2025 and 2030

7.7 Market condition

Chart on Market condition - Five forces 2025 and 2030

8. Market Segmentation by Packaging

8.1 Market segments

Chart on Packaging - Market share 2025-2030 (%)
Data Table on Packaging - Market share 2025-2030 (%)

8.2 Comparison by Packaging

Chart on Comparison by Packaging
Data Table on Comparison by Packaging

8.3 Bottles - Market size and forecast 2025-2030

Chart on Bottles - Market size and forecast 2025-2030 ($ billion)
Data Table on Bottles - Market size and forecast 2025-2030 ($ billion)
Chart on Bottles - Year-over-year growth 2025-2030 (%)
Data Table on Bottles - Year-over-year growth 2025-2030 (%)

8.4 Cans - Market size and forecast 2025-2030

Chart on Cans - Market size and forecast 2025-2030 ($ billion)
Data Table on Cans - Market size and forecast 2025-2030 ($ billion)
Chart on Cans - Year-over-year growth 2025-2030 (%)
Data Table on Cans - Year-over-year growth 2025-2030 (%)

8.5 Market opportunity by Packaging

Market opportunity by Packaging ($ billion)
Data Table on Market opportunity by Packaging ($ billion)

9. Market Segmentation by Distribution Channel

9.1 Market segments

Chart on Distribution Channel - Market share 2025-2030 (%)
Data Table on Distribution Channel - Market share 2025-2030 (%)

9.2 Comparison by Distribution Channel

Chart on Comparison by Distribution Channel
Data Table on Comparison by Distribution Channel

9.3 On-trade - Market size and forecast 2025-2030

Chart on On-trade - Market size and forecast 2025-2030 ($ billion)
Data Table on On-trade - Market size and forecast 2025-2030 ($ billion)
Chart on On-trade - Year-over-year growth 2025-2030 (%)
Data Table on On-trade - Year-over-year growth 2025-2030 (%)

9.4 Off-trade - Market size and forecast 2025-2030

Chart on Off-trade - Market size and forecast 2025-2030 ($ billion)
Data Table on Off-trade - Market size and forecast 2025-2030 ($ billion)
Chart on Off-trade - Year-over-year growth 2025-2030 (%)
Data Table on Off-trade - Year-over-year growth 2025-2030 (%)

9.5 Market opportunity by Distribution Channel

Market opportunity by Distribution Channel ($ billion)
Data Table on Market opportunity by Distribution Channel ($ billion)

10. Market Segmentation by Product Type

10.1 Market segments

Chart on Product Type - Market share 2025-2030 (%)
Data Table on Product Type - Market share 2025-2030 (%)

10.2 Comparison by Product Type

Chart on Comparison by Product Type
Data Table on Comparison by Product Type

10.3 Lager - Market size and forecast 2025-2030

Chart on Lager - Market size and forecast 2025-2030 ($ billion)
Data Table on Lager - Market size and forecast 2025-2030 ($ billion)
Chart on Lager - Year-over-year growth 2025-2030 (%)
Data Table on Lager - Year-over-year growth 2025-2030 (%)

10.4 Ale - Market size and forecast 2025-2030

Chart on Ale - Market size and forecast 2025-2030 ($ billion)
Data Table on Ale - Market size and forecast 2025-2030 ($ billion)
Chart on Ale - Year-over-year growth 2025-2030 (%)
Data Table on Ale - Year-over-year growth 2025-2030 (%)

10.5 Stouts - Market size and forecast 2025-2030

Chart on Stouts - Market size and forecast 2025-2030 ($ billion)
Data Table on Stouts - Market size and forecast 2025-2030 ($ billion)
Chart on Stouts - Year-over-year growth 2025-2030 (%)
Data Table on Stouts - Year-over-year growth 2025-2030 (%)

10.6 Others - Market size and forecast 2025-2030

Chart on Others - Market size and forecast 2025-2030 ($ billion)
Data Table on Others - Market size and forecast 2025-2030 ($ billion)
Chart on Others - Year-over-year growth 2025-2030 (%)
Data Table on Others - Year-over-year growth 2025-2030 (%)

10.7 Market opportunity by Product Type

Market opportunity by Product Type ($ billion)
Data Table on Market opportunity by Product Type ($ billion)

11. Customer Landscape

11.1 Customer landscape overview

Analysis of price sensitivity, lifecycle, customer purchase basket, adoption rates, and purchase criteria

12. Geographic Landscape

12.1 Geographic segmentation

Chart on Market share by geography 2025-2030 (%)
Data Table on Market share by geography 2025-2030 (%)

12.2 Geographic comparison

Chart on Geographic comparison
Data Table on Geographic comparison

12.3 APAC - Market size and forecast 2025-2030

Chart on APAC - Market size and forecast 2025-2030 ($ billion)
Data Table on APAC - Market size and forecast 2025-2030 ($ billion)
Chart on APAC - Year-over-year growth 2025-2030 (%)
Data Table on APAC - Year-over-year growth 2025-2030 (%)
Chart on Regional Comparison - APAC
Data Table on Regional Comparison - APAC

12.3.1 China - Market size and forecast 2025-2030

Chart on China - Market size and forecast 2025-2030 ($ billion)
Data Table on China - Market size and forecast 2025-2030 ($ billion)
Chart on China - Year-over-year growth 2025-2030 (%)
Data Table on China - Year-over-year growth 2025-2030 (%)

12.3.2 India - Market size and forecast 2025-2030

Chart on India - Market size and forecast 2025-2030 ($ billion)
Data Table on India - Market size and forecast 2025-2030 ($ billion)
Chart on India - Year-over-year growth 2025-2030 (%)
Data Table on India - Year-over-year growth 2025-2030 (%)

12.3.3 Japan - Market size and forecast 2025-2030

Chart on Japan - Market size and forecast 2025-2030 ($ billion)
Data Table on Japan - Market size and forecast 2025-2030 ($ billion)
Chart on Japan - Year-over-year growth 2025-2030 (%)
Data Table on Japan - Year-over-year growth 2025-2030 (%)

12.3.4 Australia - Market size and forecast 2025-2030

Chart on Australia - Market size and forecast 2025-2030 ($ billion)
Data Table on Australia - Market size and forecast 2025-2030 ($ billion)
Chart on Australia - Year-over-year growth 2025-2030 (%)
Data Table on Australia - Year-over-year growth 2025-2030 (%)

12.3.5 South Korea - Market size and forecast 2025-2030

Chart on South Korea - Market size and forecast 2025-2030 ($ billion)
Data Table on South Korea - Market size and forecast 2025-2030 ($ billion)
Chart on South Korea - Year-over-year growth 2025-2030 (%)
Data Table on South Korea - Year-over-year growth 2025-2030 (%)

12.3.6 Indonesia - Market size and forecast 2025-2030

Chart on Indonesia - Market size and forecast 2025-2030 ($ billion)
Data Table on Indonesia - Market size and forecast 2025-2030 ($ billion)
Chart on Indonesia - Year-over-year growth 2025-2030 (%)
Data Table on Indonesia - Year-over-year growth 2025-2030 (%)

12.4 Europe - Market size and forecast 2025-2030

Chart on Europe - Market size and forecast 2025-2030 ($ billion)
Data Table on Europe - Market size and forecast 2025-2030 ($ billion)
Chart on Europe - Year-over-year growth 2025-2030 (%)
Data Table on Europe - Year-over-year growth 2025-2030 (%)
Chart on Regional Comparison - Europe
Data Table on Regional Comparison - Europe

12.4.1 Germany - Market size and forecast 2025-2030

Chart on Germany - Market size and forecast 2025-2030 ($ billion)
Data Table on Germany - Market size and forecast 2025-2030 ($ billion)
Chart on Germany - Year-over-year growth 2025-2030 (%)
Data Table on Germany - Year-over-year growth 2025-2030 (%)

12.4.2 UK - Market size and forecast 2025-2030

Chart on UK - Market size and forecast 2025-2030 ($ billion)
Data Table on UK - Market size and forecast 2025-2030 ($ billion)
Chart on UK - Year-over-year growth 2025-2030 (%)
Data Table on UK - Year-over-year growth 2025-2030 (%)

12.4.3 France - Market size and forecast 2025-2030

Chart on France - Market size and forecast 2025-2030 ($ billion)
Data Table on France - Market size and forecast 2025-2030 ($ billion)
Chart on France - Year-over-year growth 2025-2030 (%)
Data Table on France - Year-over-year growth 2025-2030 (%)

12.4.4 Russia - Market size and forecast 2025-2030

Chart on Russia - Market size and forecast 2025-2030 ($ billion)
Data Table on Russia - Market size and forecast 2025-2030 ($ billion)
Chart on Russia - Year-over-year growth 2025-2030 (%)
Data Table on Russia - Year-over-year growth 2025-2030 (%)

12.4.5 Italy - Market size and forecast 2025-2030

Chart on Italy - Market size and forecast 2025-2030 ($ billion)
Data Table on Italy - Market size and forecast 2025-2030 ($ billion)
Chart on Italy - Year-over-year growth 2025-2030 (%)
Data Table on Italy - Year-over-year growth 2025-2030 (%)

12.4.6 Spain - Market size and forecast 2025-2030

Chart on Spain - Market size and forecast 2025-2030 ($ billion)
Data Table on Spain - Market size and forecast 2025-2030 ($ billion)
Chart on Spain - Year-over-year growth 2025-2030 (%)
Data Table on Spain - Year-over-year growth 2025-2030 (%)

12.5 North America - Market size and forecast 2025-2030

Chart on North America - Market size and forecast 2025-2030 ($ billion)
Data Table on North America - Market size and forecast 2025-2030 ($ billion)
Chart on North America - Year-over-year growth 2025-2030 (%)
Data Table on North America - Year-over-year growth 2025-2030 (%)
Chart on Regional Comparison - North America
Data Table on Regional Comparison - North America

12.5.1 US - Market size and forecast 2025-2030

Chart on US - Market size and forecast 2025-2030 ($ billion)
Data Table on US - Market size and forecast 2025-2030 ($ billion)
Chart on US - Year-over-year growth 2025-2030 (%)
Data Table on US - Year-over-year growth 2025-2030 (%)

12.5.2 Mexico - Market size and forecast 2025-2030

Chart on Mexico - Market size and forecast 2025-2030 ($ billion)
Data Table on Mexico - Market size and forecast 2025-2030 ($ billion)
Chart on Mexico - Year-over-year growth 2025-2030 (%)
Data Table on Mexico - Year-over-year growth 2025-2030 (%)

12.5.3 Canada - Market size and forecast 2025-2030

Chart on Canada - Market size and forecast 2025-2030 ($ billion)
Data Table on Canada - Market size and forecast 2025-2030 ($ billion)
Chart on Canada - Year-over-year growth 2025-2030 (%)
Data Table on Canada - Year-over-year growth 2025-2030 (%)

12.6 South America - Market size and forecast 2025-2030

Chart on South America - Market size and forecast 2025-2030 ($ billion)
Data Table on South America - Market size and forecast 2025-2030 ($ billion)
Chart on South America - Year-over-year growth 2025-2030 (%)
Data Table on South America - Year-over-year growth 2025-2030 (%)
Chart on Regional Comparison - South America
Data Table on Regional Comparison - South America

12.6.1 Brazil - Market size and forecast 2025-2030

Chart on Brazil - Market size and forecast 2025-2030 ($ billion)
Data Table on Brazil - Market size and forecast 2025-2030 ($ billion)
Chart on Brazil - Year-over-year growth 2025-2030 (%)
Data Table on Brazil - Year-over-year growth 2025-2030 (%)

12.6.2 Argentina - Market size and forecast 2025-2030

Chart on Argentina - Market size and forecast 2025-2030 ($ billion)
Data Table on Argentina - Market size and forecast 2025-2030 ($ billion)
Chart on Argentina - Year-over-year growth 2025-2030 (%)
Data Table on Argentina - Year-over-year growth 2025-2030 (%)

12.6.3 Colombia - Market size and forecast 2025-2030

Chart on Colombia - Market size and forecast 2025-2030 ($ billion)
Data Table on Colombia - Market size and forecast 2025-2030 ($ billion)
Chart on Colombia - Year-over-year growth 2025-2030 (%)
Data Table on Colombia - Year-over-year growth 2025-2030 (%)

12.7 Middle East and Africa - Market size and forecast 2025-2030

Chart on Middle East and Africa - Market size and forecast 2025-2030 ($ billion)
Data Table on Middle East and Africa - Market size and forecast 2025-2030 ($ billion)
Chart on Middle East and Africa - Year-over-year growth 2025-2030 (%)
Data Table on Middle East and Africa - Year-over-year growth 2025-2030 (%)
Chart on Regional Comparison - Middle East and Africa
Data Table on Regional Comparison - Middle East and Africa

12.7.1 South Africa - Market size and forecast 2025-2030

Chart on South Africa - Market size and forecast 2025-2030 ($ billion)
Data Table on South Africa - Market size and forecast 2025-2030 ($ billion)
Chart on South Africa - Year-over-year growth 2025-2030 (%)
Data Table on South Africa - Year-over-year growth 2025-2030 (%)

12.7.2 Turkey - Market size and forecast 2025-2030

Chart on Turkey - Market size and forecast 2025-2030 ($ billion)
Data Table on Turkey - Market size and forecast 2025-2030 ($ billion)
Chart on Turkey - Year-over-year growth 2025-2030 (%)
Data Table on Turkey - Year-over-year growth 2025-2030 (%)

12.7.3 Egypt - Market size and forecast 2025-2030

Chart on Egypt - Market size and forecast 2025-2030 ($ billion)
Data Table on Egypt - Market size and forecast 2025-2030 ($ billion)
Chart on Egypt - Year-over-year growth 2025-2030 (%)
Data Table on Egypt - Year-over-year growth 2025-2030 (%)

12.7.4 Nigeria - Market size and forecast 2025-2030

Chart on Nigeria - Market size and forecast 2025-2030 ($ billion)
Data Table on Nigeria - Market size and forecast 2025-2030 ($ billion)
Chart on Nigeria - Year-over-year growth 2025-2030 (%)
Data Table on Nigeria - Year-over-year growth 2025-2030 (%)

12.7.5 UAE - Market size and forecast 2025-2030

Chart on UAE - Market size and forecast 2025-2030 ($ billion)
Data Table on UAE - Market size and forecast 2025-2030 ($ billion)
Chart on UAE - Year-over-year growth 2025-2030 (%)
Data Table on UAE - Year-over-year growth 2025-2030 (%)

12.8 Market opportunity by geography

Market opportunity by geography ($ billion)
Data Tables on Market opportunity by geography ($ billion)

13. Drivers, Challenges, and Opportunity

13.1 Market drivers

Intensification of premiumization trend and craft segment maturation
Rapid expansion of non-alcoholic and low-abv beer category
Strategic verticalization and efficiency gains in brewing operations

13.2 Market challenges

Shifting consumer demographics and rise of temperance
Supply chain fragility and packaging resource crisis
Regulatory compression and erosion of traditional marketing

13.3 Impact of drivers and challenges

Impact of drivers and challenges in 2025 and 2030

13.4 Market opportunities

Strategic pivot toward premiumization and lager renaissance
Adoption of agentic AI and predictive analytics in production and marketing
Evolution of multi-format packaging and direct-to-consumer logistics

14. Competitive Landscape

14.1 Overview

14.2

Overview on criticality of inputs and factors of differentiation

14.3 Landscape disruption

Overview on factors of disruption

14.4 Industry risks

Impact of key risks on business

15. Competitive Analysis

15.1 Companies profiled

Companies covered

15.2 Company ranking index

15.3 Market positioning of companies

Matrix on companies position and classification

15.4 AleSmith Brewing Co.

AleSmith Brewing Co. - Overview
AleSmith Brewing Co. - Product / Service
AleSmith Brewing Co. - Key offerings
SWOT

15.5 Anheuser Busch InBev SA NV

Anheuser Busch InBev SA NV - Overview
Anheuser Busch InBev SA NV - Business segments
Anheuser Busch InBev SA NV - Key offerings
Anheuser Busch InBev SA NV - Segment focus
SWOT

15.6 Asahi Group Holdings Ltd.

Asahi Group Holdings Ltd. - Overview
Asahi Group Holdings Ltd. - Business segments
Asahi Group Holdings Ltd. - Key news
Asahi Group Holdings Ltd. - Key offerings
Asahi Group Holdings Ltd. - Segment focus
SWOT

15.7 BrewDog Plc

BrewDog Plc - Overview
BrewDog Plc - Product / Service
BrewDog Plc - Key offerings
SWOT

15.8 Carlsberg Breweries AS

Carlsberg Breweries AS - Overview
Carlsberg Breweries AS - Business segments
Carlsberg Breweries AS - Key news
Carlsberg Breweries AS - Key offerings
Carlsberg Breweries AS - Segment focus
SWOT

15.9 Diageo PLC

Diageo PLC - Overview
Diageo PLC - Business segments
Diageo PLC - Key news
Diageo PLC - Key offerings
Diageo PLC - Segment focus
SWOT

15.10 Duvel Moortgat NV

Duvel Moortgat NV - Overview
Duvel Moortgat NV - Product / Service
Duvel Moortgat NV - Key offerings
SWOT

15.11 East 9th Brewing Co.

East 9th Brewing Co. - Overview
East 9th Brewing Co. - Product / Service
East 9th Brewing Co. - Key offerings
SWOT

15.12 Heineken NV

Heineken NV - Overview
Heineken NV - Business segments
Heineken NV - Key offerings
Heineken NV - Segment focus
SWOT

15.13 Mikkeller APS

Mikkeller APS - Overview
Mikkeller APS - Product / Service
Mikkeller APS - Key offerings
SWOT

15.14 Mission Brewery

Mission Brewery - Overview
Mission Brewery - Product / Service
Mission Brewery - Key offerings
SWOT

15.15 Molson Coors Beverage Co.

Molson Coors Beverage Co. - Overview
Molson Coors Beverage Co. - Business segments
Molson Coors Beverage Co. - Key news
Molson Coors Beverage Co. - Key offerings
Molson Coors Beverage Co. - Segment focus
SWOT

15.16 Sierra Nevada Brewing Co.

Sierra Nevada Brewing Co. - Overview
Sierra Nevada Brewing Co. - Product / Service
Sierra Nevada Brewing Co. - Key offerings
SWOT

15.17 Sprecher

Sprecher - Overview
Sprecher - Product / Service
Sprecher - Key offerings
SWOT

15.18 The Boston Beer Co. Inc.

The Boston Beer Co. Inc. - Overview
The Boston Beer Co. Inc. - Product / Service
The Boston Beer Co. Inc. - Key offerings
SWOT

16. Appendix

16.1 Scope of the report

Market definition
Objectives
Notes and caveats

16.2 Inclusions and exclusions checklist

Inclusions checklist
Exclusions checklist

16.3 Currency conversion rates for US$

16.4 Research methodology

16.5 Data procurement

Information sources

16.6 Data validation

16.7 Validation techniques employed for market sizing

16.8 Data synthesis

16.9 360 degree market analysis

16.10 List of abbreviations

Research Methodology

Technavio presents a detailed picture of the market by way of study, synthesis, and summation of data from multiple sources. The analysts have presented the various facets of the market with a particular focus on identifying the key industry influencers. The data thus presented is comprehensive, reliable, and the result of extensive research, both primary and secondary.

INFORMATION SOURCES

Primary sources

  • Manufacturers and suppliers
  • Channel partners
  • Industry experts
  • Strategic decision makers

Secondary sources

  • Industry journals and periodicals
  • Government data
  • Financial reports of key industry players
  • Historical data
  • Press releases

DATA ANALYSIS

Data Synthesis

  • Collation of data
  • Estimation of key figures
  • Analysis of derived insights

Data Validation

  • Triangulation with data models
  • Reference against proprietary databases
  • Corroboration with industry experts

REPORT WRITING

Qualitative

  • Market drivers
  • Market challenges
  • Market trends
  • Five forces analysis

Quantitative

  • Market size and forecast
  • Market segmentation
  • Geographical insights
  • Competitive landscape

Interested in this report?

Get your sample now to see our research methodology and insights!

Download Now

Frequently Asked Questions

Beer market growth will increase by USD 292.9 billion during 2026-2030.

The Beer market is expected to grow at a CAGR of 5.9% during 2026-2030.

Beer market is segmented by Packaging (Bottles, Cans) Distribution channel (On-trade, Off-trade) Product type (Lager, Ale, Stouts, Others)

AleSmith Brewing Co., Anheuser Busch InBev SA NV, Asahi Group Holdings Ltd., BrewDog Plc, Carlsberg Breweries AS, Cloudwater Brew Co., Diageo PLC, Duvel Moortgat NV, East 9th Brewing Co., Forbidden Root, Heineken NV, Kirin Holdings Co. Ltd., Mikkeller APS, Mission Brewery, Molson Coors Beverage Co., Saranac Brewery, Sierra Nevada Brewing Co., Sprecher, Swinkels Family Brewers, The Boston Beer Co. Inc. are a few of the key vendors in the Beer market.

APAC will register the highest growth rate of 36.8% among the other regions. Therefore, the Beer market in APAC is expected to garner significant business opportunities for the vendors during the forecast period.

China, India, Japan, Australia, South Korea, Indonesia, Germany, UK, France, Russia, Italy, Spain, US, Mexico, Canada, Brazil, Argentina, Colombia, South Africa, Turkey, Egypt, Nigeria, UAE

  • Intensification of premiumization trend and craft segment maturation is the driving factor this market.

The Beer market vendors should focus on grabbing business opportunities from the Packaging segment as it accounted for the largest market share in the base year.