
Big Data Services Market Size 2025-2029
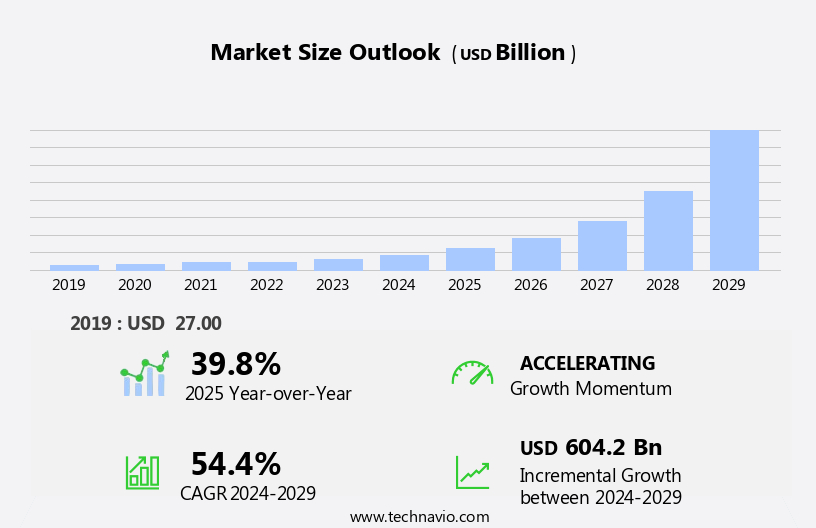
The big data services market size is forecast to increase by USD 604.2 billion, at a CAGR of 54.4% between 2024 and 2029.
- The market is experiencing significant growth, driven by the increasing adoption of big data in various industries, particularly in blockchain technology. The ability to process and analyze vast amounts of data in real-time is revolutionizing business operations and decision-making processes. However, this market is not without challenges. One of the most pressing issues is the need to cater to diverse client requirements, each with unique data needs and expectations. This necessitates customized solutions and a deep understanding of various industries and their data requirements. Additionally, ensuring data security and privacy in an increasingly interconnected world poses a significant challenge.
- Companies must navigate these obstacles while maintaining compliance with regulations and adhering to ethical data handling practices. To capitalize on the opportunities presented by the market, organizations must focus on developing innovative solutions that address these challenges while delivering value to their clients. By staying abreast of industry trends and investing in advanced technologies, they can effectively meet client demands and differentiate themselves in a competitive landscape.
What will be the Size of the Big Data Services Market during the forecast period?
Explore in-depth regional segment analysis with market size data - historical 2019-2023 and forecasts 2025-2029 - in the full report.
Request Free Sample
The market continues to evolve, driven by the ever-increasing volume, velocity, and variety of data being generated across various sectors. Data extraction is a crucial component of this dynamic landscape, enabling entities to derive valuable insights from their data. Human resource management, for instance, benefits from data-driven decision making, operational efficiency, and data enrichment. Batch processing and data integration are essential for data warehousing and data pipeline management. Data governance and data federation ensure data accessibility, quality, and security. Data lineage and data monetization facilitate data sharing and collaboration, while data discovery and data mining uncover hidden patterns and trends.
Real-time analytics and risk management provide operational agility and help mitigate potential threats. Machine learning and deep learning algorithms enable predictive analytics, enhancing business intelligence and customer insights. Data visualization and data transformation facilitate data usability and data loading into NoSQL databases. Government analytics, financial services analytics, supply chain optimization, and manufacturing analytics are just a few applications of big data services. Cloud computing and data streaming further expand the market's reach and capabilities. Data literacy and data collaboration are essential for effective data usage and collaboration. Data security and data cleansing are ongoing concerns, with the market continuously evolving to address these challenges.
The integration of natural language processing, computer vision, and fraud detection further enhances the value proposition of big data services. The market's continuous dynamism underscores the importance of data cataloging, metadata management, and data modeling for effective data management and optimization.
How is this Big Data Services Industry segmented?
The big data services industry research report provides comprehensive data (region-wise segment analysis), with forecasts and estimates in "USD billion" for the period 2025-2029, as well as historical data from 2019-2023 for the following segments.
- Component
- Solution
- Services
- End-user
- BFSI
- Telecom
- Retail
- Others
- Type
- Data storage and management
- Data analytics and visualization
- Consulting services
- Implementation and integration services
- Support and maintenance services
- Sector
- Large enterprises
- Small and medium enterprises (SMEs)
- Geography
- North America
- US
- Mexico
- Europe
- France
- Germany
- Italy
- UK
- Middle East and Africa
- UAE
- APAC
- Australia
- China
- India
- Japan
- South Korea
- South America
- Brazil
- Rest of World (ROW)
- North America
By Component Insights
The solution segment is estimated to witness significant growth during the forecast period.
Big data services have become indispensable for businesses seeking operational efficiency and customer insight. The vast expanse of structured and unstructured data presents an opportunity for organizations to analyze consumer behaviors across multiple channels. Big data solutions facilitate the integration and processing of data from various sources, enabling businesses to gain a deeper understanding of customer sentiment towards their products or services. Data governance ensures data quality and security, while data federation and data lineage provide transparency and traceability. Artificial intelligence and machine learning algorithms enable predictive analytics and real-time decision making, driving product development and innovation.
Data integration, data visualization, and data mining help businesses uncover hidden patterns and trends, informing strategic business decisions. Nosql databases and cloud computing offer scalable storage solutions, allowing businesses to store and access large volumes of data. Data enrichment and data transformation enhance data usability, while data discovery and data cataloging facilitate efficient data access. Data sharing and collaboration enable knowledge transfer and innovation, driving growth in industries such as government analytics, financial services analytics, education analytics, and healthcare analytics. Manufacturing analytics, retail analytics, and supply chain optimization leverage data to streamline operations, reduce costs, and improve customer satisfaction.
Data streaming and data lakes enable real-time data processing, while data loading and data pipelines ensure data availability for analysis. Computer vision, natural language processing, and fraud detection offer new possibilities for data analysis, driving innovation and growth. In conclusion, the market is characterized by the integration and analysis of vast amounts of data to drive business growth and operational efficiency. The use of advanced technologies such as artificial intelligence, machine learning, and predictive analytics enables businesses to gain valuable customer insights, inform strategic decisions, and drive innovation.
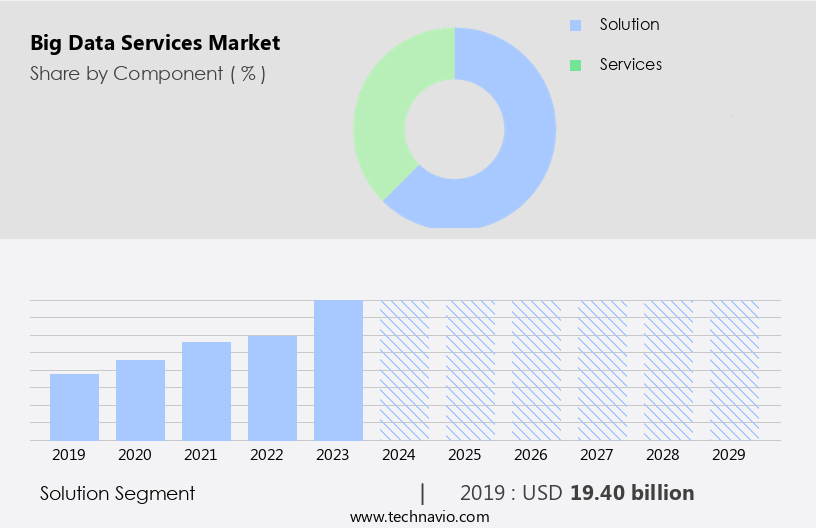
The Solution segment was valued at USD 19.40 billion in 2019 and showed a gradual increase during the forecast period.
Regional Analysis
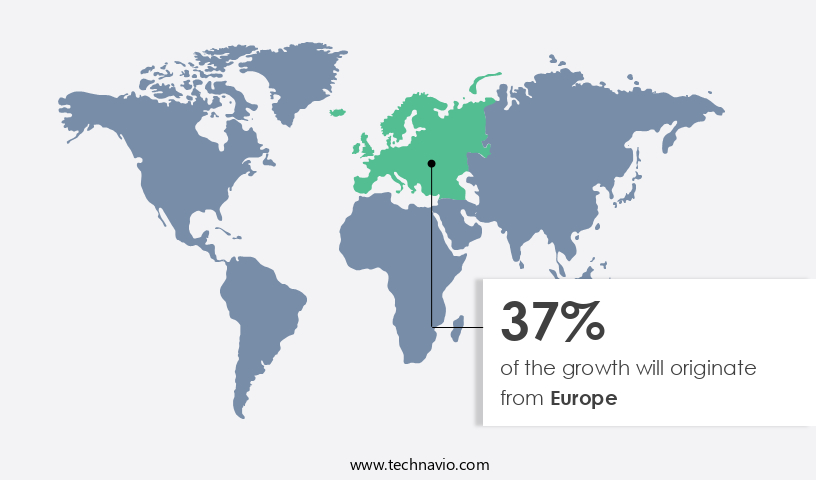
Europe is estimated to contribute 37% to the growth of the global market during the forecast period.Technavio’s analysts have elaborately explained the regional trends and drivers that shape the market during the forecast period.
In North America, the market is witnessing significant growth due to the digital transformation taking place across various industries, including retail, BFSI, healthcare, and public sectors. This shift is driven by the increasing generation of data and the adoption of digital technologies such as big data analytics, mobility, cloud, and social media to maintain a competitive edge. The BFSI sector is a major contributor to this market, with financial institutions utilizing big data analytics to manage and analyze vast amounts of customer data, facilitating real-time marketing and integrating e-commerce platforms with payment processing. Data integration, data governance, and data federation are crucial elements in managing and leveraging this data.
Data lineage and data cataloging ensure data accuracy and traceability, while data modeling and data warehousing enable efficient data storage and retrieval. Machine learning and artificial intelligence are integral to data analysis, driving operational efficiency, product development, and data-driven decision making. Deep learning and predictive analytics are essential tools for data mining and data visualization, providing valuable customer insights and risk management capabilities. Data sharing, data streaming, and data lakes facilitate seamless data accessibility and collaboration. Data enrichment, data transformation, and data loading ensure data quality and usability, while data security and metadata management maintain data privacy and integrity.
Moreover, the adoption of cloud computing, data literacy, and natural language processing are transforming the way businesses approach data analysis and management. Big data services are also making strides in manufacturing analytics, healthcare analytics, financial analysis, education analytics, retail analytics, real-time analytics, and fraud detection. Overall, the North American market is at the forefront of big data services innovation, with a focus on data monetization, data integration, and data-driven decision making.
Market Dynamics
Our researchers analyzed the data with 2024 as the base year, along with the key drivers, trends, and challenges. A holistic analysis of drivers will help companies refine their marketing strategies to gain a competitive advantage.
What are the key market drivers leading to the rise in the adoption of Big Data Services Industry?
- The relentless expansion of data serves as the primary catalyst for market growth.
- The market is experiencing significant growth due to the increasing volume, variety, veracity, and velocity of data, collectively referred to as the 4Vs. Enterprise applications, the Internet, mobile devices, and social media are generating vast amounts of data at an unprecedented rate. To effectively manage and analyze these large datasets, organizations are turning to big data services. Big data analytics enables businesses to gain valuable insights from their data in real time, optimize operational efficiency, and enhance customer experiences. By transforming irrelevant data into valuable insights, big data analytics improves decision-making processes and provides a competitive edge.
- Data transformation, data loading, data processing, data mining, data visualization, data collaboration, data sharing, data streaming, data lakes, business intelligence, fraud detection, data ingestion, data collaboration, data visualization, and computer vision are key components of big data services. These services help organizations make sense of their data, gain insights, and make informed decisions. Data transformation involves converting data from one format to another, while data loading refers to the process of transferring data into a database. Data processing involves analyzing and cleaning data to make it usable, and data mining involves extracting insights from large datasets. Data visualization helps organizations make sense of complex data by presenting it in a graphical format, while data collaboration enables teams to work together on data analysis projects.
- Fraud detection, data streaming, and computer vision are other important applications of big data services. Fraud detection uses data analytics to identify and prevent fraudulent activities, while data streaming enables real-time analysis of streaming data. Computer vision uses machine learning algorithms to analyze visual data from cameras, videos, and other sources. In conclusion, the growing volume, variety, veracity, and velocity of data are driving the demand for big data services. These services help organizations manage and analyze their data efficiently, gain valuable insights, and make informed decisions. By implementing big data analytics, businesses can optimize operational efficiency, enhance customer experiences, and gain a competitive edge.
What are the market trends shaping the Big Data Services Industry?
- Blockchain technology is experiencing a significant trend toward the integration of big data. The utilization of big data in blockchain systems is becoming increasingly prominent in the industry.
- Big Data services play a pivotal role in enhancing the capabilities of blockchain technology. By providing scalable databases, query languages, and accurate record-keeping, big data enables the processing of large volumes of data while maintaining transparency and security. For instance, financial firms can benefit from real-time analytics and risk management through data extraction, data cataloging, data modeling, and data warehousing. Machine learning and predictive analytics facilitate marketing optimization and metadata management. Microsoft's Azure Blockchain Service is an illustrative example of this integration. Launched in January 2025, this service offers financial organizations a secure and efficient solution for data pipelines.
- It integrates big data analytics to improve security, reduce fraud risks, and ensure regulatory compliance. The combination of big data and blockchain technology addresses challenges such as scalability and security, thereby driving market growth. Additionally, data cleansing and data security are crucial aspects that are effectively addressed through this integration. Overall, the synergy between big data and blockchain technology offers numerous benefits, making it a significant trend in the business world.
What challenges does the Big Data Services Industry face during its growth?
- Complying with various client demands is a significant challenge that can impact industry expansion. In order to thrive in this sector, it is essential to possess a deep understanding of diverse client needs and the ability to adapt accordingly. This requirement adds complexity to business operations and necessitates continuous improvement and innovation.
- Big data services play a crucial role in enabling businesses to derive valuable insights from vast amounts of data. However, challenges persist in effectively managing and utilizing this data. The absence of clear data policies and frameworks can hinder data retrieval and integration, leading to difficulties in data governance and data lineage. This can negatively impact the market growth for big data service providers, as the quality of their services may suffer. Moreover, clients demand tangible business outcomes but are cautious about investments. The lack of a definitive return on investment (ROI) strategy makes it challenging for companies to calculate and monitor their progress.
- To address these concerns, big data service providers must innovate continuously and offer solutions tailored to evolving customer needs. This requires significant resources and a deep understanding of customer requirements to avoid wasting time and money on unsuccessful projects. To maximize operational efficiency, businesses can leverage advanced technologies like artificial intelligence (AI), deep learning, and data integration. These technologies can streamline processes, improve product development, and facilitate data-driven decision making. Additionally, data enrichment and data monetization can provide new revenue streams, enhancing overall business value. By focusing on these areas, big data service providers can deliver superior services and create lasting value for their clients.
Exclusive Customer Landscape
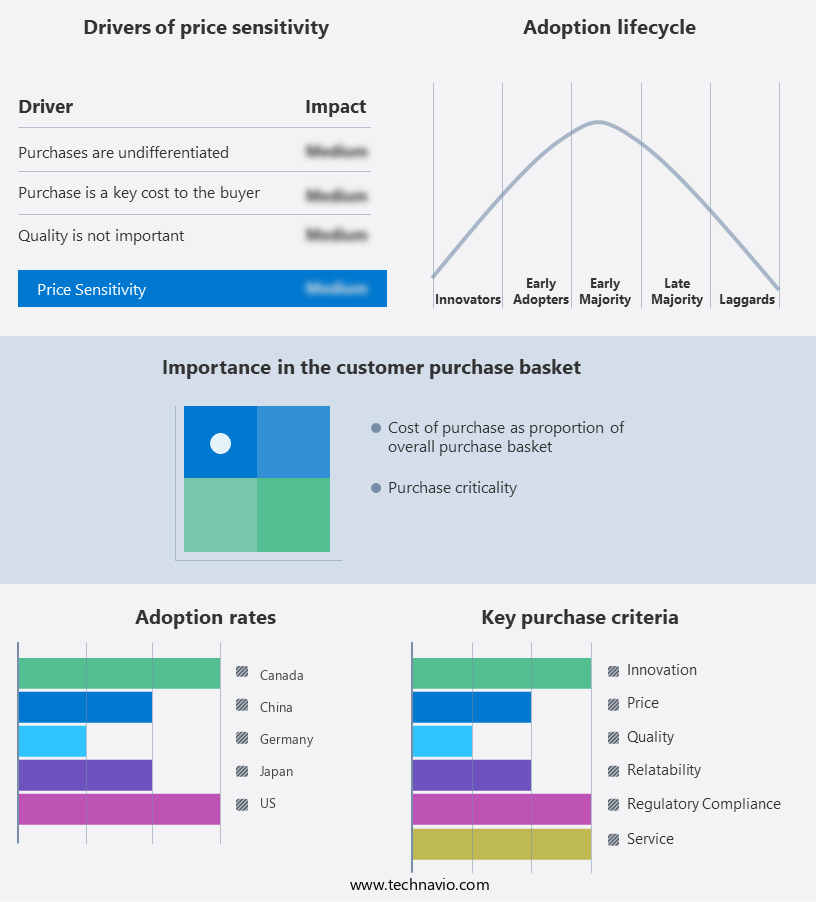
The big data services market forecasting report includes the adoption lifecycle of the market, covering from the innovator’s stage to the laggard’s stage. It focuses on adoption rates in different regions based on penetration. Furthermore, the big data services market report also includes key purchase criteria and drivers of price sensitivity to help companies evaluate and develop their market growth analysis strategies.
Customer Landscape
Key Companies & Market Insights
Companies are implementing various strategies, such as strategic alliances, big data services market forecast, partnerships, mergers and acquisitions, geographical expansion, and product/service launches, to enhance their presence in the industry.
Accenture Plc - This organization specializes in big data services, focusing on Data-Led Transformation. By leveraging advanced analytics and machine learning techniques, we help businesses optimize operations, enhance customer experiences, and uncover valuable insights from complex data sets. Our expertise lies in translating raw data into actionable intelligence, enabling clients to make informed decisions and gain a competitive edge. Our approach is data-driven, agnostic to technology, and tailored to each client's unique needs. We believe in the power of data to transform businesses and fuel growth.
The industry research and growth report includes detailed analyses of the competitive landscape of the market and information about key companies, including:
- Accenture Plc
- Amazon Web Services Inc.
- Capgemini SE
- Cloudera Inc.
- Cognizant Technology Solutions Corporation
- Databricks Inc.
- Deloitte Touche Tohmatsu Limited
- Google LLC
- Hewlett Packard Enterprise Company
- IBM Corporation
- Infosys Limited
- Microsoft Corporation
- Oracle Corporation
- Palantir Technologies Inc.
- SAP SE
- Snowflake Inc.
- Splunk Inc.
- Tata Consultancy Services Limited
- Teradata Corporation
- Wipro Limited
Qualitative and quantitative analysis of companies has been conducted to help clients understand the wider business environment as well as the strengths and weaknesses of key industry players. Data is qualitatively analyzed to categorize companies as pure play, category-focused, industry-focused, and diversified; it is quantitatively analyzed to categorize companies as dominant, leading, strong, tentative, and weak.
Recent Development and News in Big Data Services Market
- In February 2024, IBM announced the launch of its new AI-powered big data analytics platform, "IBM Watson Anyscale," designed to handle massive datasets and provide insights in real-time (IBM Press Release). This development signifies a significant technological advancement in the market, enabling businesses to process and analyze vast amounts of data more efficiently.
- In May 2024, Amazon Web Services (AWS) and Microsoft Azure entered into a strategic partnership to offer joint solutions for big data analytics, machine learning, and artificial intelligence (AWS Press Release). This collaboration represents a major strategic move, combining AWS's expertise in big data and machine learning with Microsoft's Azure platform, providing businesses with a more comprehensive suite of services.
- In September 2024, Google Cloud Platform secured a strategic investment of USD9 billion from various investors, including Microsoft and Mubadala Investment Company (Google Cloud Press Release). This substantial funding round underscores the growing importance of big data services in the technology sector and Google Cloud's commitment to expanding its offerings in this area.
- In November 2025, Oracle Corporation announced its acquisition of DataLogix, a leading data analytics and marketing services company, for approximately USD1.3 billion (Oracle Press Release). This acquisition signifies a significant expansion into the market for Oracle, providing the company with advanced analytics capabilities and a larger customer base.
Research Analyst Overview
- In the dynamic the market, data collaboration tools facilitate seamless data sharing among teams, enhancing productivity. Data modeling methodologies and data transformation tools enable efficient data processing for batch data and real-time streams. Cloud data warehouses and data sharing platforms ensure data accessibility, while data governance frameworks maintain data security and privacy. Deep learning models and machine learning algorithms power advanced data analytics platforms, driving insights from vast datasets. Data lineage tracking and metadata management systems provide transparency into data usage and origin. Data processing engines and data extraction tools optimize data retrieval methods, integrating with data mining techniques and data enrichment services.
- Data security standards and data privacy regulations guide data usage, ensuring compliance. Data visualization tools and business intelligence dashboards make data usable for decision-making, while data usability metrics and data literacy programs improve data understanding. Nosql database solutions and data storage solutions cater to diverse data needs, and data monetization strategies unlock value from data assets. Data streaming platforms and data ingestion pipelines enable continuous data flow, feeding data cataloging tools and data loading utilities for efficient data management. Data discovery platforms and data federation tools simplify data access, fostering a data-driven culture within organizations. Data marketplaces and data cataloging tools enable data sharing and monetization, further expanding the big data services landscape.
Dive into Technavio’s robust research methodology, blending expert interviews, extensive data synthesis, and validated models for unparalleled Big Data Services Market insights. See full methodology.
|
Market Scope |
|
|
Report Coverage |
Details |
|
Page number |
251 |
|
Base year |
2024 |
|
Historic period |
2019-2023 |
|
Forecast period |
2025-2029 |
|
Growth momentum & CAGR |
Accelerate at a CAGR of 54.4% |
|
Market growth 2025-2029 |
USD 604.2 billion |
|
Market structure |
Fragmented |
|
YoY growth 2024-2025(%) |
39.8 |
|
Key countries |
US, China, Germany, Japan, UK, Australia, India, France, Brazil, UAE, Rest of World (ROW), Saudi Arabia, France, South Korea, Mexico, and Italy |
|
Competitive landscape |
Leading Companies, Market Positioning of Companies, Competitive Strategies, and Industry Risks |
What are the Key Data Covered in this Big Data Services Market Research and Growth Report?
- CAGR of the Big Data Services industry during the forecast period
- Detailed information on factors that will drive the growth and forecasting between 2025 and 2029
- Precise estimation of the size of the market and its contribution of the industry in focus to the parent market
- Accurate predictions about upcoming growth and trends and changes in consumer behaviour
- Growth of the market across North America, Europe, APAC, South America, and Middle East and Africa
- Thorough analysis of the market’s competitive landscape and detailed information about companies
- Comprehensive analysis of factors that will challenge the big data services market growth of industry companies
We can help! Our analysts can customize this big data services market research report to meet your requirements.
 RIA -
RIA - 
