Data Warehousing Market Analysis, Size, and Forecast 2026-2030: North America (US, Canada, and Mexico), Europe (Germany, UK, and France), APAC (China, Japan, and India), Middle East and Africa (Saudi Arabia, UAE, and South Africa), South America (Brazil and Argentina), and Rest of World (ROW)

Data Warehousing Market Analysis, Size, and Forecast 2026-2030:
North America (US, Canada, and Mexico), Europe (Germany, UK, and France), APAC (China, Japan, and India), Middle East and Africa (Saudi Arabia, UAE, and South Africa), South America (Brazil and Argentina), and Rest of World (ROW)

Published: Mar 2026 299 Pages SKU: IRTNTR75664

Market Overview at a Glance

$39.09 B
Market Opportunity
14.9%
CAGR 2025 - 2030
39.4%
North America Growth
$19.00 B
On-premises segment 2024

Data Warehousing Market Size 2026-2030

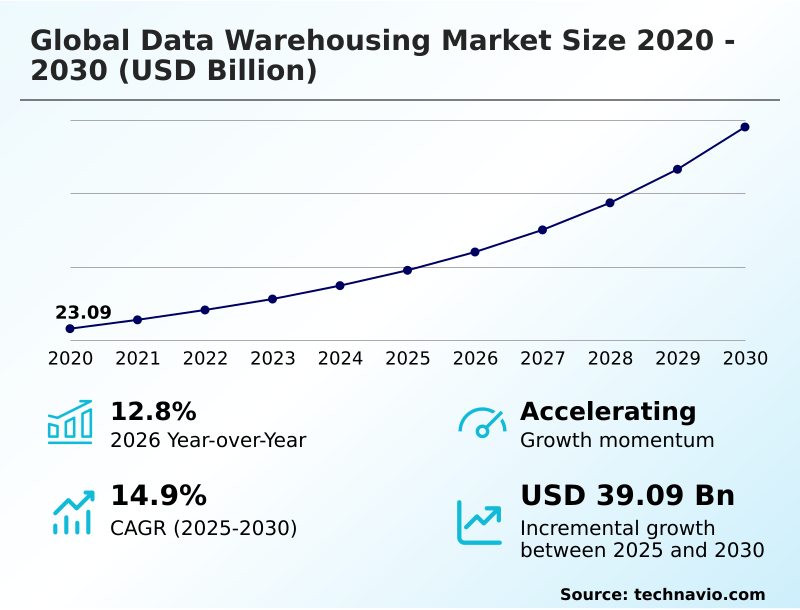
The data warehousing market size is valued to increase by USD 39.09 billion, at a CAGR of 14.9% from 2025 to 2030. Mainstreaming of generative AI and industrialization of agentic data fabric architectures will drive the data warehousing market.

Major Market Trends & Insights

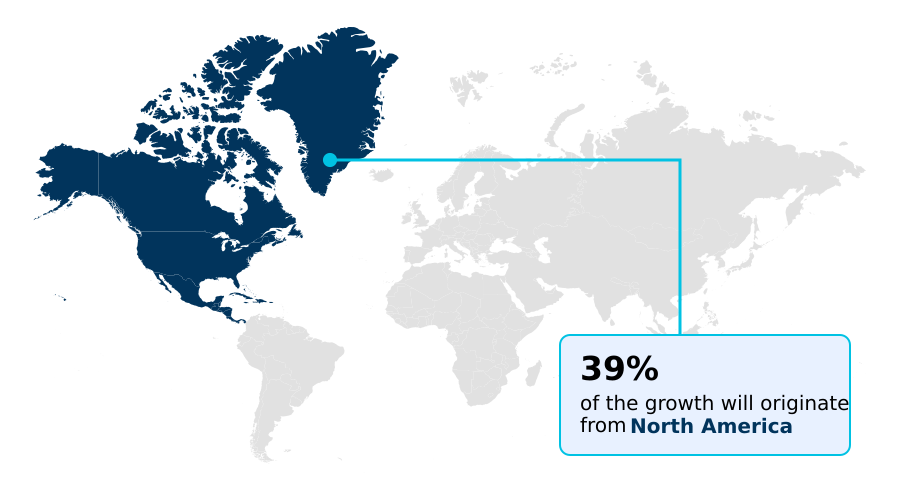
  • North America dominated the market and accounted for a 39.4% growth during the forecast period.
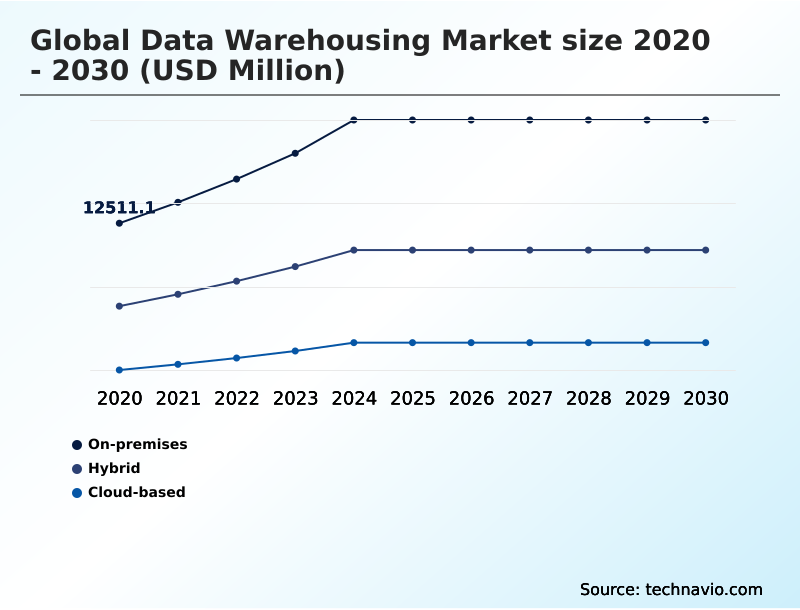
  • By Deployment - On-premises segment was valued at USD 19.00 billion in 2024
  • By Type - Structured and semi-structured data segment accounted for the largest market revenue share in 2024

Market Size & Forecast

  • Market Opportunities: USD 55.01 billion
  • Market Future Opportunities: USD 39.09 billion
  • CAGR from 2025 to 2030 : 14.9%

Market Summary

  • The data warehousing market is undergoing a significant transformation, evolving from static repositories for historical reporting into dynamic engines for real-time decision intelligence. This shift is propelled by the need to manage and analyze vast volumes of structured and unstructured data from diverse sources.
  • A primary trend is the adoption of data lakehouse architecture, which combines the reliability of traditional warehouses with the flexibility of data lakes, supported by open table formats. This unified approach facilitates the mainstreaming of agentic artificial intelligence and large language models directly on operational data, eliminating complex data pipelines.
  • For instance, a global retail enterprise can leverage this architecture to integrate real-time sales transaction data with unstructured customer feedback from social media, enabling immediate inventory adjustments and highly personalized marketing campaigns without data movement delays. However, organizations face challenges in managing cloud consumption costs and require robust FinOps practices.
  • The market's future is shaped by the move toward autonomous governance, serverless data warehousing, and ensuring data sovereignty across multi-cloud environments, making data democratization a tangible goal for modern enterprises seeking a competitive edge through analytics.

What will be the Size of the Data Warehousing Market during the forecast period?

Get Key Insights on Market Forecast (PDF) Request Free Sample

How is the Data Warehousing Market Segmented?

The data warehousing industry research report provides comprehensive data (region-wise segment analysis), with forecasts and estimates in "USD million" for the period 2026-2030, as well as historical data from 2020-2024 for the following segments.

  • Deployment
    • On-premises
    • Hybrid
    • Cloud-based
  • Type
    • Structured and semi-structured data
    • Unstructured data
  • End-user
    • BFSI
    • Healthcare
    • Retail and e-commerce
    • Others
  • Geography
    • North America
      • US
      • Canada
      • Mexico
    • Europe
      • Germany
      • UK
      • France
    • APAC
      • China
      • Japan
      • India
    • Middle East and Africa
      • Saudi Arabia
      • UAE
      • South Africa
    • South America
      • Brazil
      • Argentina
    • Rest of World (ROW)

By Deployment Insights

The on-premises segment is estimated to witness significant growth during the forecast period.

On-premises deployments remain a foundational pillar, particularly for organizations bound by stringent regulatory mandates that prioritize data sovereignty and data residency.

This model, which involves hosting infrastructure within an organization's own data centers, offers superior control over security and network speeds for analytical processing (OLAP).

While the overall share is contracting, on-premises systems still represent a significant portion of the market, accounting for approximately 37% of the value due to their necessity in sectors like finance and government.

Modern appliances featuring columnar storage and query optimization are narrowing the performance gap with cloud alternatives.

The high capital expenditure is often justified by the elimination of unpredictable monthly costs from unmanaged compute phenomenon and egress fees, making it a calculated choice for risk mitigation and cost predictability.

Request Free Sample

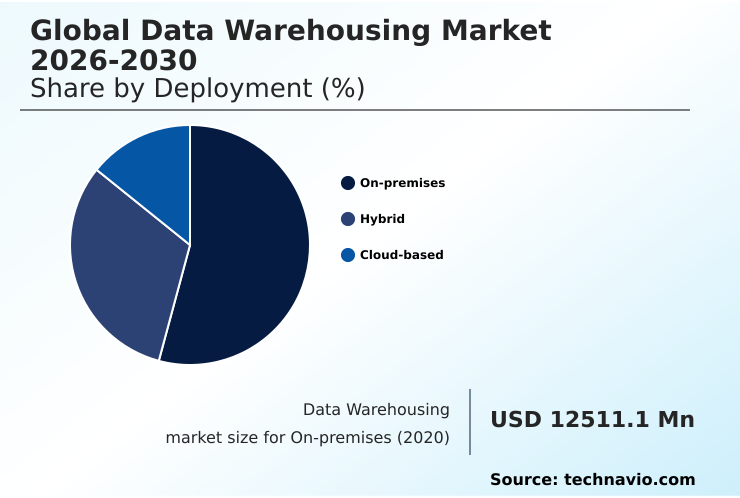
The On-premises segment was valued at USD 19.00 billion in 2024 and showed a gradual increase during the forecast period.

Request Free Sample

Regional Analysis

North America is estimated to contribute 39.4% to the growth of the global market during the forecast period.Technavio’s analysts have elaborately explained the regional trends and drivers that shape the market during the forecast period.

See How Data Warehousing Market Demand is Rising in North America Request Free Sample

The global landscape is led by North America, which is projected to contribute 39.4% of the market's incremental growth, driven by the early adoption of cloud-native warehousing and the presence of major technology vendors.

Enterprises in the region have increased investments in AI-native data modernization strategies by over 20%, prioritizing platforms that decouple storage and compute.

This trend is a direct response to challenges like the unmanaged compute phenomenon, with a focus on implementing serverless data warehouse models and cost-governance tools. Europe is focused on navigating data sovereignty regulations, mandating localized residency compliance.

Meanwhile, APAC is emerging as a high-growth region, with firms rapidly adopting hybrid cloud architecture and open table formats to bypass legacy infrastructure and accelerate their digital transformation initiatives without the burden of technical debt.

Market Dynamics

Our researchers analyzed the data with 2025 as the base year, along with the key drivers, trends, and challenges. A holistic analysis of drivers will help companies refine their marketing strategies to gain a competitive advantage.

  • Modern enterprises are strategically overhauling their data infrastructure, with a primary focus on converging structured and unstructured data to build a cohesive analytical foundation. The goal is to move toward reducing ETL with zero-ETL futures, a shift made possible by deploying AI-native lakehouse architectures.
  • At the core of this transformation is understanding the role of open table formats, which provide the reliability needed for complex analytics while supporting the massive scale of data lakes. This architectural evolution enables advanced capabilities, including on-device model training and inference for edge applications and sophisticated real-time stream processing use cases.
  • For example, in supply chain management, this integration has led to forecast accuracy improvements twice as effective as legacy systems. However, this transition is not without its hurdles. Key priorities include avoiding cloud consumption cost escalation and managing unpredictable query latency challenges through better governance.
  • Implementing sovereign data governance standards has become non-negotiable due to the complex impact of data sovereignty regulations. Furthermore, organizations must focus on securing data with zero-trust architecture, especially when integrating legacy systems with cloud environments.
  • Success hinges on optimizing a multi-cloud data warehouse strategy and overcoming the persistent challenges of data engineering talent scarcity to achieve true data democratization for non-technical users.

What are the key market drivers leading to the rise in the adoption of Data Warehousing Industry?

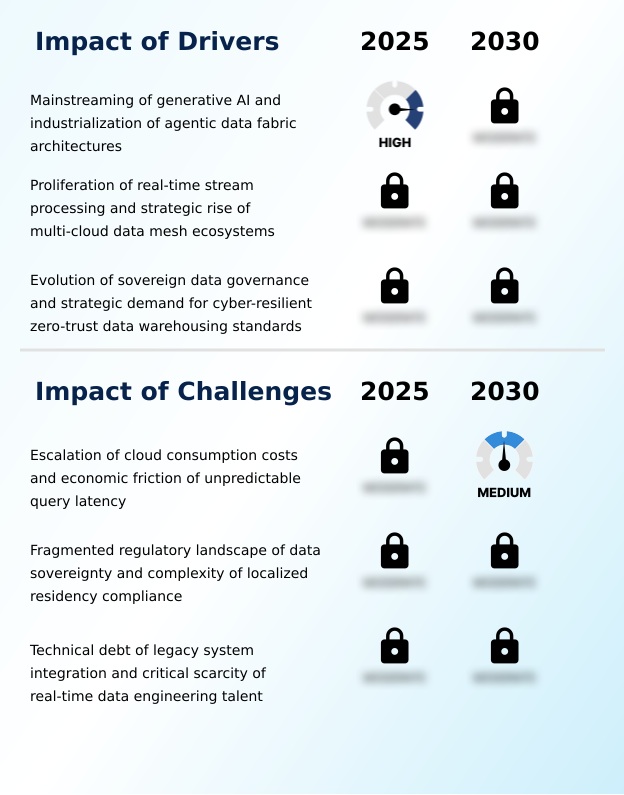
  • The market is primarily driven by the mainstreaming of generative AI and the industrialization of agentic data fabric architectures.

  • Market growth is primarily driven by the mainstreaming of generative AI and the industrialization of agentic data fabric architectures.
  • The evolution of data warehouses into foundational engines for AI has spurred a 14% increase in the adoption of AI-optimized warehouse clusters, which are essential for high-speed model training and inference.
  • The proliferation of real-time stream processing enables critical business functions, such as fraud detection, where its implementation has reduced false positives by up to 25%.
  • This shift toward an intelligent data ecosystem is further supported by the strategic rise of multi-cloud data mesh ecosystems, which provide the agility required to manage distributed data sources effectively.
  • The demand for sovereign data governance and zero-trust data standards is another key factor, compelling organizations to modernize their infrastructure.

What are the market trends shaping the Data Warehousing Industry?

  • A key market trend is the institutionalization of AI-native lakehouse architectures. This involves the convergence of online transactional processing (OLTP) and online analytical processing (OLAP) systems.

  • Key market trends are centered on the institutionalization of AI-native lakehouse architectures and autonomous governance, dissolving the lines between operational and analytical systems. This convergence is enabled by a unified data compute fabric, allowing real-time decision intelligence without traditional data movement delays.
  • The adoption of AI-driven data observability frameworks has improved the accuracy of predictive models by over 15% by ensuring higher data quality and reliability. Furthermore, the strategic transition toward serverless data warehouse models and regional data immunity addresses both cost and compliance mandates.
  • By leveraging these architectures, organizations have been able to reduce data pipeline complexity by over 40% in early use cases, a direct result of eliminating the need for separate transactional and analytical environments. Agent-centric data warehousing is at the forefront of this evolution.

What challenges does the Data Warehousing Industry face during its growth?

  • A key challenge affecting industry growth is the escalation of cloud consumption costs, compounded by the economic friction from unpredictable query latency.

  • The market faces significant challenges, led by the escalation of cloud consumption costs and the economic friction of unpredictable query latency. Nearly 50% of enterprises have exceeded their cloud data budgets by at least 20%, a direct result of unmanaged compute phenomenon where automated scaling triggers high-cost cycles.
  • The technical debt of legacy system integration also remains a major barrier, with the scarcity of real-time data engineering talent extending project timelines by up to 30%. Furthermore, the fragmented regulatory landscape surrounding data sovereignty and the complexity of localized residency compliance add considerable operational overhead, with compliance-related activities increasing costs by 15% in multi-regional deployments.
  • These issues necessitate a shift toward capacity-based pricing and algorithmic compression to ensure sustainable adoption.

Exclusive Technavio Analysis on Customer Landscape

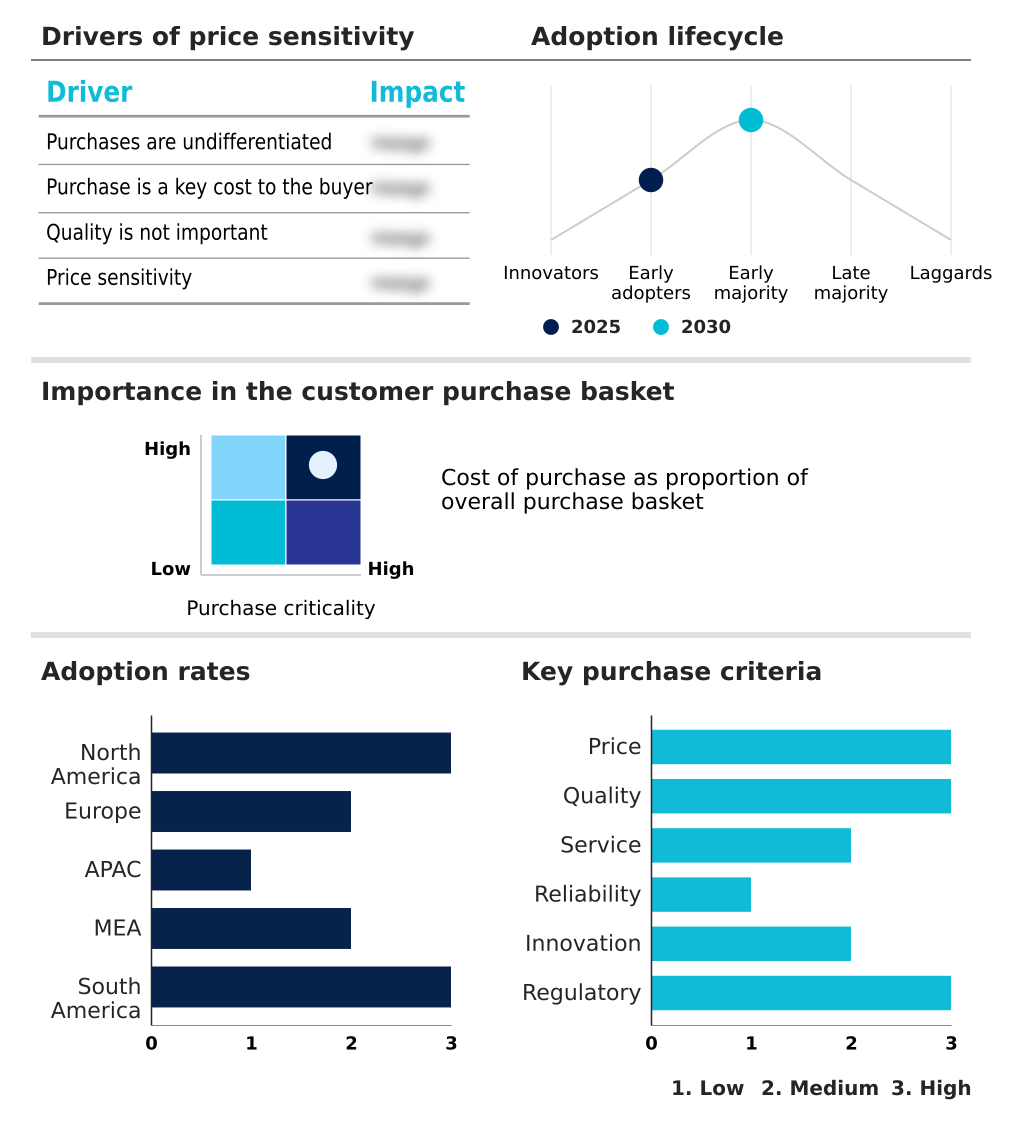
The data warehousing market forecasting report includes the adoption lifecycle of the market, covering from the innovator’s stage to the laggard’s stage. It focuses on adoption rates in different regions based on penetration. Furthermore, the data warehousing market report also includes key purchase criteria and drivers of price sensitivity to help companies evaluate and develop their market growth analysis strategies.

Customer Landscape of Data Warehousing Industry

Competitive Landscape

Companies are implementing various strategies, such as strategic alliances, data warehousing market forecast, partnerships, mergers and acquisitions, geographical expansion, and product/service launches, to enhance their presence in the industry.

Amazon.com Inc. - Offerings are centered on cloud data warehousing, AI-native platforms, and real-time analytics, enabling unified governance and advanced data intelligence for enterprise operations.

The industry research and growth report includes detailed analyses of the competitive landscape of the market and information about key companies, including:

  • Amazon.com Inc.
  • Cloudera Inc.
  • Databricks Inc.
  • Firebolt
  • Google LLC
  • HCL Technologies Ltd.
  • Hewlett Packard Enterprise Co.
  • Huawei Technologies Co. Ltd.
  • IBM Corp.
  • Informatica Inc.
  • Infosys Ltd.
  • Microsoft Corp.
  • MongoDB Inc.
  • Oracle Corp.
  • QlikTech International AB
  • SAP SE
  • SingleStore Inc.
  • Snowflake Inc.
  • Teradata Corp.
  • Yellowbrick Data Inc.

Qualitative and quantitative analysis of companies has been conducted to help clients understand the wider business environment as well as the strengths and weaknesses of key industry players. Data is qualitatively analyzed to categorize companies as pure play, category-focused, industry-focused, and diversified; it is quantitatively analyzed to categorize companies as dominant, leading, strong, tentative, and weak.

Recent Development and News in Data warehousing market

  • In May, 2025, Databricks Inc. announced the general availability of its Lakebase service, a managed, serverless PostgreSQL database designed to operate directly on the Databricks Data Intelligence Platform, enabling operational applications and AI agents on a unified data foundation.
  • In April, 2025, Snowflake Inc. launched Cortex Code, an intelligent, fully managed service designed to automate data engineering, application development, and data analysis tasks within the Snowflake AI Data Cloud, leveraging large language models to convert natural language to SQL.
  • In February, 2025, Datadog Inc. announced the launch of a new data center in the United Kingdom, designed to help financial services and public sector organizations meet local data residency and sovereignty requirements for their observability and analytical telemetry.
  • In November, 2024, Amazon.com Inc. enhanced its Amazon Web Services Redshift platform by updating materialized view auto-refresh functions to a user-query priority model, ensuring that analytical snapshots remain more closely synchronized with real-time base table changes.

Dive into Technavio’s robust research methodology, blending expert interviews, extensive data synthesis, and validated models for unparalleled Data Warehousing Market insights. See full methodology.

Market Scope
Page number 299
Base year 2025
Historic period 2020-2024
Forecast period 2026-2030
Growth momentum & CAGR Accelerate at a CAGR of 14.9%
Market growth 2026-2030 USD 39085.2 million
Market structure Fragmented
YoY growth 2025-2026(%) 12.8%
Key countries US, Canada, Mexico, Germany, UK, France, Italy, Spain, The Netherlands, China, Japan, India, South Korea, Australia, Indonesia, Saudi Arabia, UAE, South Africa, Israel, Turkey, Brazil, Argentina and Chile
Competitive landscape Leading Companies, Market Positioning of Companies, Competitive Strategies, and Industry Risks

Request Free Sample

Research Analyst Overview

  • The data warehousing market is undergoing a fundamental architectural shift from static repositories to intelligent, distributed ecosystems. This evolution is defined by the adoption of data lakehouse architecture and cloud-native warehousing, which merge the reliability of columnar storage with the scalability of the cloud.
  • Core technologies such as massively parallel processing (MPP) and advanced ETL/ELT processes are being re-engineered for a serverless data warehousing model. A crucial trend influencing boardroom strategy is the increasing importance of data sovereignty and data residency, forcing global organizations to adopt multi-cloud strategies and hybrid cloud architecture to comply with regional regulations.
  • This requires robust unified governance and metadata management to maintain control. The integration of specialized hardware accelerators is demonstrably improving performance, with some organizations reporting up to a 30% reduction in processing times for complex analytical workloads. This allows for real-time applications using vector embeddings and semantic search capabilities, driven by an agentic data fabric.
  • The rise of FinOps is also critical for managing consumption-based models and ensuring cost efficiency as data democratization expands across the enterprise.

What are the Key Data Covered in this Data Warehousing Market Research and Growth Report?

  • What is the expected growth of the Data Warehousing Market between 2026 and 2030?

    • USD 39.09 billion, at a CAGR of 14.9%

  • What segmentation does the market report cover?

    • The report is segmented by Deployment (On-premises, Hybrid, and Cloud-based), Type (Structured and semi-structured data, and Unstructured data), End-user (BFSI, Healthcare, Retail and e-commerce, and Others) and Geography (North America, Europe, APAC, Middle East and Africa, South America)

  • Which regions are analyzed in the report?

    • North America, Europe, APAC, Middle East and Africa and South America

  • What are the key growth drivers and market challenges?

    • Mainstreaming of generative AI and industrialization of agentic data fabric architectures, Escalation of cloud consumption costs and economic friction of unpredictable query latency

  • Who are the major players in the Data Warehousing Market?

    • Amazon.com Inc., Cloudera Inc., Databricks Inc., Firebolt, Google LLC, HCL Technologies Ltd., Hewlett Packard Enterprise Co., Huawei Technologies Co. Ltd., IBM Corp., Informatica Inc., Infosys Ltd., Microsoft Corp., MongoDB Inc., Oracle Corp., QlikTech International AB, SAP SE, SingleStore Inc., Snowflake Inc., Teradata Corp. and Yellowbrick Data Inc.

Market Research Insights

  • The market is defined by a rapid pivot toward intelligent, automated data ecosystems. This transition to agent-centric data warehousing and a unified data compute fabric is driven by the need for real-time decision intelligence. Organizations are actively deploying autonomous self-tuning systems to reduce manual oversight and operational friction.
  • This shift addresses significant fiscal pressures; for example, the adoption of advanced query-tuning services helps mitigate budget overruns, where nearly half of enterprises previously exceeded cloud spend by over 20%. Furthermore, the proliferation of AI-optimized warehouse clusters, showing a 14% increase in adoption, directly accelerates predictive analytics and machine learning workloads.
  • These advancements, coupled with automated data cataloging, are enabling a new class of context-aware insights while optimizing resource utilization.

We can help! Our analysts can customize this data warehousing market research report to meet your requirements.

Get in touch

1. Executive Summary

1.1 Market overview

Executive Summary - Chart on Market Overview
Executive Summary - Data Table on Market Overview
Executive Summary - Chart on Global Market Characteristics
Executive Summary - Chart on Market by Geography
Executive Summary - Chart on Market Segmentation by Deployment
Executive Summary - Chart on Market Segmentation by Type
Executive Summary - Chart on Market Segmentation by End-user
Executive Summary - Chart on Incremental Growth
Executive Summary - Data Table on Incremental Growth
Executive Summary - Chart on Company Market Positioning

2. Technavio Analysis

2.1 Analysis of price sensitivity, lifecycle, customer purchase basket, adoption rates, and purchase criteria

2.2 Criticality of inputs and Factors of differentiation

Chart on Overview on criticality of inputs and factors of differentiation

2.3 Factors of disruption

Chart on Overview on factors of disruption

2.4 Impact of drivers and challenges

Chart on Impact of drivers and challenges in 2025 and 2030

3. Market Landscape

3.1 Market ecosystem

Chart on Parent Market
Data Table on - Parent Market

3.2 Market characteristics

Chart on Market characteristics analysis

3.3 Value chain analysis

Chart on Value chain analysis

4. Market Sizing

4.1 Market definition

Data Table on Offerings of companies included in the market definition

4.2 Market segment analysis

Market segments

4.3 Market size 2025

4.4 Market outlook: Forecast for 2025-2030

Chart on Global - Market size and forecast 2025-2030 ($ million)
Data Table on Global - Market size and forecast 2025-2030 ($ million)
Chart on Global Market: Year-over-year growth 2025-2030 (%)
Data Table on Global Market: Year-over-year growth 2025-2030 (%)

5. Historic Market Size

5.1 Global Data Warehousing Market 2020 - 2024

Historic Market Size - Data Table on Global Data Warehousing Market 2020 - 2024 ($ million)

5.2 Deployment segment analysis 2020 - 2024

Historic Market Size - Deployment Segment 2020 - 2024 ($ million)

5.3 Type segment analysis 2020 - 2024

Historic Market Size - Type Segment 2020 - 2024 ($ million)

5.4 End-user segment analysis 2020 - 2024

Historic Market Size - End-user Segment 2020 - 2024 ($ million)

5.5 Geography segment analysis 2020 - 2024

Historic Market Size - Geography Segment 2020 - 2024 ($ million)

5.6 Country segment analysis 2020 - 2024

Historic Market Size - Country Segment 2020 - 2024 ($ million)

6. Qualitative Analysis

6.1 Impact of AI global data warehousing market

6.2 Impact of geopolitical conflict for global data warehousing market

7. Five Forces Analysis

7.1 Five forces summary

Five forces analysis - Comparison between 2025 and 2030

7.2 Bargaining power of buyers

Bargaining power of buyers - Impact of key factors 2025 and 2030

7.3 Bargaining power of suppliers

Bargaining power of suppliers - Impact of key factors in 2025 and 2030

7.4 Threat of new entrants

Threat of new entrants - Impact of key factors in 2025 and 2030

7.5 Threat of substitutes

Threat of substitutes - Impact of key factors in 2025 and 2030

7.6 Threat of rivalry

Threat of rivalry - Impact of key factors in 2025 and 2030

7.7 Market condition

Chart on Market condition - Five forces 2025 and 2030

8. Market Segmentation by Deployment

8.1 Market segments

Chart on Deployment - Market share 2025-2030 (%)
Data Table on Deployment - Market share 2025-2030 (%)

8.2 Comparison by Deployment

Chart on Comparison by Deployment
Data Table on Comparison by Deployment

8.3 On-premises - Market size and forecast 2025-2030

Chart on On-premises - Market size and forecast 2025-2030 ($ million)
Data Table on On-premises - Market size and forecast 2025-2030 ($ million)
Chart on On-premises - Year-over-year growth 2025-2030 (%)
Data Table on On-premises - Year-over-year growth 2025-2030 (%)

8.4 Hybrid - Market size and forecast 2025-2030

Chart on Hybrid - Market size and forecast 2025-2030 ($ million)
Data Table on Hybrid - Market size and forecast 2025-2030 ($ million)
Chart on Hybrid - Year-over-year growth 2025-2030 (%)
Data Table on Hybrid - Year-over-year growth 2025-2030 (%)

8.5 Cloud-based - Market size and forecast 2025-2030

Chart on Cloud-based - Market size and forecast 2025-2030 ($ million)
Data Table on Cloud-based - Market size and forecast 2025-2030 ($ million)
Chart on Cloud-based - Year-over-year growth 2025-2030 (%)
Data Table on Cloud-based - Year-over-year growth 2025-2030 (%)

8.6 Market opportunity by Deployment

Market opportunity by Deployment ($ million)
Data Table on Market opportunity by Deployment ($ million)

9. Market Segmentation by Type

9.1 Market segments

Chart on Type - Market share 2025-2030 (%)
Data Table on Type - Market share 2025-2030 (%)

9.2 Comparison by Type

Chart on Comparison by Type
Data Table on Comparison by Type

9.3 Structured and semi-structured data - Market size and forecast 2025-2030

Chart on Structured and semi-structured data - Market size and forecast 2025-2030 ($ million)
Data Table on Structured and semi-structured data - Market size and forecast 2025-2030 ($ million)
Chart on Structured and semi-structured data - Year-over-year growth 2025-2030 (%)
Data Table on Structured and semi-structured data - Year-over-year growth 2025-2030 (%)

9.4 Unstructured data - Market size and forecast 2025-2030

Chart on Unstructured data - Market size and forecast 2025-2030 ($ million)
Data Table on Unstructured data - Market size and forecast 2025-2030 ($ million)
Chart on Unstructured data - Year-over-year growth 2025-2030 (%)
Data Table on Unstructured data - Year-over-year growth 2025-2030 (%)

9.5 Market opportunity by Type

Market opportunity by Type ($ million)
Data Table on Market opportunity by Type ($ million)

10. Market Segmentation by End-user

10.1 Market segments

Chart on End-user - Market share 2025-2030 (%)
Data Table on End-user - Market share 2025-2030 (%)

10.2 Comparison by End-user

Chart on Comparison by End-user
Data Table on Comparison by End-user

10.3 BFSI - Market size and forecast 2025-2030

Chart on BFSI - Market size and forecast 2025-2030 ($ million)
Data Table on BFSI - Market size and forecast 2025-2030 ($ million)
Chart on BFSI - Year-over-year growth 2025-2030 (%)
Data Table on BFSI - Year-over-year growth 2025-2030 (%)

10.4 Healthcare - Market size and forecast 2025-2030

Chart on Healthcare - Market size and forecast 2025-2030 ($ million)
Data Table on Healthcare - Market size and forecast 2025-2030 ($ million)
Chart on Healthcare - Year-over-year growth 2025-2030 (%)
Data Table on Healthcare - Year-over-year growth 2025-2030 (%)

10.5 Retail and e-commerce - Market size and forecast 2025-2030

Chart on Retail and e-commerce - Market size and forecast 2025-2030 ($ million)
Data Table on Retail and e-commerce - Market size and forecast 2025-2030 ($ million)
Chart on Retail and e-commerce - Year-over-year growth 2025-2030 (%)
Data Table on Retail and e-commerce - Year-over-year growth 2025-2030 (%)

10.6 Others - Market size and forecast 2025-2030

Chart on Others - Market size and forecast 2025-2030 ($ million)
Data Table on Others - Market size and forecast 2025-2030 ($ million)
Chart on Others - Year-over-year growth 2025-2030 (%)
Data Table on Others - Year-over-year growth 2025-2030 (%)

10.7 Market opportunity by End-user

Market opportunity by End-user ($ million)
Data Table on Market opportunity by End-user ($ million)

11. Customer Landscape

11.1 Customer landscape overview

Analysis of price sensitivity, lifecycle, customer purchase basket, adoption rates, and purchase criteria

12. Geographic Landscape

12.1 Geographic segmentation

Chart on Market share by geography 2025-2030 (%)
Data Table on Market share by geography 2025-2030 (%)

12.2 Geographic comparison

Chart on Geographic comparison
Data Table on Geographic comparison

12.3 North America - Market size and forecast 2025-2030

Chart on North America - Market size and forecast 2025-2030 ($ million)
Data Table on North America - Market size and forecast 2025-2030 ($ million)
Chart on North America - Year-over-year growth 2025-2030 (%)
Data Table on North America - Year-over-year growth 2025-2030 (%)
Chart on Regional Comparison - North America
Data Table on Regional Comparison - North America

12.3.1 US - Market size and forecast 2025-2030

Chart on US - Market size and forecast 2025-2030 ($ million)
Data Table on US - Market size and forecast 2025-2030 ($ million)
Chart on US - Year-over-year growth 2025-2030 (%)
Data Table on US - Year-over-year growth 2025-2030 (%)

12.3.2 Canada - Market size and forecast 2025-2030

Chart on Canada - Market size and forecast 2025-2030 ($ million)
Data Table on Canada - Market size and forecast 2025-2030 ($ million)
Chart on Canada - Year-over-year growth 2025-2030 (%)
Data Table on Canada - Year-over-year growth 2025-2030 (%)

12.3.3 Mexico - Market size and forecast 2025-2030

Chart on Mexico - Market size and forecast 2025-2030 ($ million)
Data Table on Mexico - Market size and forecast 2025-2030 ($ million)
Chart on Mexico - Year-over-year growth 2025-2030 (%)
Data Table on Mexico - Year-over-year growth 2025-2030 (%)

12.4 Europe - Market size and forecast 2025-2030

Chart on Europe - Market size and forecast 2025-2030 ($ million)
Data Table on Europe - Market size and forecast 2025-2030 ($ million)
Chart on Europe - Year-over-year growth 2025-2030 (%)
Data Table on Europe - Year-over-year growth 2025-2030 (%)
Chart on Regional Comparison - Europe
Data Table on Regional Comparison - Europe

12.4.1 Germany - Market size and forecast 2025-2030

Chart on Germany - Market size and forecast 2025-2030 ($ million)
Data Table on Germany - Market size and forecast 2025-2030 ($ million)
Chart on Germany - Year-over-year growth 2025-2030 (%)
Data Table on Germany - Year-over-year growth 2025-2030 (%)

12.4.2 UK - Market size and forecast 2025-2030

Chart on UK - Market size and forecast 2025-2030 ($ million)
Data Table on UK - Market size and forecast 2025-2030 ($ million)
Chart on UK - Year-over-year growth 2025-2030 (%)
Data Table on UK - Year-over-year growth 2025-2030 (%)

12.4.3 France - Market size and forecast 2025-2030

Chart on France - Market size and forecast 2025-2030 ($ million)
Data Table on France - Market size and forecast 2025-2030 ($ million)
Chart on France - Year-over-year growth 2025-2030 (%)
Data Table on France - Year-over-year growth 2025-2030 (%)

12.4.4 Italy - Market size and forecast 2025-2030

Chart on Italy - Market size and forecast 2025-2030 ($ million)
Data Table on Italy - Market size and forecast 2025-2030 ($ million)
Chart on Italy - Year-over-year growth 2025-2030 (%)
Data Table on Italy - Year-over-year growth 2025-2030 (%)

12.4.5 Spain - Market size and forecast 2025-2030

Chart on Spain - Market size and forecast 2025-2030 ($ million)
Data Table on Spain - Market size and forecast 2025-2030 ($ million)
Chart on Spain - Year-over-year growth 2025-2030 (%)
Data Table on Spain - Year-over-year growth 2025-2030 (%)

12.4.6 The Netherlands - Market size and forecast 2025-2030

Chart on The Netherlands - Market size and forecast 2025-2030 ($ million)
Data Table on The Netherlands - Market size and forecast 2025-2030 ($ million)
Chart on The Netherlands - Year-over-year growth 2025-2030 (%)
Data Table on The Netherlands - Year-over-year growth 2025-2030 (%)

12.5 APAC - Market size and forecast 2025-2030

Chart on APAC - Market size and forecast 2025-2030 ($ million)
Data Table on APAC - Market size and forecast 2025-2030 ($ million)
Chart on APAC - Year-over-year growth 2025-2030 (%)
Data Table on APAC - Year-over-year growth 2025-2030 (%)
Chart on Regional Comparison - APAC
Data Table on Regional Comparison - APAC

12.5.1 China - Market size and forecast 2025-2030

Chart on China - Market size and forecast 2025-2030 ($ million)
Data Table on China - Market size and forecast 2025-2030 ($ million)
Chart on China - Year-over-year growth 2025-2030 (%)
Data Table on China - Year-over-year growth 2025-2030 (%)

12.5.2 Japan - Market size and forecast 2025-2030

Chart on Japan - Market size and forecast 2025-2030 ($ million)
Data Table on Japan - Market size and forecast 2025-2030 ($ million)
Chart on Japan - Year-over-year growth 2025-2030 (%)
Data Table on Japan - Year-over-year growth 2025-2030 (%)

12.5.3 India - Market size and forecast 2025-2030

Chart on India - Market size and forecast 2025-2030 ($ million)
Data Table on India - Market size and forecast 2025-2030 ($ million)
Chart on India - Year-over-year growth 2025-2030 (%)
Data Table on India - Year-over-year growth 2025-2030 (%)

12.5.4 South Korea - Market size and forecast 2025-2030

Chart on South Korea - Market size and forecast 2025-2030 ($ million)
Data Table on South Korea - Market size and forecast 2025-2030 ($ million)
Chart on South Korea - Year-over-year growth 2025-2030 (%)
Data Table on South Korea - Year-over-year growth 2025-2030 (%)

12.5.5 Australia - Market size and forecast 2025-2030

Chart on Australia - Market size and forecast 2025-2030 ($ million)
Data Table on Australia - Market size and forecast 2025-2030 ($ million)
Chart on Australia - Year-over-year growth 2025-2030 (%)
Data Table on Australia - Year-over-year growth 2025-2030 (%)

12.5.6 Indonesia - Market size and forecast 2025-2030

Chart on Indonesia - Market size and forecast 2025-2030 ($ million)
Data Table on Indonesia - Market size and forecast 2025-2030 ($ million)
Chart on Indonesia - Year-over-year growth 2025-2030 (%)
Data Table on Indonesia - Year-over-year growth 2025-2030 (%)

12.6 Middle East and Africa - Market size and forecast 2025-2030

Chart on Middle East and Africa - Market size and forecast 2025-2030 ($ million)
Data Table on Middle East and Africa - Market size and forecast 2025-2030 ($ million)
Chart on Middle East and Africa - Year-over-year growth 2025-2030 (%)
Data Table on Middle East and Africa - Year-over-year growth 2025-2030 (%)
Chart on Regional Comparison - Middle East and Africa
Data Table on Regional Comparison - Middle East and Africa

12.6.1 Saudi Arabia - Market size and forecast 2025-2030

Chart on Saudi Arabia - Market size and forecast 2025-2030 ($ million)
Data Table on Saudi Arabia - Market size and forecast 2025-2030 ($ million)
Chart on Saudi Arabia - Year-over-year growth 2025-2030 (%)
Data Table on Saudi Arabia - Year-over-year growth 2025-2030 (%)

12.6.2 UAE - Market size and forecast 2025-2030

Chart on UAE - Market size and forecast 2025-2030 ($ million)
Data Table on UAE - Market size and forecast 2025-2030 ($ million)
Chart on UAE - Year-over-year growth 2025-2030 (%)
Data Table on UAE - Year-over-year growth 2025-2030 (%)

12.6.3 South Africa - Market size and forecast 2025-2030

Chart on South Africa - Market size and forecast 2025-2030 ($ million)
Data Table on South Africa - Market size and forecast 2025-2030 ($ million)
Chart on South Africa - Year-over-year growth 2025-2030 (%)
Data Table on South Africa - Year-over-year growth 2025-2030 (%)

12.6.4 Israel - Market size and forecast 2025-2030

Chart on Israel - Market size and forecast 2025-2030 ($ million)
Data Table on Israel - Market size and forecast 2025-2030 ($ million)
Chart on Israel - Year-over-year growth 2025-2030 (%)
Data Table on Israel - Year-over-year growth 2025-2030 (%)

12.6.5 Turkey - Market size and forecast 2025-2030

Chart on Turkey - Market size and forecast 2025-2030 ($ million)
Data Table on Turkey - Market size and forecast 2025-2030 ($ million)
Chart on Turkey - Year-over-year growth 2025-2030 (%)
Data Table on Turkey - Year-over-year growth 2025-2030 (%)

12.7 South America - Market size and forecast 2025-2030

Chart on South America - Market size and forecast 2025-2030 ($ million)
Data Table on South America - Market size and forecast 2025-2030 ($ million)
Chart on South America - Year-over-year growth 2025-2030 (%)
Data Table on South America - Year-over-year growth 2025-2030 (%)
Chart on Regional Comparison - South America
Data Table on Regional Comparison - South America

12.7.1 Brazil - Market size and forecast 2025-2030

Chart on Brazil - Market size and forecast 2025-2030 ($ million)
Data Table on Brazil - Market size and forecast 2025-2030 ($ million)
Chart on Brazil - Year-over-year growth 2025-2030 (%)
Data Table on Brazil - Year-over-year growth 2025-2030 (%)

12.7.2 Argentina - Market size and forecast 2025-2030

Chart on Argentina - Market size and forecast 2025-2030 ($ million)
Data Table on Argentina - Market size and forecast 2025-2030 ($ million)
Chart on Argentina - Year-over-year growth 2025-2030 (%)
Data Table on Argentina - Year-over-year growth 2025-2030 (%)

12.7.3 Chile - Market size and forecast 2025-2030

Chart on Chile - Market size and forecast 2025-2030 ($ million)
Data Table on Chile - Market size and forecast 2025-2030 ($ million)
Chart on Chile - Year-over-year growth 2025-2030 (%)
Data Table on Chile - Year-over-year growth 2025-2030 (%)

12.8 Market opportunity by geography

Market opportunity by geography ($ million)
Data Tables on Market opportunity by geography ($ million)

13. Drivers, Challenges, and Opportunity

13.1 Market drivers

Mainstreaming of generative AI and industrialization of agentic data fabric architectures
Proliferation of real-time stream processing and strategic rise of multi-cloud data mesh ecosystems
Evolution of sovereign data governance and strategic demand for cyber-resilient zero-trust data warehousing standards

13.2 Market challenges

Escalation of cloud consumption costs and economic friction of unpredictable query latency
Fragmented regulatory landscape of data sovereignty and complexity of localized residency compliance
Technical debt of legacy system integration and critical scarcity of real-time data engineering talent

13.3 Impact of drivers and challenges

Impact of drivers and challenges in 2025 and 2030

13.4 Market opportunities

Institutionalization of AI-native lakehouse architectures and convergence of OLTP and OLAP
Growth of autonomous governance and AI-driven data observability frameworks
Strategic transition toward cloud-native warehousing and regional data immunity

14. Competitive Landscape

14.1 Overview

14.2

Overview on criticality of inputs and factors of differentiation

14.3 Landscape disruption

Overview on factors of disruption

14.4 Industry risks

Impact of key risks on business

15. Competitive Analysis

15.1 Companies profiled

Companies covered

15.2 Company ranking index

15.3 Market positioning of companies

Matrix on companies position and classification

15.4 Amazon.com Inc.

Amazon.com Inc. - Overview
Amazon.com Inc. - Business segments
Amazon.com Inc. - Key news
Amazon.com Inc. - Key offerings
Amazon.com Inc. - Segment focus
SWOT

15.5 Google LLC

Google LLC - Overview
Google LLC - Product / Service
Google LLC - Key offerings
SWOT

15.6 HCL Technologies Ltd.

HCL Technologies Ltd. - Overview
HCL Technologies Ltd. - Business segments
HCL Technologies Ltd. - Key news
HCL Technologies Ltd. - Key offerings
HCL Technologies Ltd. - Segment focus
SWOT

15.7 Hewlett Packard Enterprise Co.

Hewlett Packard Enterprise Co. - Overview
Hewlett Packard Enterprise Co. - Business segments
Hewlett Packard Enterprise Co. - Key offerings
Hewlett Packard Enterprise Co. - Segment focus
SWOT

15.8 Huawei Technologies Co. Ltd.

Huawei Technologies Co. Ltd. - Overview
Huawei Technologies Co. Ltd. - Business segments
Huawei Technologies Co. Ltd. - Key news
Huawei Technologies Co. Ltd. - Key offerings
Huawei Technologies Co. Ltd. - Segment focus
SWOT

15.9 IBM Corp.

IBM Corp. - Overview
IBM Corp. - Business segments
IBM Corp. - Key offerings
IBM Corp. - Segment focus
SWOT

15.10 Informatica Inc.

Informatica Inc. - Overview
Informatica Inc. - Business segments
Informatica Inc. - Key news
Informatica Inc. - Key offerings
Informatica Inc. - Segment focus
SWOT

15.11 Infosys Ltd.

Infosys Ltd. - Overview
Infosys Ltd. - Business segments
Infosys Ltd. - Key news
Infosys Ltd. - Key offerings
Infosys Ltd. - Segment focus
SWOT

15.12 Microsoft Corp.

Microsoft Corp. - Overview
Microsoft Corp. - Business segments
Microsoft Corp. - Key news
Microsoft Corp. - Key offerings
Microsoft Corp. - Segment focus
SWOT

15.13 MongoDB Inc.

MongoDB Inc. - Overview
MongoDB Inc. - Business segments
MongoDB Inc. - Key offerings
MongoDB Inc. - Segment focus
SWOT

15.14 Oracle Corp.

Oracle Corp. - Overview
Oracle Corp. - Business segments
Oracle Corp. - Key news
Oracle Corp. - Key offerings
Oracle Corp. - Segment focus
SWOT

15.15 SAP SE

SAP SE - Overview
SAP SE - Business segments
SAP SE - Key news
SAP SE - Key offerings
SAP SE - Segment focus
SWOT

15.16 SingleStore Inc.

SingleStore Inc. - Overview
SingleStore Inc. - Product / Service
SingleStore Inc. - Key offerings
SWOT

15.17 Snowflake Inc.

Snowflake Inc. - Overview
Snowflake Inc. - Business segments
Snowflake Inc. - Key offerings
Snowflake Inc. - Segment focus
SWOT

15.18 Teradata Corp.

Teradata Corp. - Overview
Teradata Corp. - Business segments
Teradata Corp. - Key offerings
Teradata Corp. - Segment focus
SWOT

16. Appendix

16.1 Scope of the report

Market definition
Objectives
Notes and caveats

16.2 Inclusions and exclusions checklist

Inclusions checklist
Exclusions checklist

16.3 Currency conversion rates for US$

16.4 Research methodology

16.5 Data procurement

Information sources

16.6 Data validation

16.7 Validation techniques employed for market sizing

16.8 Data synthesis

16.9 360 degree market analysis

16.10 List of abbreviations

Research Methodology

Technavio presents a detailed picture of the market by way of study, synthesis, and summation of data from multiple sources. The analysts have presented the various facets of the market with a particular focus on identifying the key industry influencers. The data thus presented is comprehensive, reliable, and the result of extensive research, both primary and secondary.

INFORMATION SOURCES

Primary sources

  • Manufacturers and suppliers
  • Channel partners
  • Industry experts
  • Strategic decision makers

Secondary sources

  • Industry journals and periodicals
  • Government data
  • Financial reports of key industry players
  • Historical data
  • Press releases

DATA ANALYSIS

Data Synthesis

  • Collation of data
  • Estimation of key figures
  • Analysis of derived insights

Data Validation

  • Triangulation with data models
  • Reference against proprietary databases
  • Corroboration with industry experts

REPORT WRITING

Qualitative

  • Market drivers
  • Market challenges
  • Market trends
  • Five forces analysis

Quantitative

  • Market size and forecast
  • Market segmentation
  • Geographical insights
  • Competitive landscape

Interested in this report?

Get your sample now to see our research methodology and insights!

Download Now

Frequently Asked Questions

Data Warehousing market growth will increase by USD 39085.2 million during 2026-2030.

The Data Warehousing market is expected to grow at a CAGR of 14.9% during 2026-2030.

Data Warehousing market is segmented by Deployment (On-premises, Hybrid, Cloud-based) Type (Structured and semi-structured data, Unstructured data) End-user (BFSI, Healthcare, Retail and e-commerce, Others)

Amazon.com Inc., Cloudera Inc., Databricks Inc., Firebolt, Google LLC, HCL Technologies Ltd., Hewlett Packard Enterprise Co., Huawei Technologies Co. Ltd., IBM Corp., Informatica Inc., Infosys Ltd., Microsoft Corp., MongoDB Inc., Oracle Corp., QlikTech International AB, SAP SE, SingleStore Inc., Snowflake Inc., Teradata Corp., Yellowbrick Data Inc. are a few of the key vendors in the Data Warehousing market.

North America will register the highest growth rate of 39.4% among the other regions. Therefore, the Data Warehousing market in North America is expected to garner significant business opportunities for the vendors during the forecast period.

US, Canada, Mexico, Germany, UK, France, Italy, Spain, The Netherlands, China, Japan, India, South Korea, Australia, Indonesia, Saudi Arabia, UAE, South Africa, Israel, Turkey, Brazil, Argentina, Chile

  • Mainstreaming of generative AI and industrialization of agentic data fabric architectures is the driving factor this market.

The Data Warehousing market vendors should focus on grabbing business opportunities from the Deployment segment as it accounted for the largest market share in the base year.
RIA - Research AI Assistant
Ask RIA