Nordic Countries Bike Sharing Market Size 2024-2028
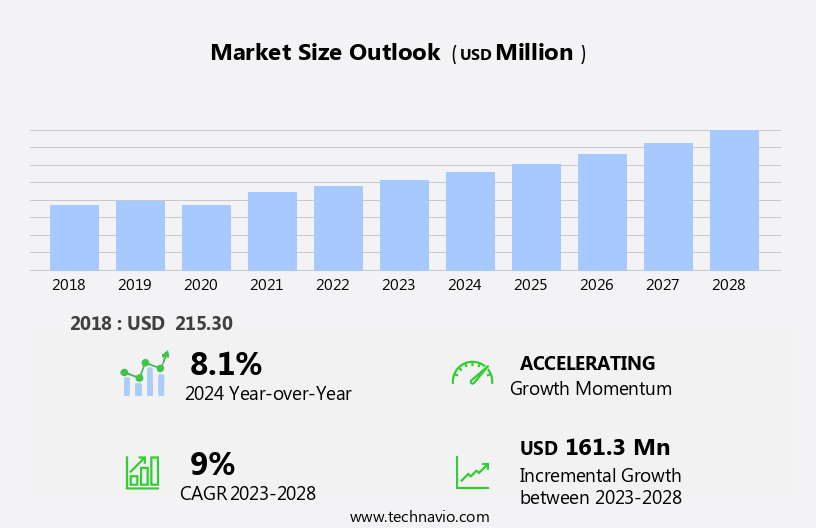
The nordic countries bike sharing market size is forecast to increase by USD 161.3 million, at a CAGR of 9% between 2023 and 2028.
- The market is experiencing significant growth, driven by increasing traffic congestion and the rising adoption of dockless bike sharing services. The region's urban population is on the rise, leading to increased demand for sustainable transportation alternatives. Dockless bike sharing services, with their convenience and flexibility, are gaining popularity, particularly among the tech-savvy demographic. However, this market is not without challenges. The risks of bike theft and the need for frequent maintenance pose significant obstacles. As bike sharing programs expand, ensuring the security of the bikes becomes increasingly important. Additionally, maintaining a large fleet of bikes requires substantial resources and logistical planning.
- Companies must address these challenges effectively to ensure the long-term success of their operations. To capitalize on the market's potential, players must focus on implementing robust security measures and developing efficient maintenance strategies. By doing so, they can provide a seamless user experience and build customer trust, ultimately driving growth in the Nordic Bike Sharing Market.
What will be the size of the Nordic Countries Bike Sharing Market during the forecast period?
Explore in-depth regional segment analysis with market size data - historical 2018-2022 and forecasts 2024-2028 - in the full report.
Request Free Sample
- The Nordic bike sharing market is experiencing significant growth, driven by the integration of smart city applications and multimodal transportation solutions. City governance is embracing innovative urban transportation options, including bike sharing, as part of their green mobility initiatives and carbon offsetting strategies. The micro-mobility market trends reflect a shift towards sustainable urban development and community engagement. Ride-hailing services and public transportation are merging, with bike sharing serving as a key component of data-driven decision making and dynamic pricing mechanisms. Smart city applications, such as predictive maintenance models and artificial intelligence, are improving fleet optimization strategies and enhancing user experience.
- Green transportation policies are shaping the future of mobility, with bike sharing playing a crucial role in the shared mobility ecosystem. Sustainability reporting and user data privacy are essential considerations for bike sharing providers, ensuring trust and transparency in the market. E-scooter sharing and other micro-mobility solutions are complementing traditional bike sharing offerings, providing commuters with diverse commuting solutions. The integration of bike sharing with public transportation and ride-hailing services is creating a seamless and efficient transportation network. The Nordic bike sharing market is at the forefront of sustainable urban development, with a focus on social impact assessment and community engagement.
- The use of smart city applications and data-driven decision making is enabling more efficient and effective bike sharing services, while also promoting sustainable transportation practices.
How is this market segmented?
The market research report provides comprehensive data (region-wise segment analysis), with forecasts and estimates in "USD million" for the period 2024-2028, as well as historical data from 2018-2022 for the following segments.
- Vehicle Type
- Traditional bike
- E-bike
- Type
- Dockless
- Docked
- Geography
- Europe
- Denmark
- Finland
- Norway
- Sweden
- Europe
By Vehicle Type Insights
The traditional bike segment is estimated to witness significant growth during the forecast period.
In the Nordic countries, bike sharing markets are experiencing significant growth through the integration of advanced technologies and urban infrastructure. Pricing strategies vary, with some systems offering hourly or daily rates, while others employ subscription models. Last-mile delivery services ensure seamless transportation from public transit to final destinations, enhancing overall mobility solutions. Cycling infrastructure is a priority, with bike path networks and parking facilities expanding to accommodate increasing demand. Micro-mobility solutions, such as e-bikes and scooters, are also gaining popularity. Smart bike systems utilize GPS tracking and real-time availability to optimize user experience. Public-private partnerships and government subsidies support the development of sustainable city infrastructure, including bike sharing programs and electric bike infrastructure.
Safety standards are rigorously enforced, with helmet requirements and bike lock technology ensuring user protection. Urban planning integrates bike sharing into data-driven city management, with route optimization algorithms and traffic congestion mitigation strategies. Customer loyalty programs and sustainable transportation initiatives foster long-term engagement and environmental benefits. Bike sharing regulations ensure accessibility for all, with focus on user experience design and bike theft prevention. The public health impact of bike sharing is significant, promoting active transportation and reducing carbon emissions. Urban mobility solutions continue to evolve, with e-bike integration and smart city initiatives at the forefront of innovation.
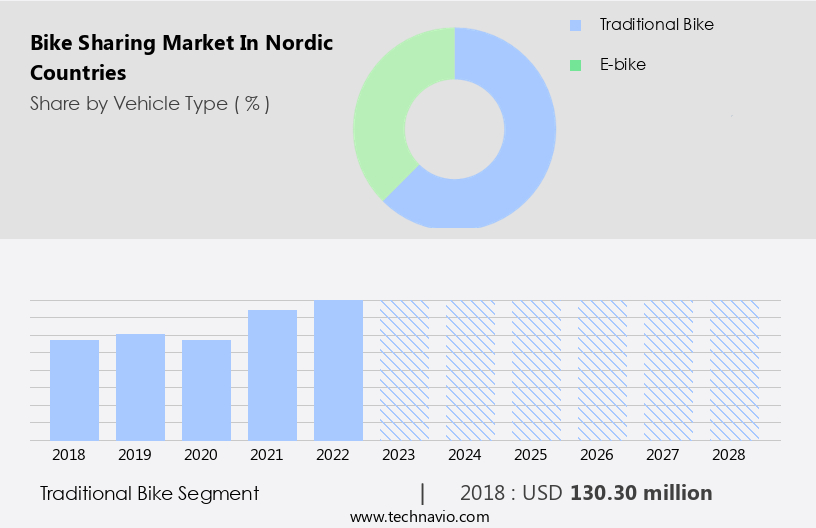
The Traditional bike segment was valued at USD 130.30 million in 2018 and showed a gradual increase during the forecast period.
Market Dynamics
Our researchers analyzed the data with 2023 as the base year, along with the key drivers, trends, and challenges. A holistic analysis of drivers will help companies refine their marketing strategies to gain a competitive advantage.
What are the Nordic Countries Bike Sharing Market drivers leading to the rise in adoption of the Industry?
- Traffic congestion, which is a significant challenge in many urban areas, serves as the primary catalyst for the market in question, driving its growth.
- Bike sharing programs have gained significant traction in Nordic Countries as a solution to mitigate traffic congestion and promote public health. These initiatives offer a convenient, eco-friendly, and cost-effective alternative to traditional modes of transportation, particularly cars. The integration of e-bikes and advanced technologies such as bike lock systems, route optimization algorithms, and smart city initiatives further enhance the appeal of bike sharing. Reduced carbon emissions are a key benefit of bike sharing, making it an attractive option for environmentally conscious consumers. Moreover, bike sharing contributes positively to public health by encouraging physical activity. Traffic congestion is a pressing issue in Nordic Countries due to population growth, urbanization, and increasing vehicle ownership.
- Bike sharing programs offer a viable solution to this problem by reducing the number of cars on the road. The implementation of bike sharing programs is a testament to the commitment of Nordic Countries to sustainable transportation and smart city initiatives. The integration of technology, such as bike lock systems and route optimization algorithms, ensures a seamless and efficient user experience. As the world grapples with traffic congestion and the need for sustainable transportation solutions, bike sharing programs in Nordic Countries serve as a model for other regions to follow.
What are the Nordic Countries Bike Sharing Market trends shaping the Industry?
- Dockless bike sharing services are gaining significant traction in the market, representing an emerging trend. This shift towards flexible and convenient transportation options is expected to shape the industry landscape in the coming months.
- The Nordic bike sharing market has experienced significant growth in recent years, with an increasing focus on dockless bikes. These bikes offer convenience as they can be picked up and dropped off anywhere, eliminating the need for docking stations. A key advantage of dockless bikes is their integration with GPS tracking systems, ensuring easy location and minimizing issues of damage and theft. Users can access bikes through smartphone apps, making the process seamless and convenient. companies are shifting towards dockless solutions to reduce costs associated with docking stations and increase bike availability. Cycling infrastructure, including bike path networks and urban planning, is also a crucial factor in the market's growth.
- Micro-mobility solutions, such as e-scooters and bike sharing, are gaining popularity as smart city initiatives. Smart bike systems offer features like real-time bike availability, usage patterns, and maintenance schedules, enhancing the overall user experience. Accessibility for all is a priority in the bike sharing market, with efforts being made to cater to diverse user groups. The integration of bike sharing with public transportation systems is also a trend gaining traction. Last-mile delivery services are increasingly utilizing bike sharing as a cost-effective and eco-friendly solution. Overall, the Nordic bike sharing market is expected to continue growing, driven by these factors and the increasing focus on sustainable and efficient transportation solutions.
How does Nordic Countries Bike Sharing Market face challenges during its growth?
- The industry's growth is hindered by the significant risks of theft and the frequent requirement for maintenance.
- The Nordic bike sharing market is experiencing challenges due to bike theft and maintenance issues. Companies are installing advanced security mechanisms in bikes, but theft remains a significant concern. This scarcity of bicycles, as evidenced by a discrepancy between the actual number of bikes and the real-time availability shown on apps, is leading to customer dissatisfaction. Improper riding practices and frequent falls also necessitate frequent maintenance, further straining the market. Data-driven city management and public-private partnerships are crucial in addressing these challenges.
- Government subsidies and helmet requirements can encourage more responsible usage and reduce theft. Subscription models and mobile app integration can facilitate demand forecasting models, enabling companies to optimize their inventory and maintenance schedules. Safety standards must be strictly enforced to minimize accidents and ensure user safety. By focusing on these areas, the Nordic bike sharing market can mitigate theft-related challenges and enhance the overall user experience.
Exclusive Nordic Countries Bike Sharing Market Customer Landscape
The market forecasting report includes the adoption lifecycle of the market, covering from the innovator's stage to the laggard's stage. It focuses on adoption rates in different regions based on penetration. Furthermore, the report also includes key purchase criteria and drivers of price sensitivity to help companies evaluate and develop their market growth analysis strategies.
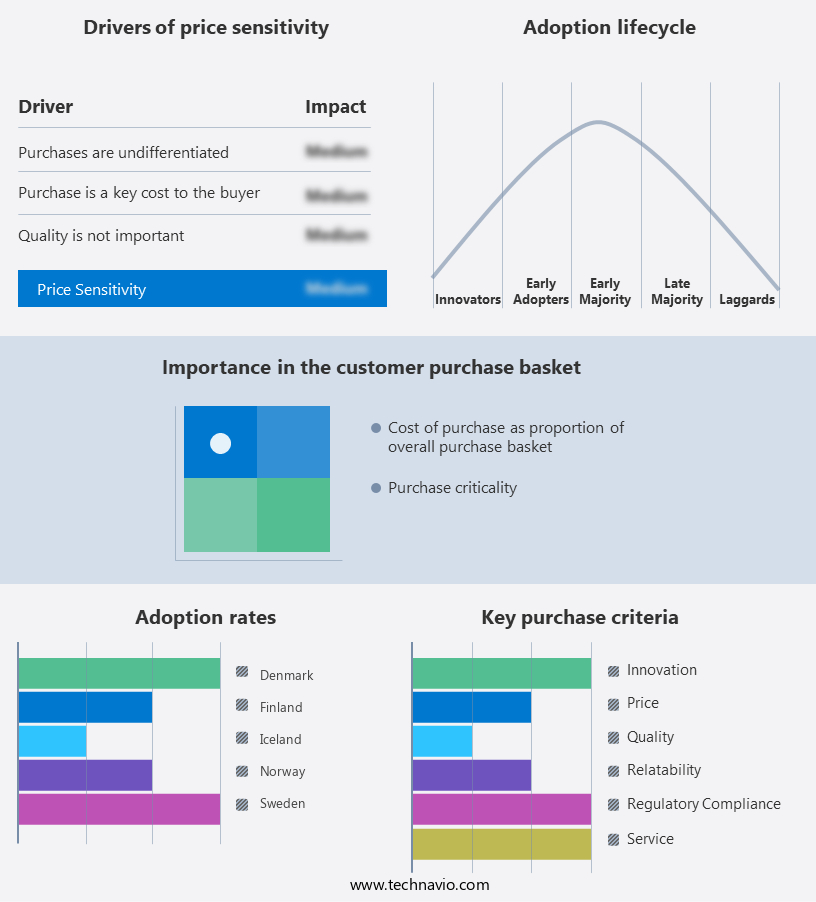
Customer Landscape
Key Companies & Market Insights
Companies are implementing various strategies, such as strategic alliances, market forecast partnerships, mergers and acquisitions, geographical expansion, and product/service launches, to enhance their presence in the market.
The market research and growth report includes detailed analyses of the competitive landscape of the market and information about key companies, including:
- Bikeshare Danmark AS
- Donkey Republic Admin ApS
- Helsinki Regional Transport Authority
- nextbike GmbH
- OSS Rafrennur ehf.
- Rekola Bikesharing sro
- Saimaa Bikes
- ShareBike AS
- Smartbike Scandinavia
- SMOOVE SAS
- UIP Drift AS
- Urban Sharing AS
- VAIMOO
Qualitative and quantitative analysis of companies has been conducted to help clients understand the wider business environment as well as the strengths and weaknesses of key market players. Data is qualitatively analyzed to categorize companies as pure play, category-focused, industry-focused, and diversified; it is quantitatively analyzed to categorize companies as dominant, leading, strong, tentative, and weak.
Recent Development and News in Bike Sharing Market In Nordic Countries
- In March 2023, Copenhagen-based bike sharing company Donkey Republic raised â¬10 million in a Series B funding round led by E.ON and Nordic Growth Capital, aiming to expand its electric bike fleet and enter new markets in the Nordic region (Bloomberg).
- In May 2023, Swedish bike sharing provider Vélibo announced a strategic partnership with Volvo Cars, enabling seamless integration of bike sharing services into Volvo's connected car platform, enhancing the urban mobility experience for customers (Volvo Cars Press Release).
- In July 2024, the Norwegian government introduced a new policy incentivizing the use of bike sharing services, offering tax exemptions for companies providing such services and subsidies for low-income individuals, boosting the market growth in the country (Norwegian Ministry of Transport and Communications).
- In September 2024, Finnish bike sharing startup, Toivo, launched its new e-bike sharing service in Helsinki, featuring a unique feature allowing users to rent bikes using their mobile phones without the need for a physical membership card, setting a new standard for the industry (Toivo Press Release).
Research Analyst Overview
The market continues to evolve, with dynamic market dynamics shaping the industry's growth. Pricing strategies adapt to consumer preferences and market trends, while last-mile delivery services integrate seamlessly with urban logistics. Cycling infrastructure expands, embracing micro-mobility solutions and smart bike systems with real-time GPS tracking. Docking stations and bike parking facilities are strategically placed, prioritizing accessibility for all. Urban planning and bike path networks intertwine, fostering data-driven city management and sustainable city development. Government subsidies and public-private partnerships fuel innovation, ensuring helmet requirements and safety standards are met. Subscription models and customer loyalty programs attract a diverse user base, integrating mobile app functionality for enhanced user experience.
Bike sharing regulations and sustainable transportation initiatives promote reduced carbon emissions and improved public health. Electric bike infrastructure and bike lanes are prioritized, with route optimization algorithms and e-bike integration enhancing the overall user experience. Bike theft prevention measures and smart city initiatives further strengthen the market's resilience and adaptability.
Dive into Technavio's robust research methodology, blending expert interviews, extensive data synthesis, and validated models for unparalleled Bike Sharing Market in Nordic Countries insights. See full methodology.
|
Market Scope |
|
|
Report Coverage |
Details |
|
Page number |
147 |
|
Base year |
2023 |
|
Historic period |
2018-2022 |
|
Forecast period |
2024-2028 |
|
Growth momentum & CAGR |
Accelerate at a CAGR of 9% |
|
Market growth 2024-2028 |
USD 161.3 million |
|
Market structure |
Concentrated |
|
YoY growth 2023-2024(%) |
8.1 |
|
Competitive landscape |
Leading Companies, Market Positioning of Companies, Competitive Strategies, and Industry Risks |
What are the Key Data Covered in this Market Research Report?
- CAGR of the market during the forecast period
- Detailed information on factors that will drive the market growth and forecasting between 2024 and 2028
- Precise estimation of the size of the market and its contribution of the market in focus to the parent market
- Accurate predictions about upcoming market growth and trends and changes in consumer behaviour
- Growth of the market across Nordic Countries
- Thorough analysis of the market's competitive landscape and detailed information about companies
- Comprehensive analysis of factors that will challenge the growth of market companies
We can help! Our analysts can customize this market research report to meet your requirements Get in touch
 RIA -
RIA - 
