Bio Polyols Market Analysis, Size, and Forecast 2025-2029: North America (US and Canada), Europe (France, Germany, Italy, The Netherlands, UK), Middle East and Africa , APAC (China, India, Japan), South America , and Rest of World (ROW)

Bio Polyols Market Analysis, Size, and Forecast 2025-2029:
North America (US and Canada), Europe (France, Germany, Italy, The Netherlands, UK), Middle East and Africa , APAC (China, India, Japan), South America , and Rest of World (ROW)

Published: Apr 2025 228 Pages SKU: IRTNTR73250

Market Overview at a Glance

$5.61 B
Market Opportunity
10.9%
CAGR
9.4
YoY growth 2024-2025(%)

Bio Polyols Market Size 2025-2029

The bio polyols market size is forecast to increase by USD 5.61 billion, at a CAGR of 10.9% between 2024 and 2029.

  • The market is experiencing significant growth, driven primarily by the increasing demand in the automotive and construction industries. These sectors are adopting bio-based polyols as a sustainable alternative to petroleum-derived counterparts, contributing to the market's expansion. Moreover, innovation in polyurethane foams, which utilize bio polyols as key raw materials, is further fueling market growth. However, the market faces challenges due to the volatile prices of raw materials, which can impact the profitability of manufacturers and hinder market expansion.
  • Companies in the market must navigate these price fluctuations and explore strategies to secure a stable supply chain to capitalize on the growing demand and maintain competitiveness.

What will be the Size of the Bio Polyols Market during the forecast period?

Bio Polyols Market Size

Explore in-depth regional segment analysis with market size data - historical 2019-2023 and forecasts 2025-2029 - in the full report.  
Request Free Sample

The market continues to evolve, driven by the ongoing research and development in green chemistry and sustainable production methods. Polyol manufacturers are increasingly focusing on bio-based and renewable resources to produce these essential building blocks for various industries. The versatile nature of polyols is showcased in their applications across sectors, including flexible and rigid foams, coatings, adhesives, and polyurethane systems. Bio-based polyols, derived from renewable resources, are gaining traction due to their reduced carbon footprint and alignment with the bio-based economy and circular economy principles. Sustainable polyols, which include those with low molecular weight and hydroxyl numbers, are in high demand due to their environmental benefits and improved performance characteristics.

Polyol advancement is a continuous process, with ongoing research focusing on polycarbonate, bio-derived, aliphatic, and polyester polyols. These advancements are shaping the polyol market analysis, with trends toward increased regulation and certification to meet evolving consumer demands and industry standards. Polyol characterization and functionality are crucial factors in determining their suitability for various applications. Regulations and certifications, such as those related to carbon footprint, acid value, and water content, are essential considerations for polyol suppliers and distributors in the competitive landscape. The polyol industry overview reflects the dynamic nature of this market, with ongoing innovation, renewable resource utilization, and life cycle analysis shaping its future.The market size is expected to grow as demand for sustainable and high-performance polyols continues to increase.

How is this Bio Polyols Industry segmented?

The bio polyols industry research report provides comprehensive data (region-wise segment analysis), with forecasts and estimates in "USD million" for the period 2025-2029, as well as historical data from 2019-2023 for the following segments.

  • Application
    • Foams
    • CASE
  • Type
    • Polyether polyols
    • Polyester polyols
  • End-user
    • Furniture and bedding
    • Construction and insulation
    • Automotive
    • Packaging
    • Others
  • Geography
    • North America
      • US
      • Canada
    • Europe
      • France
      • Germany
      • Italy
      • The Netherlands
      • UK
    • APAC
      • China
      • India
      • Japan
    • Rest of World (ROW)

By Application Insights

The foams segment is estimated to witness significant growth during the forecast period.

The market encompasses the production and development of polyols, a crucial component in the manufacturing of various foams and other polyurethane products. Polyols are versatile chemicals with distinct properties, including hydroxyl number, molecular weight, and functionality, which determine their application in creating flexible or rigid foams, polyurethane coatings, and adhesives. A significant portion of the market focuses on the production of aromatic and aliphatic polyols, with aromatic polyols derived from non-renewable resources and aliphatic polyols derived from renewable sources, such as plant-based materials. The shift towards sustainable and bio-based polyols, driven by the bio-based economy and circular economy, has led to advancements in polyol research and manufacturing.

Polyol properties, such as viscosity, reactivity, and thermal stability, play a crucial role in determining their application. For instance, low-molecular-weight polyols are used in the production of rigid foams, while high-molecular-weight polyols are used in the creation of flexible foams. Polyol regulations, including those related to carbon footprint and certifications, have become increasingly important in the market. Polyol suppliers and manufacturers are focusing on reducing their carbon footprint through renewable resource utilization and bio-based material production. Additionally, the market is witnessing a trend towards polyol innovation, with companies developing new polyol blends and technologies to cater to various applications.

The flexible foams segment, a major application area for polyols, includes polyurethane flexible foams, which offer excellent cushioning properties and are widely used in bedding, furniture, automotive interiors, and carpet underlay. These foams provide thermal insulation, easy maintenance, and are recyclable, making them an attractive choice for manufacturers. The polyol market is expected to grow significantly due to the increasing demand for sustainable and bio-based materials, advancements in polyol technology, and the growing popularity of polyurethane foams in various industries. Polyol distributors play a vital role in ensuring the availability and accessibility of these essential chemicals to manufacturers. In summary, the market is a dynamic and evolving industry, driven by the demand for sustainable and renewable materials, advancements in polyol technology, and the growing popularity of polyurethane foams in various applications. The market is expected to continue growing, with a focus on reducing carbon footprint, increasing renewable resource utilization, and developing innovative polyol blends and technologies.

Bio Polyols Market Size

Request Free Sample

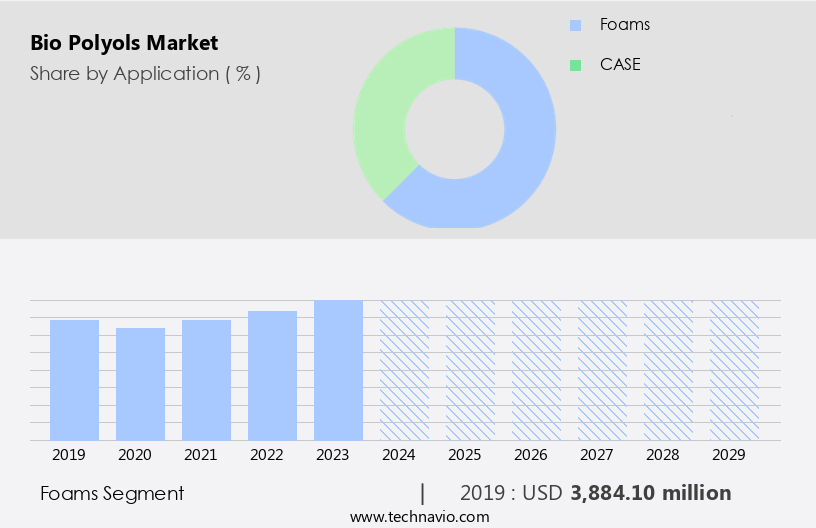
The Foams segment was valued at USD 3.88 billion in 2019 and showed a gradual increase during the forecast period.

Regional Analysis

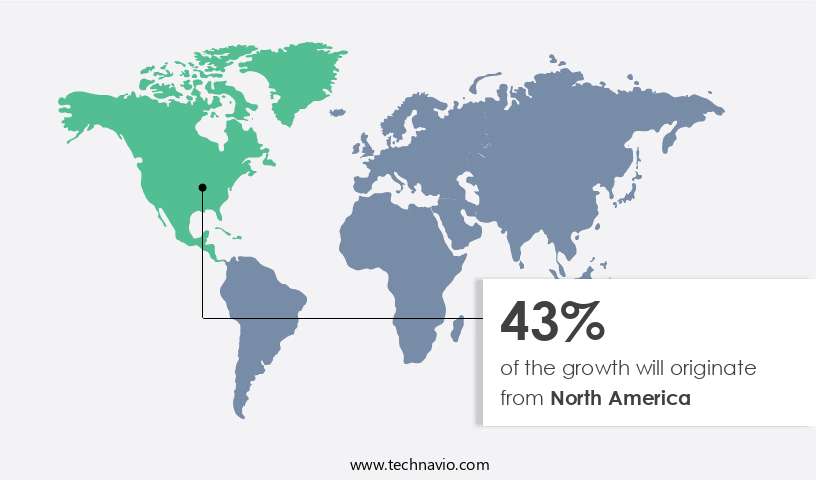
North America is estimated to contribute 43% to the growth of the global market during the forecast period.Technavio's analysts have elaborately explained the regional trends and drivers that shape the market during the forecast period.

Bio Polyols Market Share by Geography

 Request Free Sample

The market in the US is experiencing significant growth, driven by the increasing demand for bio polyols in various industries, particularly healthcare and consumer goods. The US is the largest consumer of bio polyols in North America, with major manufacturers such as American Foam Products Inc., DuPont de Nemours, Inc, and Huntsman International based in the country. Bio polyols are increasingly used in healthcare applications due to their cost-effectiveness, strength, and durability. They are utilized in the production of disposable medical gloves, catheters, hospital bedding, surgical drapes, and wound dressings. The demand for bio polyols is also driven by their role in the production of flexible foams, which are essential in various industries, including automotive, construction, and furniture.

The market growth is further fueled by advancements in polyol technology, such as the development of plant-based and renewable polyols, which align with the bio-based economy and circular economy trends. Additionally, the focus on reducing carbon footprint and increasing sustainability has led to the growth of the bio-based polyols market. The market is segmented based on molecular weight, hydroxyl number, and polyol type, including aliphatic, aromatic, polyester, polyether, and polycarbonate polyols. The market is also subject to regulations regarding acid value and other quality standards. Bio polyol manufacturers are investing in research and innovation to develop new blends and applications, ensuring the competitiveness of the market.

Bio-derived and sustainable polyols are gaining popularity due to their eco-friendly nature and reduced environmental impact. The market is expected to continue growing as the demand for bio-based materials increases and the focus on sustainability continues.

Market Dynamics

Our researchers analyzed the data with 2024 as the base year, along with the key drivers, trends, and challenges. A holistic analysis of drivers will help companies refine their marketing strategies to gain a competitive advantage.

What are the key market drivers leading to the rise in the adoption of Bio Polyols Industry?

  • The automotive and construction industries' growing requirement for bio polyols serves as the primary market driver. 
  • Bio polyols play a pivotal role in the production of polyurethane foams, which find extensive applications in various industries such as automotive and construction. These end-use sectors account for significant demand in the market. In particular, the automotive industry's increasing use of polyurethane foams for manufacturing parts like side skirts, wiper cowls, roll pans, and bumpers is driving market growth. Additionally, the construction industry's reliance on polyurethane foams for insulation and other applications further boosts the market's expansion. Green chemistry and polyol development continue to be key focus areas for manufacturers to produce eco-friendly and high-performance polyols.
  • Furthermore, research and innovation in plant-based polyols and polyol blends with specific molecular weights cater to the evolving regulatory landscape and diverse application requirements. The market is anticipated to experience moderate growth due to these factors.

What are the market trends shaping the Bio Polyols Industry?

  • The trend in the market points towards innovation as the key driver in the polyurethane foams industry.
  • The polyol market encompasses a significant role in the production of polyurethanes, which are formed by reacting polyols, alcohols with multiple reactive hydroxyl groups, with diisocyanates or polymeric isocyanates. Recent advancements in the polyol industry include the development of bio-based and sustainable polyols, derived from renewable resources, aligning with the bio-based economy and circular economy trends. These bio-derived polyols, such as aliphatic polyols and polyester polyols, possess a hydroxyl number that meets the requirements for various applications, including polycarbonate polyols.
  • Companies are focusing on the incorporation of photo-responsive groups, like coumarin, into the polyurethane foam backbone to create photo cross-linkable polyurethanes. These innovative polyols can be used to manufacture paints and coatings, as they dimerize when exposed to UV light of approximately 340nm and can be cleaved again under reduced light of approximately 250nm. This development adds to the versatility and sustainability of the polyol market.

What challenges does the Bio Polyols Industry face during its growth?

  • The volatile pricing of raw materials poses a significant challenge to the industry's growth trajectory.  Bio polyols are essential organic compounds characterized by multiple hydroxyl groups. These polyols are classified into two main categories: polyester polyols and polyether polyols. The primary application of polyols is in the production of polyurethane foams, which are formed through the reaction between diisocyanates and polyols. This reaction causes the foam to expand significantly and then harden. Polyol pricing is subject to market dynamics, with fluctuations in raw material prices leading to volatility. In the US market, prices remained stable at approximately USD2,140 per metric ton in Q2 and Q3 2024, signifying consistent demand and a sufficient supply.
  • Conversely, in Japan, prices decreased by 8% from USD1,281 per metric ton in Q2 to USD1,230 per metric ton in Q3 2024, primarily due to increased upstream propylene costs and fluctuating crude oil prices. Polyol functionality is crucial in various industries, including rigid foam manufacturing. Sustainability and certifications are essential factors influencing the market. Bio-based polyols, derived from renewable resources, have gained popularity due to their reduced carbon footprint. Polyol standards ensure consistent product quality and safety. Market segmentation includes end-use industries, such as construction, automotive, and packaging. Market trends include the development of new polyol technologies to improve performance and reduce environmental impact.
  • Regulations regarding bio-based polyols continue to evolve, impacting market growth. The acid value of polyols is a critical quality indicator, affecting their reactivity and foam properties.

Exclusive Customer Landscape

The bio polyols market forecasting report includes the adoption lifecycle of the market, covering from the innovator's stage to the laggard's stage. It focuses on adoption rates in different regions based on penetration. Furthermore, the bio polyols market report also includes key purchase criteria and drivers of price sensitivity to help companies evaluate and develop their market growth analysis strategies.

Bio Polyols Market Share by Geography

 Customer Landscape

Key Companies & Market Insights

Companies are implementing various strategies, such as strategic alliances, bio polyols market forecast, partnerships, mergers and acquisitions, geographical expansion, and product/service launches, to enhance their presence in the industry.

Alberdingk Boley GmbH - Castor oil-based ALBODUR products from our company deliver a diverse array of surface coating solutions, spanning from flexible to extremely hard formulations. These offerings encompass superior quality decorative finishes. Homogeneous curing enables the application of substantial coating thicknesses, resulting in enhanced chemical resistance and increased hydrophobicity compared to conventional alternatives.

The industry research and growth report includes detailed analyses of the competitive landscape of the market and information about key companies, including:

  • Alberdingk Boley GmbH
  • Arkema
  • BASF SE
  • Bio Based Technologies LLC
  • Cargill Inc.
  • Castor International BV
  • Covestro AG
  • Croda International Plc
  • Emery Oleochemicals Group
  • Global Bio chem Technology Group Co. Ltd.
  • Huntsman Corp.
  • INVISTA Equities, LLC
  • Jayant Agro Organics Ltd.
  • Mitsui Chemicals Inc.
  • Nivapol
  • Stahl Holdings B.V.
  • Stepan Co.
  • The Dow Chemical Co.
  • Vertellus Holdings LLC
  • Xuchuan Chemical Suzhou Co. Ltd.

Qualitative and quantitative analysis of companies has been conducted to help clients understand the wider business environment as well as the strengths and weaknesses of key industry players. Data is qualitatively analyzed to categorize companies as pure play, category-focused, industry-focused, and diversified; it is quantitatively analyzed to categorize companies as dominant, leading, strong, tentative, and weak.

Recent Development and News in Bio Polyols Market

  • In February 2023, BASF SE, a leading global chemical producer, announced the expansion of its bio-based polyols production capacity at its site in Ludwigshafen, Germany. This expansion aims to meet the growing demand for sustainable materials in the polyurethanes industry (BASF press release, 2023).
  • In May 2024, Covestro AG, another major player in the polyols market, unveiled its new polyol, Baydur N 1101, which is derived from renewable raw materials. This innovation marks a significant step towards the production of more sustainable polyurethane systems (Covestro press release, 2024).
  • In July 2024, DuPont de Nemours, Inc. And BioAmber Inc. Entered into a strategic partnership to develop and commercialize bio-based polyols derived from renewable feedstocks. This collaboration is expected to bring a more sustainable alternative to the market and reduce the dependency on fossil fuels (DuPont de Nemours press release, 2024).
  • In December 2024, Lonza Group AG received regulatory approval from the US Environmental Protection Agency (EPA) for its new bio-based polyol production facility in North America. This approval marks a significant milestone in Lonza's commitment to increasing its production capacity and offering more sustainable solutions to its customers (Lonza press release, 2024).

Research Analyst Overview

  • The bio-based polyols market encompasses a diverse range of products, including derivatives, additives, and composites, that play a crucial role in various industries. Polyol curing and crosslinking are essential processes in the production of polyurethane and polyester resins, utilizing catalysts and chain extenders for optimal reaction. Performance evaluation and testing are integral to ensuring product quality, with analysis techniques employed for formulation optimization and flame retardant integration.
  • The Bio Polyols Market is expanding with advancements in polyol derivatives, polyol modifications, and polyol functionalization aimed at enhancing sustainability and performance. Key innovations include polyol prepolymers, polyol oligomers, and polyol composites tailored for diverse sectors. Formulations are supported by polyol additives, polyol catalysts, polyol stabilizers, polyol crosslinkers, and polyol chain extenders to improve processing and durability. Safety is addressed with polyol flame retardants, while strength is enhanced through polyol reinforcements and polyol fillers. Emphasis on polyol formulation, polyol reaction, polyol testing, polyol analysis, polyol quality control, and polyol performance evaluation ensures high standards. Applications span construction, automotive, furniture, electronics, packaging, insulation, textiles, agriculture, and healthcare, highlighting bio polyols' role in eco-friendly innovation.
  • Stabilizers and fillers are commonly used in polyol processing to enhance stability and reduce viscosity. Oligomers and prepolymers serve as building blocks for creating complex structures, while modifications and functionalization offer enhanced properties. Polyol mixing technologies enable efficient production, and reaction conditions are meticulously controlled to maintain consistency and meet market demands.

Dive into Technavio's robust research methodology, blending expert interviews, extensive data synthesis, and validated models for unparalleled Bio Polyols Market insights. See full methodology.

Market Scope

Report Coverage

Details

Page number

228

Base year

2024

Historic period

2019-2023

Forecast period

2025-2029

Growth momentum & CAGR

Accelerate at a CAGR of 10.9%

Market growth 2025-2029

USD 5605.8 million

Market structure

Fragmented

YoY growth 2024-2025(%)

9.4

Key countries

US, Canada, UK, Germany, China, France, Italy, The Netherlands, India, and Japan

Competitive landscape

Leading Companies, Market Positioning of Companies, Competitive Strategies, and Industry Risks

Request Free Sample

What are the Key Data Covered in this Bio Polyols Market Research and Growth Report?

  • CAGR of the Bio Polyols industry during the forecast period
  • Detailed information on factors that will drive the growth and forecasting between 2025 and 2029
  • Precise estimation of the size of the market and its contribution of the industry in focus to the parent market
  • Accurate predictions about upcoming growth and trends and changes in consumer behaviour
  • Growth of the market across North America, Europe, APAC, South America, and Middle East and Africa
  • Thorough analysis of the market's competitive landscape and detailed information about companies
  • Comprehensive analysis of factors that will challenge the bio polyols market growth of industry companies

We can help! Our analysts can customize this bio polyols market research report to meet your requirements.

Get in touch

1 Executive Summary

  • 1.1 Market overview
    • Executive Summary - Chart on Market Overview
    • Executive Summary - Data Table on Market Overview
    • Executive Summary - Chart on Global Market Characteristics
    • Executive Summary - Chart on Market by Geography
    • Executive Summary - Chart on Market Segmentation by Application
    • Executive Summary - Chart on Market Segmentation by Type
    • Executive Summary - Chart on Market Segmentation by End-user
    • Executive Summary - Chart on Incremental Growth
    • Executive Summary - Data Table on Incremental Growth
    • Executive Summary - Chart on Company Market Positioning

2 Technavio Analysis

  • 2.1 Analysis of price sensitivity, lifecycle, customer purchase basket, adoption rates, and purchase criteria
    • Analysis of price sensitivity, lifecycle, customer purchase basket, adoption rates, and purchase criteria
  • 2.2 Criticality of inputs and Factors of differentiation
    • Overview on criticality of inputs and factors of differentiation
  • 2.3 Factors of disruption
    • Overview on factors of disruption
  • 2.4 Impact of drivers and challenges
    • Impact of drivers and challenges in 2024 and 2029

3 Market Landscape

  • 3.1 Market ecosystem
    • Parent Market
    • Data Table on - Parent Market
  • 3.2 Market characteristics
    • Market characteristics analysis
  • 3.3 Value chain analysis
    • Value chain analysis

4 Market Sizing

  • 4.1 Market definition
    • Offerings of companies included in the market definition
  • 4.2 Market segment analysis
    • Market segments
  • 4.3 Market size 2024
    • 4.4 Market outlook: Forecast for 2024-2029
      • Chart on Global - Market size and forecast 2024-2029 ($ million)
      • Data Table on Global - Market size and forecast 2024-2029 ($ million)
      • Chart on Global Market: Year-over-year growth 2024-2029 (%)
      • Data Table on Global Market: Year-over-year growth 2024-2029 (%)

    5 Historic Market Size

    • 5.1 Global Bio Polyols Market 2019 - 2023
      • Historic Market Size - Data Table on Global Bio Polyols Market 2019 - 2023 ($ million)
    • 5.2 Application segment analysis 2019 - 2023
      • Historic Market Size - Application Segment 2019 - 2023 ($ million)
    • 5.3 Type segment analysis 2019 - 2023
      • Historic Market Size - Type Segment 2019 - 2023 ($ million)
    • 5.4 End-user segment analysis 2019 - 2023
      • Historic Market Size - End-user Segment 2019 - 2023 ($ million)
    • 5.5 Geography segment analysis 2019 - 2023
      • Historic Market Size - Geography Segment 2019 - 2023 ($ million)
    • 5.6 Country segment analysis 2019 - 2023
      • Historic Market Size - Country Segment 2019 - 2023 ($ million)

    6 Qualitative Analysis

    • 6.1 The AI impact on Global Bio Polyols Market

      7 Five Forces Analysis

      • 7.1 Five forces summary
        • Five forces analysis - Comparison between 2024 and 2029
      • 7.2 Bargaining power of buyers
        • Bargaining power of buyers - Impact of key factors 2024 and 2029
      • 7.3 Bargaining power of suppliers
        • Bargaining power of suppliers - Impact of key factors in 2024 and 2029
      • 7.4 Threat of new entrants
        • Threat of new entrants - Impact of key factors in 2024 and 2029
      • 7.5 Threat of substitutes
        • Threat of substitutes - Impact of key factors in 2024 and 2029
      • 7.6 Threat of rivalry
        • Threat of rivalry - Impact of key factors in 2024 and 2029
      • 7.7 Market condition
        • Chart on Market condition - Five forces 2024 and 2029

      8 Market Segmentation by Application

      • 8.1 Market segments
        • Chart on Application - Market share 2024-2029 (%)
        • Data Table on Application - Market share 2024-2029 (%)
      • 8.2 Comparison by Application
        • Chart on Comparison by Application
        • Data Table on Comparison by Application
      • 8.3 Foams - Market size and forecast 2024-2029
        • Chart on Foams - Market size and forecast 2024-2029 ($ million)
        • Data Table on Foams - Market size and forecast 2024-2029 ($ million)
        • Chart on Foams - Year-over-year growth 2024-2029 (%)
        • Data Table on Foams - Year-over-year growth 2024-2029 (%)
      • 8.4 CASE - Market size and forecast 2024-2029
        • Chart on CASE - Market size and forecast 2024-2029 ($ million)
        • Data Table on CASE - Market size and forecast 2024-2029 ($ million)
        • Chart on CASE - Year-over-year growth 2024-2029 (%)
        • Data Table on CASE - Year-over-year growth 2024-2029 (%)
      • 8.5 Market opportunity by Application
        • Market opportunity by Application ($ million)
        • Data Table on Market opportunity by Application ($ million)

      9 Market Segmentation by Type

      • 9.1 Market segments
        • Chart on Type - Market share 2024-2029 (%)
        • Data Table on Type - Market share 2024-2029 (%)
      • 9.2 Comparison by Type
        • Chart on Comparison by Type
        • Data Table on Comparison by Type
      • 9.3 Polyether polyols - Market size and forecast 2024-2029
        • Chart on Polyether polyols - Market size and forecast 2024-2029 ($ million)
        • Data Table on Polyether polyols - Market size and forecast 2024-2029 ($ million)
        • Chart on Polyether polyols - Year-over-year growth 2024-2029 (%)
        • Data Table on Polyether polyols - Year-over-year growth 2024-2029 (%)
      • 9.4 Polyester polyols - Market size and forecast 2024-2029
        • Chart on Polyester polyols - Market size and forecast 2024-2029 ($ million)
        • Data Table on Polyester polyols - Market size and forecast 2024-2029 ($ million)
        • Chart on Polyester polyols - Year-over-year growth 2024-2029 (%)
        • Data Table on Polyester polyols - Year-over-year growth 2024-2029 (%)
      • 9.5 Market opportunity by Type
        • Market opportunity by Type ($ million)
        • Data Table on Market opportunity by Type ($ million)

      10 Market Segmentation by End-user

      • 10.1 Market segments
        • Chart on End-user - Market share 2024-2029 (%)
        • Data Table on End-user - Market share 2024-2029 (%)
      • 10.2 Comparison by End-user
        • Chart on Comparison by End-user
        • Data Table on Comparison by End-user
      • 10.3 Furniture and bedding - Market size and forecast 2024-2029
        • Chart on Furniture and bedding - Market size and forecast 2024-2029 ($ million)
        • Data Table on Furniture and bedding - Market size and forecast 2024-2029 ($ million)
        • Chart on Furniture and bedding - Year-over-year growth 2024-2029 (%)
        • Data Table on Furniture and bedding - Year-over-year growth 2024-2029 (%)
      • 10.4 Construction and insulation - Market size and forecast 2024-2029
        • Chart on Construction and insulation - Market size and forecast 2024-2029 ($ million)
        • Data Table on Construction and insulation - Market size and forecast 2024-2029 ($ million)
        • Chart on Construction and insulation - Year-over-year growth 2024-2029 (%)
        • Data Table on Construction and insulation - Year-over-year growth 2024-2029 (%)
      • 10.5 Automotive - Market size and forecast 2024-2029
        • Chart on Automotive - Market size and forecast 2024-2029 ($ million)
        • Data Table on Automotive - Market size and forecast 2024-2029 ($ million)
        • Chart on Automotive - Year-over-year growth 2024-2029 (%)
        • Data Table on Automotive - Year-over-year growth 2024-2029 (%)
      • 10.6 Packaging - Market size and forecast 2024-2029
        • Chart on Packaging - Market size and forecast 2024-2029 ($ million)
        • Data Table on Packaging - Market size and forecast 2024-2029 ($ million)
        • Chart on Packaging - Year-over-year growth 2024-2029 (%)
        • Data Table on Packaging - Year-over-year growth 2024-2029 (%)
      • 10.7 Others - Market size and forecast 2024-2029
        • Chart on Others - Market size and forecast 2024-2029 ($ million)
        • Data Table on Others - Market size and forecast 2024-2029 ($ million)
        • Chart on Others - Year-over-year growth 2024-2029 (%)
        • Data Table on Others - Year-over-year growth 2024-2029 (%)
      • 10.8 Market opportunity by End-user
        • Market opportunity by End-user ($ million)
        • Data Table on Market opportunity by End-user ($ million)

      11 Customer Landscape

      • 11.1 Customer landscape overview
        • Analysis of price sensitivity, lifecycle, customer purchase basket, adoption rates, and purchase criteria

      12 Geographic Landscape

      • 12.1 Geographic segmentation
        • Chart on Market share by geography 2024-2029 (%)
        • Data Table on Market share by geography 2024-2029 (%)
      • 12.2 Geographic comparison
        • Chart on Geographic comparison
        • Data Table on Geographic comparison
      • 12.3 North America - Market size and forecast 2024-2029
        • Chart on North America - Market size and forecast 2024-2029 ($ million)
        • Data Table on North America - Market size and forecast 2024-2029 ($ million)
        • Chart on North America - Year-over-year growth 2024-2029 (%)
        • Data Table on North America - Year-over-year growth 2024-2029 (%)
      • 12.4 Europe - Market size and forecast 2024-2029
        • Chart on Europe - Market size and forecast 2024-2029 ($ million)
        • Data Table on Europe - Market size and forecast 2024-2029 ($ million)
        • Chart on Europe - Year-over-year growth 2024-2029 (%)
        • Data Table on Europe - Year-over-year growth 2024-2029 (%)
      • 12.5 APAC - Market size and forecast 2024-2029
        • Chart on APAC - Market size and forecast 2024-2029 ($ million)
        • Data Table on APAC - Market size and forecast 2024-2029 ($ million)
        • Chart on APAC - Year-over-year growth 2024-2029 (%)
        • Data Table on APAC - Year-over-year growth 2024-2029 (%)
      • 12.6 South America - Market size and forecast 2024-2029
        • Chart on South America - Market size and forecast 2024-2029 ($ million)
        • Data Table on South America - Market size and forecast 2024-2029 ($ million)
        • Chart on South America - Year-over-year growth 2024-2029 (%)
        • Data Table on South America - Year-over-year growth 2024-2029 (%)
      • 12.7 Middle East and Africa - Market size and forecast 2024-2029
        • Chart on Middle East and Africa - Market size and forecast 2024-2029 ($ million)
        • Data Table on Middle East and Africa - Market size and forecast 2024-2029 ($ million)
        • Chart on Middle East and Africa - Year-over-year growth 2024-2029 (%)
        • Data Table on Middle East and Africa - Year-over-year growth 2024-2029 (%)
      • 12.8 US - Market size and forecast 2024-2029
        • Chart on US - Market size and forecast 2024-2029 ($ million)
        • Data Table on US - Market size and forecast 2024-2029 ($ million)
        • Chart on US - Year-over-year growth 2024-2029 (%)
        • Data Table on US - Year-over-year growth 2024-2029 (%)
      • 12.9 Canada - Market size and forecast 2024-2029
        • Chart on Canada - Market size and forecast 2024-2029 ($ million)
        • Data Table on Canada - Market size and forecast 2024-2029 ($ million)
        • Chart on Canada - Year-over-year growth 2024-2029 (%)
        • Data Table on Canada - Year-over-year growth 2024-2029 (%)
      • 12.10 UK - Market size and forecast 2024-2029
        • Chart on UK - Market size and forecast 2024-2029 ($ million)
        • Data Table on UK - Market size and forecast 2024-2029 ($ million)
        • Chart on UK - Year-over-year growth 2024-2029 (%)
        • Data Table on UK - Year-over-year growth 2024-2029 (%)
      • 12.11 China - Market size and forecast 2024-2029
        • Chart on China - Market size and forecast 2024-2029 ($ million)
        • Data Table on China - Market size and forecast 2024-2029 ($ million)
        • Chart on China - Year-over-year growth 2024-2029 (%)
        • Data Table on China - Year-over-year growth 2024-2029 (%)
      • 12.12 Germany - Market size and forecast 2024-2029
        • Chart on Germany - Market size and forecast 2024-2029 ($ million)
        • Data Table on Germany - Market size and forecast 2024-2029 ($ million)
        • Chart on Germany - Year-over-year growth 2024-2029 (%)
        • Data Table on Germany - Year-over-year growth 2024-2029 (%)
      • 12.13 Japan - Market size and forecast 2024-2029
        • Chart on Japan - Market size and forecast 2024-2029 ($ million)
        • Data Table on Japan - Market size and forecast 2024-2029 ($ million)
        • Chart on Japan - Year-over-year growth 2024-2029 (%)
        • Data Table on Japan - Year-over-year growth 2024-2029 (%)
      • 12.14 France - Market size and forecast 2024-2029
        • Chart on France - Market size and forecast 2024-2029 ($ million)
        • Data Table on France - Market size and forecast 2024-2029 ($ million)
        • Chart on France - Year-over-year growth 2024-2029 (%)
        • Data Table on France - Year-over-year growth 2024-2029 (%)
      • 12.15 India - Market size and forecast 2024-2029
        • Chart on India - Market size and forecast 2024-2029 ($ million)
        • Data Table on India - Market size and forecast 2024-2029 ($ million)
        • Chart on India - Year-over-year growth 2024-2029 (%)
        • Data Table on India - Year-over-year growth 2024-2029 (%)
      • 12.16 Italy - Market size and forecast 2024-2029
        • Chart on Italy - Market size and forecast 2024-2029 ($ million)
        • Data Table on Italy - Market size and forecast 2024-2029 ($ million)
        • Chart on Italy - Year-over-year growth 2024-2029 (%)
        • Data Table on Italy - Year-over-year growth 2024-2029 (%)
      • 12.17 The Netherlands - Market size and forecast 2024-2029
        • Chart on The Netherlands - Market size and forecast 2024-2029 ($ million)
        • Data Table on The Netherlands - Market size and forecast 2024-2029 ($ million)
        • Chart on The Netherlands - Year-over-year growth 2024-2029 (%)
        • Data Table on The Netherlands - Year-over-year growth 2024-2029 (%)
      • 12.18 Market opportunity by geography
        • Market opportunity by geography ($ million)
        • Data Tables on Market opportunity by geography ($ million)

      13 Drivers, Challenges, and Opportunity/Restraints

      • 13.1 Market drivers
        • 13.2 Market challenges
          • 13.3 Impact of drivers and challenges
            • Impact of drivers and challenges in 2024 and 2029
          • 13.4 Market opportunities/restraints

            14 Competitive Landscape

            • 14.1 Overview
              • 14.2 Competitive Landscape
                • Overview on criticality of inputs and factors of differentiation
              • 14.3 Landscape disruption
                • Overview on factors of disruption
              • 14.4 Industry risks
                • Impact of key risks on business

              15 Competitive Analysis

              • 15.1 Companies profiled
                • Companies covered
              • 15.2 Company ranking index
                • Company ranking index
              • 15.3 Market positioning of companies
                • Matrix on companies position and classification
              • 15.4 Alberdingk Boley GmbH
                • Alberdingk Boley GmbH - Overview
                • Alberdingk Boley GmbH - Product / Service
                • Alberdingk Boley GmbH - Key offerings
                • SWOT
              • 15.5 Arkema
                • Arkema - Overview
                • Arkema - Business segments
                • Arkema - Key news
                • Arkema - Key offerings
                • Arkema - Segment focus
                • SWOT
              • 15.6 BASF SE
                • BASF SE - Overview
                • BASF SE - Business segments
                • BASF SE - Key news
                • BASF SE - Key offerings
                • BASF SE - Segment focus
                • SWOT
              • 15.7 Cargill Inc.
                • Cargill Inc. - Overview
                • Cargill Inc. - Product / Service
                • Cargill Inc. - Key offerings
                • SWOT
              • 15.8 Castor International BV
                • Castor International BV - Overview
                • Castor International BV - Product / Service
                • Castor International BV - Key offerings
                • SWOT
              • 15.9 Covestro AG
                • Covestro AG - Overview
                • Covestro AG - Business segments
                • Covestro AG - Key news
                • Covestro AG - Key offerings
                • Covestro AG - Segment focus
                • SWOT
              • 15.10 Croda International Plc
                • Croda International Plc - Overview
                • Croda International Plc - Product / Service
                • Croda International Plc - Key offerings
                • SWOT
              • 15.11 Emery Oleochemicals Group
                • Emery Oleochemicals Group - Overview
                • Emery Oleochemicals Group - Product / Service
                • Emery Oleochemicals Group - Key offerings
                • SWOT
              • 15.12 Global Bio chem Technology Group Co. Ltd.
                • Global Bio chem Technology Group Co. Ltd. - Overview
                • Global Bio chem Technology Group Co. Ltd. - Business segments
                • Global Bio chem Technology Group Co. Ltd. - Key offerings
                • Global Bio chem Technology Group Co. Ltd. - Segment focus
                • SWOT
              • 15.13 Huntsman Corp.
                • Huntsman Corp. - Overview
                • Huntsman Corp. - Business segments
                • Huntsman Corp. - Key news
                • Huntsman Corp. - Key offerings
                • Huntsman Corp. - Segment focus
                • SWOT
              • 15.14 INVISTA Equities, LLC
                • INVISTA Equities, LLC - Overview
                • INVISTA Equities, LLC - Product / Service
                • INVISTA Equities, LLC - Key offerings
                • SWOT
              • 15.15 Mitsui Chemicals Inc.
                • Mitsui Chemicals Inc. - Overview
                • Mitsui Chemicals Inc. - Business segments
                • Mitsui Chemicals Inc. - Key offerings
                • Mitsui Chemicals Inc. - Segment focus
                • SWOT
              • 15.16 Stepan Co.
                • Stepan Co. - Overview
                • Stepan Co. - Business segments
                • Stepan Co. - Key news
                • Stepan Co. - Key offerings
                • Stepan Co. - Segment focus
                • SWOT
              • 15.17 The Dow Chemical Co.
                • The Dow Chemical Co. - Overview
                • The Dow Chemical Co. - Business segments
                • The Dow Chemical Co. - Key news
                • The Dow Chemical Co. - Key offerings
                • The Dow Chemical Co. - Segment focus
                • SWOT
              • 15.18 Vertellus Holdings LLC
                • Vertellus Holdings LLC - Overview
                • Vertellus Holdings LLC - Product / Service
                • Vertellus Holdings LLC - Key offerings
                • SWOT

              16 Appendix

              • 16.1 Scope of the report
                • 16.2 Inclusions and exclusions checklist
                  • Inclusions checklist
                  • Exclusions checklist
                • 16.3 Currency conversion rates for US$
                  • Currency conversion rates for US$
                • 16.4 Research methodology
                  • Research methodology
                • 16.5 Data procurement
                  • Information sources
                • 16.6 Data validation
                  • Data validation
                • 16.7 Validation techniques employed for market sizing
                  • Validation techniques employed for market sizing
                • 16.8 Data synthesis
                  • Data synthesis
                • 16.9 360 degree market analysis
                  • 360 degree market analysis
                • 16.10 List of abbreviations
                  • List of abbreviations

                Research Methodology

                Technavio presents a detailed picture of the market by way of study, synthesis, and summation of data from multiple sources. The analysts have presented the various facets of the market with a particular focus on identifying the key industry influencers. The data thus presented is comprehensive, reliable, and the result of extensive research, both primary and secondary.

                INFORMATION SOURCES

                Primary sources

                • Manufacturers and suppliers
                • Channel partners
                • Industry experts
                • Strategic decision makers

                Secondary sources

                • Industry journals and periodicals
                • Government data
                • Financial reports of key industry players
                • Historical data
                • Press releases

                DATA ANALYSIS

                Data Synthesis

                • Collation of data
                • Estimation of key figures
                • Analysis of derived insights

                Data Validation

                • Triangulation with data models
                • Reference against proprietary databases
                • Corroboration with industry experts

                REPORT WRITING

                Qualitative

                • Market drivers
                • Market challenges
                • Market trends
                • Five forces analysis

                Quantitative

                • Market size and forecast
                • Market segmentation
                • Geographical insights
                • Competitive landscape

                Interested in this report?

                Get your sample now to see our research methodology and insights!

                Download Now

                Frequently Asked Questions

                Bio Polyols market growth will increase by $ 5605.8 mn during 2025-2029 .

                The Bio Polyols market is expected to grow at a CAGR of 10.9% during 2025-2029 .

                Bio Polyols market is segmented by Application( Foams, CASE) Type( Polyether polyols, Polyester polyols, APAC, South America, Middle East and Africa) End-user( Furniture and bedding, Construction and insulation, Automotive, Packaging, Others)

                Alberdingk Boley GmbH, Arkema, BASF SE, Bio Based Technologies LLC, Cargill Inc., Castor International BV, Covestro AG, Croda International Plc, Emery Oleochemicals Group, Global Bio chem Technology Group Co. Ltd., Huntsman Corp., INVISTA Equities, LLC, Jayant Agro Organics Ltd., Mitsui Chemicals Inc., Nivapol, Stahl Holdings B.V., Stepan Co., The Dow Chemical Co., Vertellus Holdings LLC, Xuchuan Chemical Suzhou Co. Ltd. are a few of the key vendors in the Bio Polyols market.

                North America will register the highest growth rate of 43% among the other regions. Therefore, the Bio Polyols market in North America is expected to garner significant business opportunities for the vendors during the forecast period.

                US, Canada, UK, Germany, China, France, Italy, The Netherlands, India, Japan

                • Increasing demand for bio polyols in automotive and construction industriesBio polyols are crucial for manufacturing polyurethane foams. Polyurethane foams are used in many end-use industries such as automotive is the driving factor this market.
                • construction is the driving factor this market.
                • and paints and coatings. Major end-use industries for polyols in the form of polyurethane foams are automotive and construction. Therefore is the driving factor this market.
                • the use of polyols in polyurethane foams by the automotive industry will increase during the forecast period. Polyurethane foams are extensively used for producing different automotive parts such as side skirts is the driving factor this market.
                • wiper cowls is the driving factor this market.
                • roll pans is the driving factor this market.
                • and bumpers. Therefore is the driving factor this market.
                • the market is expected to register moderate growth during the forecast period because of the increasing demand for automotive vehicles. The increased use of polyurethane foams in the construction industry is a key driver of the global bio polyols market. Polyurethane foams provide excellent weatherproof sealants and form a flawless layer of insulation. These cover irregular is the driving factor this market.
                • hard-to-insulate shapes and fill gaps and seams. Growth in the construction industry has led to high demand for polyurethane foams. The rising demand for housing is the driving factor this market.
                • hospitality is the driving factor this market.
                • flooring material is the driving factor this market.
                • and furnishing is expected to increase the consumption of polyurethane foams during the forecast period. This will have a positive influence on the global bio polyols market during the forecast period. is the driving factor this market.

                The Bio Polyols market vendors should focus on grabbing business opportunities from the Foams segment as it accounted for the largest market share in the base year.