Biologic Therapeutics Market Analysis North America, Europe, Asia, Rest of World (ROW) - US, China, Germany, France, Japan - Size and Forecast 2024-2028

Biologic Therapeutics Market Analysis North America, Europe, Asia, Rest of World (ROW) - US, China, Germany, France, Japan - Size and Forecast 2024-2028

Published: Aug 2024 184 Pages SKU: IRTNTR44341

Market Overview at a Glance

$398.3 B
Market Opportunity
13.64%
CAGR
11.73
YoY growth 2023-2024(%)

Biologic Therapeutics Market Size 2024-2028 

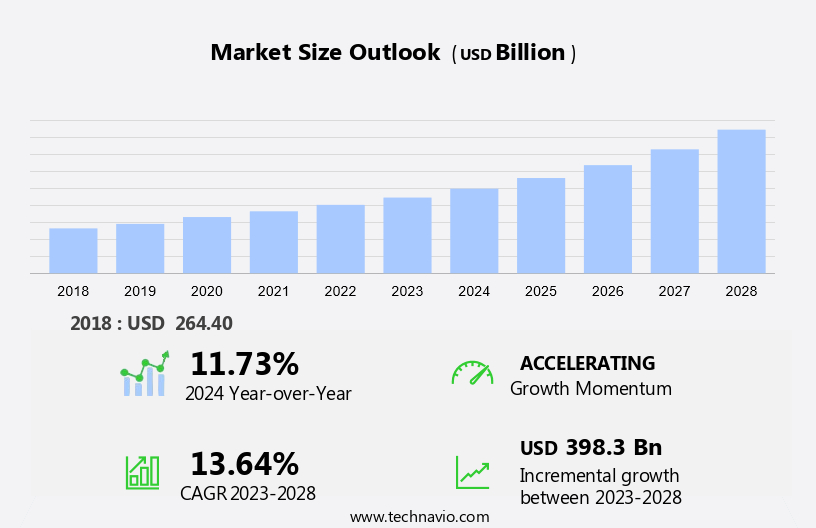
The biologic therapeutics market size is forecast to increase by USD 398.3 billion at a CAGR of 13.64% between 2023 and 2028.

  • The biologics market is experiencing significant growth, driven by the rising prevalence of chronic diseases such as cancer, genetic disorders, and autoimmune conditions. The approval of numerous disease-modifying biologics, coupled with advancements in personalized medicine and the development of companion diagnostics, is further accelerating market expansion. These advancements enable more targeted and effective treatments, ultimately increasing the demand for these sophisticated therapies.
  • This report analyzes the competitive landscape, including key 20 players including AbbVie Inc., Amgen Inc., Apogenix AG, AstraZeneca Plc, Aurobindo Pharma Ltd., Baxter International Inc., Biocon Ltd., BioMarin Pharmaceutical Inc., Celltrion Healthcare Co. Ltd., Eli Lilly and Co., GangaGen Biotechnologies Pvt Ltd., GlaxoSmithKline Plc, Johnson and Johnson Services Inc., Merck and Co. Inc., Novartis AG, Pfizer Inc., Precision Biologics Inc., Samsung Electronics Co. Ltd., Sanofi SA, and Tubulis GmbH

What will be the Size of the Biologic Therapeutics Market During the Forecast Period?

Biologic Therapeutics Market Size

 Request Free Sample

  • The market encompasses a range of innovative treatments for various diseases, including genetic disorders and autoimmune conditions. Personalized medicine, facilitated by companion diagnostics, plays a pivotal role in this sector. Globally, the prevalence of non-communicable diseases (NCDs), such as Alzheimer's disease, Parkinson's disease, breast cancer, and lung cancer, fuels market growth. Strict regulatory processes, overseen by regulatory bodies like the FDA, ensure the safety and efficacy of biologic therapies. These include monoclonal antibodies (MAbs), vaccines, recombinant proteins, antisense, RNAi, molecular therapy, and diagnostics. Notable developments include Leqembi (lecanemab-irmb) for Alzheimer's disease and Tezepelumab for chronic diseases. The market is further propelled by advancements in biologic production methods, such as microbial-based production and mRNA-based vaccines.

How is this Biologic Therapeutics Industry segmented and which is the largest segment?

The biologic therapeutics industry research report provides comprehensive data (region-wise segment analysis), with forecasts and estimates in "USD billion" for the period 2024-2028, as well as historical data from 2018-2022 for the following segments.

  • Application
    • Cancer
    • Infectious diseases
    • Autoimmune diseases
    • Others
  • Product
    • Antibody therapeutics
    • Vaccines
    • Cell therapy
    • Gene therapy
    • Others
  • Geography
    • North America
      • US
      • Canada
    • Europe
      • Germany
      • France
      • Spain
    • Asia
      • China
      • Japan
      • India
    • Rest of World (ROW)

By Application Insights

  • The cancer segment is estimated to witness significant growth during the forecast period.

Biologic therapeutics have emerged as a significant advancement In the field of oncology, offering targeted treatments for various types of cancer, including colorectal and prostate cancer. These therapies, which include mRNA-1273, monoclonal antibodies (MAbs), vaccines, recombinant proteins, antisense, RNAi, and molecular therapy, differ from chemotherapeutic agents In their mode of action. While chemotherapeutics act indiscriminately on both cancer and normal cells, leading to side effects such as alopecia, nausea, and fatigue, biologics are designed to interact specifically with cancer cells. Biologics exhibit two primary mechanisms of action: direct and indirect. Direct action involves the killing of cancer cells, while indirect action stimulates the immune system to eliminate cancer cells.

The first biologic for oncology, approved by the US FDA, was the microbial-based biologic production, bacillus Calmette-Guerin (BCG) vaccine. Monoclonal antibodies, such as Remicade, Humira, Herceptin, Avastin, Rituxan/MabThera, and Enbrel, are a type of biologic that have revolutionized cancer treatment. They are produced using biotechnology and biomedical science techniques, such as protein purification, cell lines, and adjuvants. These therapies can be murine, chimeric, humanized, or nanobodies, and they function by targeting specific proteins on cancer cells, thereby inhibiting their growth and proliferation. Synthetic vaccines, fusion proteins, soluble receptors, immunoconjugates, and immunotherapeutics are other types of biologics that have shown promise in cancer treatment.

These therapies leverage the power of the immune system to fight cancer, making them highly effective and minimally toxic compared to chemotherapeutics. Biologics have also found applications In the treatment of infectious diseases, such as HIV and hepatitis, by targeting specific viral proteins. They have the potential to revolutionize the way we approach disease treatment and management, offering targeted, effective, and minimally toxic solutions. In conclusion, biologic therapeutics represent a significant advancement In the field of oncology and beyond, offering targeted, effective, and minimally toxic solutions for various diseases, including cancer and infectious diseases. These therapies, which include mRNA-1273, monoclonal antibodies, vaccines, recombinant proteins, antisense, RNAi, molecular therapy, diagnostics, therapy, protein purification, murine, chimeric, humanized, nanobodies, rDNA, synthetic vaccines,cancer diagnostics fusion proteins, soluble receptors, immunoconjugates, immunotherapeutics, and biosimilars, are the future of disease treatment and management.

Biologic Therapeutics Market Size

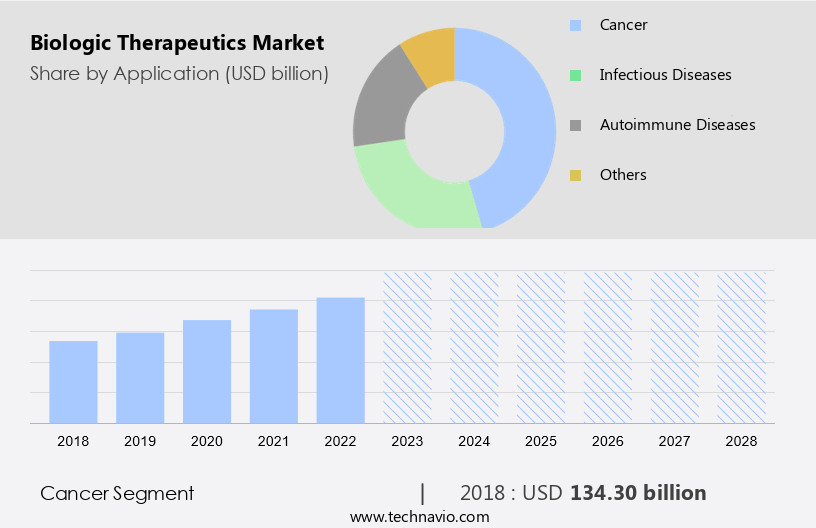
Get a glance at the  Biologic Therapeutics Industry report of share of various segments Request Free Sample

The Cancer segment was valued at USD 134.30 billion in 2018 and showed a gradual increase during the forecast period.
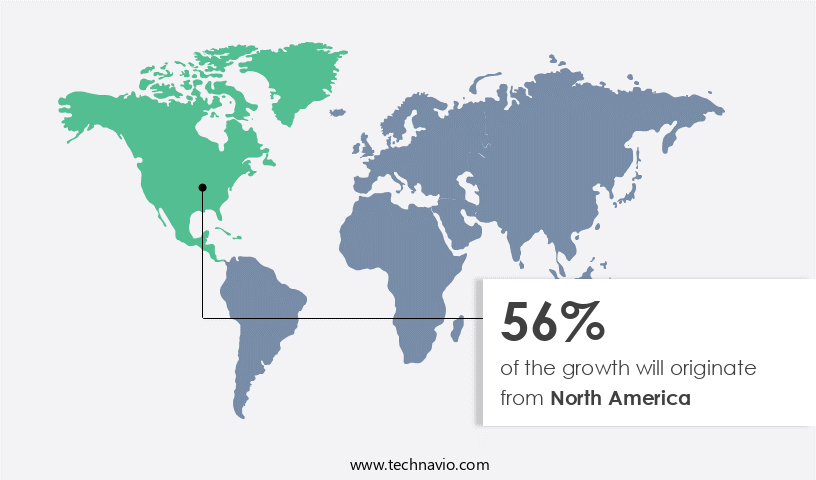
Regional Analysis

  • North America is estimated to contribute 56% to the growth of the global market during the forecast period.

Technavio's analysts have elaborately explained the regional trends and drivers that shape the market during the forecast period.

Biologic Therapeutics Market Share by Geography

For more insights on the market share of various regions, Request Free Sample

The market in North America is characterized by advancements in various fields, including colorectal and prostate cancer treatments. Key players, such as AbbVie, Eli Lilly, Merck, Pfizer, and Amgen, are based In the region and offer a diverse range of products. These include monoclonal antibodies (MAbs) like mRNA-1273, microbial-based biologic production, recombinant proteins, antisense RNA, RNAi, molecular therapy, and vaccines. The increasing prevalence of chronic diseases, such as cancer, drives market growth. Biotechnology and biomedical science techniques have led to the development of innovative therapies. These include immunotherapeutics, such as Adjuvants, Nanosystems, and immunoconjugates. Protein purification techniques have enabled the production of murine, chimeric, humanized, and nanobody-based therapeutics.

Fusion proteins and soluble receptors are also significant contributions to the market. The market encompasses various applications, including the treatment of infectious diseases and modulation of the immune system. Key products include Remicade, Humira, Herceptin, Avastin, Rituxan/MabThera, and Enbrel. Antithymocyte Globulin (ATG) is another important therapeutic used in immunosuppression. The market for biologic therapeutics is continually evolving, with advancements in synthetic vaccines, biosimilars, and mRNA therapeutics. These developments offer new opportunities for market growth and improved patient outcomes.

Market Dynamics

Our biologic therapeutics market researchers analyzed the data with 2023 as the base year, along with the key drivers, trends, and challenges. A holistic analysis of drivers will help companies refine their marketing strategies to gain a competitive advantage.

What are the key market drivers leading to the rise In the adoption of Biologic Therapeutics Industry?

Introduction of biosimilars is the key driver of the market.

  • Biologic therapeutics, comprised of anti-cytokine therapies and biologic response modifiers, have revolutionized the treatment landscape for various diseases, including cancers. These advanced medicines are derived from mammalian cell lines and microbial populations, yielding complex structures such as proteins, monoclonal antibodies, and recombinant interferon. The mechanism of action for these therapeutics often involves modulating biological processes, like inhibiting platelet-derived growth factor, to induce therapeutic effects. The introduction of biosimilars, highly similar biological products, has significantly impacted the market. Developed using distinct cell lines, manufacturing processes, or formulations, these biosimilars offer no clinically meaningful differences in terms of safety, purity, and potency compared to their original counterparts.
  • By increasing competition and reducing treatment costs, biosimilars expand access to life-saving medications for patients, particularly those facing financial barriers. Moreover, the cost reduction brought about by biosimilars is crucial as healthcare spending continues to escalate.

What are the market trends shaping the Biologic Therapeutics Industry?

Strong research and development pipeline is the upcoming market trend.

  • The biologics market encompasses a range of therapeutic agents, including anti-cytokine therapies and biologic response modifiers, which have demonstrated significant efficacy in addressing severe infections, malignancies, and immunological and hormonal disorders. Monoclonal antibodies, derived from mammalian cell lines, represent a rapidly expanding segment within biological therapies. As of now, 153 monoclonal antibodies have been approved or are under review for various indications In the EU and the US. Some notable examples include TZIELD, BRIUMVI, and ELAHERE. Furthermore, biologics utilized as vaccines and therapeutic proteins are also experiencing substantial advancements. Key industry players, such as AbbVie and Amgen, are actively engaged in research and development of novel biologics.
  • Microbial populations and platelet-derived growth factor are among the targets for new biologic interventions. Recombinant interferon, another type of biologic, holds promise In the treatment of various cancers and viral infections.

What challenges does the Biologic Therapeutics Industry face during its growth?

High cost of biologics is a key challenge affecting the industry growth.

  • Biologic therapeutics, including anti-cytokine therapies and biologic response modifiers, hold significant promise In the treatment of various malignancies, hormonal imbalances, and autoimmune conditions. However, the high manufacturing costs associated with these therapies, driven by the expenses related to clinical trials and the use of mammalian cell lines and microbial populations, limit their accessibility to economically underprivileged individuals. The production of therapeutic agents such as monoclonal antibodies and vaccines involves the handling of animals, leading to increased costs due to immunization procedures and other related production processes. For instance, the production of recombinant interferon, a type of biologic response modifier, involves the use of platelet-derived growth factor to stimulate the growth of cells in culture.
  • These complex production processes contribute to the overall high cost of biologic therapeutics.

Exclusive Customer Landscape

The biologic therapeutics market forecasting report includes the adoption lifecycle of the market, covering from the innovator's stage to the laggard's stage. It focuses on adoption rates in different regions based on penetration. Furthermore, the biologic therapeutics market report also includes key purchase criteria and drivers of price sensitivity to help companies evaluate and develop their market growth analysis strategies.
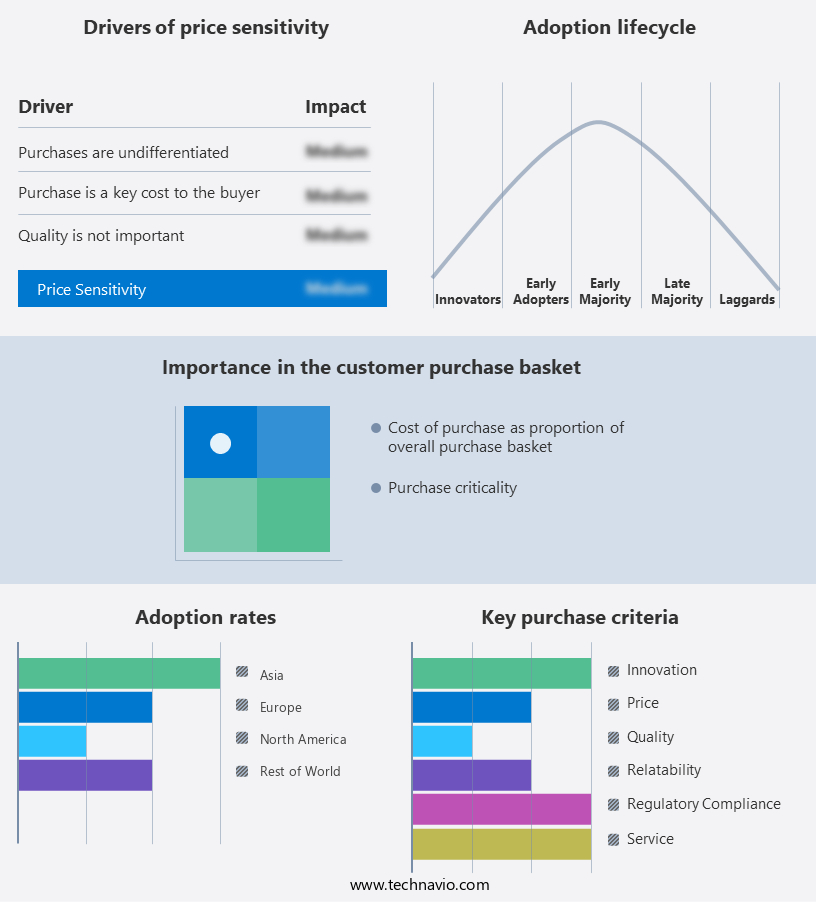
Biologic Therapeutics Market Share by Geography

 Customer Landscape

Key Companies & Market Insights

Companies are implementing various strategies, such as strategic alliances, biologic therapeutics market forecast, partnerships, mergers and acquisitions, geographical expansion, and product/service launches, to enhance their presence In the industry.

The industry research and growth report includes detailed analyses of the competitive landscape of the market and information about key companies, including:

  • AbbVie Inc.
  • Amgen Inc.
  • Apogenix AG
  • AstraZeneca Plc
  • Aurobindo Pharma Ltd.
  • Baxter International Inc.
  • Biocon Ltd.
  • BioMarin Pharmaceutical Inc.
  • Celltrion Healthcare Co. Ltd.
  • Eli Lilly and Co.
  • GangaGen Biotechnologies Pvt Ltd.
  • GlaxoSmithKline Plc
  • Johnson and Johnson Services Inc.
  • Merck and Co. Inc.
  • Novartis AG
  • Pfizer Inc.
  • Precision Biologics Inc.
  • Samsung Electronics Co. Ltd.
  • Sanofi SA
  • Tubulis GmbH

Qualitative and quantitative analysis of companies has been conducted to help clients understand the wider business environment as well as the strengths and weaknesses of key industry players. Data is qualitatively analyzed to categorize companies as pure play, category-focused, industry-focused, and diversified; it is quantitatively analyzed to categorize companies as dominant, leading, strong, tentative, and weak.

Recent Developments

  • In January 2024: Amgen and Novartis announced a strategic collaboration to develop and commercialize innovative therapies for cancer. This partnership leverages the strengths of both companies in oncology research and development, with a focus on cell and gene therapies.
  • In March 2023: Merck & Co. acquired Acceleron Pharma, a biopharmaceutical company focused on the development of therapies for rare diseases. This acquisition expanded Merck's portfolio of rare disease treatments, particularly in the areas of hematology and oncology.
  • In July 2022: Regeneron Pharmaceuticals and Sanofi entered into a global collaboration to develop and commercialize a new class of bispecific antibodies for the treatment of cancer. This partnership aims to leverage the expertise of both companies in antibody engineering and drug development.
  • In November 2021: Roche acquired Spark Therapeutics, a leading gene therapy company. This acquisition strengthened Roche's position in the gene therapy market and expanded its portfolio of innovative therapies for rare diseases.

Research Analyst Overview

The market encompasses a significant segment of the healthcare industry. Disenses and diseases are the primary drivers for the growth of this market. The development of advanced technologies and techniques for the production of biologics has led to an increase In their usage. Proteins, monoclonal antibodies, and gene therapies are the major types of biologic therapeutics. The market for these therapeutics is driven by the rising prevalence of chronic diseases, increasing healthcare expenditure, and growing awareness about the benefits of biologic therapies. Additionally, the market is fueled by regulatory approvals for new biologic therapies and collaborations between industry players and academic institutions.

The market for biologic therapeutics is diverse and complex, with various players, including pharmaceutical companies, biotechnology firms, and academic institutions, contributing to its growth. The market is also characterized by its global nature, with players operating in various regions and targeting diverse patient populations. The market for biologic therapeutics is expected to continue its growth trajectory In the coming years, driven by the increasing demand for effective treatments for chronic diseases and the ongoing research and development efforts in this field. The market is also expected to be influenced by regulatory developments and pricing pressures. In conclusion, the market is a dynamic and evolving industry, driven by the need for effective treatments for chronic diseases and the ongoing advancements in biotechnology.

The market is characterized by its diversity, complexity, and global nature, and is expected to continue its growth trajectory In the coming years.

Biologic Therapeutics Market Scope

Report Coverage

Details

Page number

184

Base year

2023

Historic period

2018-2022

Forecast period

2024-2028

Growth momentum & CAGR

Accelerate at a CAGR of 13.64%

Market growth 2024-2028

USD 398.3 billion

Market structure

Fragmented

YoY growth 2023-2024(%)

11.73

Key countries

US, China, Germany, France, and Japan

Competitive landscape

Leading Companies, Market Positioning of Companies, Competitive Strategies, and Industry Risks

Request Free Sample

What are the Key Data Covered in this Biologic Therapeutics Market Research and Growth Report?

  • CAGR of the Biologic Therapeutics industry during the forecast period
  • Detailed information on factors that will drive the Biologic Therapeutics growth and forecasting between 2024 and 2028
  • Precise estimation of the size of the market and its contribution of the industry in focus to the parent market
  • Accurate predictions about upcoming growth and trends and changes in consumer behaviour
  • Growth of the market across North America, Europe, Asia, and Rest of World (ROW)
  • Thorough analysis of the market's competitive landscape and detailed information about companies
  • Comprehensive analysis of factors that will challenge the biologic therapeutics market growth of industry companies

We can help! Our analysts can customize this biologic therapeutics market research report to meet your requirements.

Get in touch

1 Executive Summary

  • 1.1 Market overview
    • Executive Summary - Chart on Market Overview
    • Executive Summary - Data Table on Market Overview
    • Executive Summary - Chart on Global Market Characteristics
    • Executive Summary - Chart on Market by Geography
    • Executive Summary - Chart on Market Segmentation by Application
    • Executive Summary - Chart on Market Segmentation by Product
    • Executive Summary - Chart on Incremental Growth
    • Executive Summary - Data Table on Incremental Growth
    • Executive Summary - Chart on Company Market Positioning

2 Market Landscape

  • 2.1 Market ecosystem
    • Parent Market
    • Data Table on - Parent Market
  • 2.2 Market characteristics
    • Market characteristics analysis
  • 2.3 Value chain analysis
    • Value Chain Analysis

3 Market Sizing

  • 3.1 Market definition
    • Offerings of companies included in the market definition
  • 3.2 Market segment analysis
    • Market segments
  • 3.3 Market size 2023
    • 3.4 Market outlook: Forecast for 2023-2028
      • Chart on Global - Market size and forecast 2023-2028 ($ billion)
      • Data Table on Global - Market size and forecast 2023-2028 ($ billion)
      • Chart on Global Market: Year-over-year growth 2023-2028 (%)
      • Data Table on Global Market: Year-over-year growth 2023-2028 (%)

    4 Historic Market Size

    • 4.1 Global Biologic Therapeutics Market 2018 - 2022
      • Historic Market Size - Data Table on Global Biologic Therapeutics Market 2018 - 2022 ($ billion)
    • 4.2 Application segment analysis 2018 - 2022
      • Historic Market Size - Application Segment 2018 - 2022 ($ billion)
    • 4.3 Product segment analysis 2018 - 2022
      • Historic Market Size - Product Segment 2018 - 2022 ($ billion)
    • 4.4 Geography segment analysis 2018 - 2022
      • Historic Market Size - Geography Segment 2018 - 2022 ($ billion)
    • 4.5 Country segment analysis 2018 - 2022
      • Historic Market Size - Country Segment 2018 - 2022 ($ billion)

    5 Five Forces Analysis

    • 5.1 Five forces summary
      • Five forces analysis - Comparison between 2023 and 2028
    • 5.2 Bargaining power of buyers
      • Bargaining power of buyers - Impact of key factors 2023 and 2028
    • 5.3 Bargaining power of suppliers
      • Bargaining power of suppliers - Impact of key factors in 2023 and 2028
    • 5.4 Threat of new entrants
      • Threat of new entrants - Impact of key factors in 2023 and 2028
    • 5.5 Threat of substitutes
      • Threat of substitutes - Impact of key factors in 2023 and 2028
    • 5.6 Threat of rivalry
      • Threat of rivalry - Impact of key factors in 2023 and 2028
    • 5.7 Market condition
      • Chart on Market condition - Five forces 2023 and 2028

    6 Market Segmentation by Application

    • 6.1 Market segments
      • Chart on Application - Market share 2023-2028 (%)
      • Data Table on Application - Market share 2023-2028 (%)
    • 6.2 Comparison by Application
      • Chart on Comparison by Application
      • Data Table on Comparison by Application
    • 6.3 Cancer - Market size and forecast 2023-2028
      • Chart on Cancer - Market size and forecast 2023-2028 ($ billion)
      • Data Table on Cancer - Market size and forecast 2023-2028 ($ billion)
      • Chart on Cancer - Year-over-year growth 2023-2028 (%)
      • Data Table on Cancer - Year-over-year growth 2023-2028 (%)
    • 6.4 Infectious diseases - Market size and forecast 2023-2028
      • Chart on Infectious diseases - Market size and forecast 2023-2028 ($ billion)
      • Data Table on Infectious diseases - Market size and forecast 2023-2028 ($ billion)
      • Chart on Infectious diseases - Year-over-year growth 2023-2028 (%)
      • Data Table on Infectious diseases - Year-over-year growth 2023-2028 (%)
    • 6.5 Autoimmune diseases - Market size and forecast 2023-2028
      • Chart on Autoimmune diseases - Market size and forecast 2023-2028 ($ billion)
      • Data Table on Autoimmune diseases - Market size and forecast 2023-2028 ($ billion)
      • Chart on Autoimmune diseases - Year-over-year growth 2023-2028 (%)
      • Data Table on Autoimmune diseases - Year-over-year growth 2023-2028 (%)
    • 6.6 Others - Market size and forecast 2023-2028
      • Chart on Others - Market size and forecast 2023-2028 ($ billion)
      • Data Table on Others - Market size and forecast 2023-2028 ($ billion)
      • Chart on Others - Year-over-year growth 2023-2028 (%)
      • Data Table on Others - Year-over-year growth 2023-2028 (%)
    • 6.7 Market opportunity by Application
      • Market opportunity by Application ($ billion)
      • Data Table on Market opportunity by Application ($ billion)

    7 Market Segmentation by Product

    • 7.1 Market segments
      • Chart on Product - Market share 2023-2028 (%)
      • Data Table on Product - Market share 2023-2028 (%)
    • 7.2 Comparison by Product
      • Chart on Comparison by Product
      • Data Table on Comparison by Product
    • 7.3 Antibody therapeutics - Market size and forecast 2023-2028
      • Chart on Antibody therapeutics - Market size and forecast 2023-2028 ($ billion)
      • Data Table on Antibody therapeutics - Market size and forecast 2023-2028 ($ billion)
      • Chart on Antibody therapeutics - Year-over-year growth 2023-2028 (%)
      • Data Table on Antibody therapeutics - Year-over-year growth 2023-2028 (%)
    • 7.4 Vaccines - Market size and forecast 2023-2028
      • Chart on Vaccines - Market size and forecast 2023-2028 ($ billion)
      • Data Table on Vaccines - Market size and forecast 2023-2028 ($ billion)
      • Chart on Vaccines - Year-over-year growth 2023-2028 (%)
      • Data Table on Vaccines - Year-over-year growth 2023-2028 (%)
    • 7.5 Cell therapy - Market size and forecast 2023-2028
      • Chart on Cell therapy - Market size and forecast 2023-2028 ($ billion)
      • Data Table on Cell therapy - Market size and forecast 2023-2028 ($ billion)
      • Chart on Cell therapy - Year-over-year growth 2023-2028 (%)
      • Data Table on Cell therapy - Year-over-year growth 2023-2028 (%)
    • 7.6 Gene therapy - Market size and forecast 2023-2028
      • Chart on Gene therapy - Market size and forecast 2023-2028 ($ billion)
      • Data Table on Gene therapy - Market size and forecast 2023-2028 ($ billion)
      • Chart on Gene therapy - Year-over-year growth 2023-2028 (%)
      • Data Table on Gene therapy - Year-over-year growth 2023-2028 (%)
    • 7.7 Others - Market size and forecast 2023-2028
      • Chart on Others - Market size and forecast 2023-2028 ($ billion)
      • Data Table on Others - Market size and forecast 2023-2028 ($ billion)
      • Chart on Others - Year-over-year growth 2023-2028 (%)
      • Data Table on Others - Year-over-year growth 2023-2028 (%)
    • 7.8 Market opportunity by Product
      • Market opportunity by Product ($ billion)
      • Data Table on Market opportunity by Product ($ billion)

    8 Market Segmentation by Source

    • 8.1 Market segments
      • Chart on Source - Market share (2023-2028) (%)
      • Data Table on Source - Market share (2023-2028) (%)
    • 8.2 Comparison by Source
      • Chart on Comparison by Source
      • Data Table on Comparison by Source
    • 8.3 Microbial - Market size and forecast (2023-2028)
      • Chart on Microbial - Market size and forecast (2023-2028) ($ million)
      • Data Table on Microbial - Market size and forecast (2023-2028) ($ million)
      • Chart on Microbial - Year-over-year growth (2023-2028) (%)
      • Data Table on Microbial - Year-over-year growth (2023-2028) (%)
    • 8.4 - Market size and forecast (2023-2028)
      • Chart on - Market size and forecast (2023-2028) ($ million)
      • Data Table on - Market size and forecast (2023-2028) ($ million)
      • Chart on - Year-over-year growth (2023-2028) (%)
      • Data Table on - Year-over-year growth (2023-2028) (%)
    • 8.5 Mammalian - Market size and forecast (2023-2028)
      • Chart on Mammalian - Market size and forecast (2023-2028) ($ million)
      • Data Table on Mammalian - Market size and forecast (2023-2028) ($ million)
      • Chart on Mammalian - Year-over-year growth (2023-2028) (%)
      • Data Table on Mammalian - Year-over-year growth (2023-2028) (%)
    • 8.6 Market opportunity by Source
      • Market opportunity by $segment_name ($ million)
      • Data Table on Market opportunity by $segment_name ($ million)

    9 Customer Landscape

    • 9.1 Customer landscape overview
      • Analysis of price sensitivity, lifecycle, customer purchase basket, adoption rates, and purchase criteria

    10 Geographic Landscape

    • 10.1 Geographic segmentation
      • Chart on Market share by geography 2023-2028 (%)
      • Data Table on Market share by geography 2023-2028 (%)
    • 10.2 Geographic comparison
      • Chart on Geographic comparison
      • Data Table on Geographic comparison
    • 10.3 North America - Market size and forecast 2023-2028
      • Chart on North America - Market size and forecast 2023-2028 ($ billion)
      • Data Table on North America - Market size and forecast 2023-2028 ($ billion)
      • Chart on North America - Year-over-year growth 2023-2028 (%)
      • Data Table on North America - Year-over-year growth 2023-2028 (%)
    • 10.4 Europe - Market size and forecast 2023-2028
      • Chart on Europe - Market size and forecast 2023-2028 ($ billion)
      • Data Table on Europe - Market size and forecast 2023-2028 ($ billion)
      • Chart on Europe - Year-over-year growth 2023-2028 (%)
      • Data Table on Europe - Year-over-year growth 2023-2028 (%)
    • 10.5 Asia - Market size and forecast 2023-2028
      • Chart on Asia - Market size and forecast 2023-2028 ($ billion)
      • Data Table on Asia - Market size and forecast 2023-2028 ($ billion)
      • Chart on Asia - Year-over-year growth 2023-2028 (%)
      • Data Table on Asia - Year-over-year growth 2023-2028 (%)
    • 10.6 Rest of World (ROW) - Market size and forecast 2023-2028
      • Chart on Rest of World (ROW) - Market size and forecast 2023-2028 ($ billion)
      • Data Table on Rest of World (ROW) - Market size and forecast 2023-2028 ($ billion)
      • Chart on Rest of World (ROW) - Year-over-year growth 2023-2028 (%)
      • Data Table on Rest of World (ROW) - Year-over-year growth 2023-2028 (%)
    • 10.7 US - Market size and forecast 2023-2028
      • Chart on US - Market size and forecast 2023-2028 ($ billion)
      • Data Table on US - Market size and forecast 2023-2028 ($ billion)
      • Chart on US - Year-over-year growth 2023-2028 (%)
      • Data Table on US - Year-over-year growth 2023-2028 (%)
    • 10.8 China - Market size and forecast 2023-2028
      • Chart on China - Market size and forecast 2023-2028 ($ billion)
      • Data Table on China - Market size and forecast 2023-2028 ($ billion)
      • Chart on China - Year-over-year growth 2023-2028 (%)
      • Data Table on China - Year-over-year growth 2023-2028 (%)
    • 10.9 Germany - Market size and forecast 2023-2028
      • Chart on Germany - Market size and forecast 2023-2028 ($ billion)
      • Data Table on Germany - Market size and forecast 2023-2028 ($ billion)
      • Chart on Germany - Year-over-year growth 2023-2028 (%)
      • Data Table on Germany - Year-over-year growth 2023-2028 (%)
    • 10.10 France - Market size and forecast 2023-2028
      • Chart on France - Market size and forecast 2023-2028 ($ billion)
      • Data Table on France - Market size and forecast 2023-2028 ($ billion)
      • Chart on France - Year-over-year growth 2023-2028 (%)
      • Data Table on France - Year-over-year growth 2023-2028 (%)
    • 10.11 Japan - Market size and forecast 2023-2028
      • Chart on Japan - Market size and forecast 2023-2028 ($ billion)
      • Data Table on Japan - Market size and forecast 2023-2028 ($ billion)
      • Chart on Japan - Year-over-year growth 2023-2028 (%)
      • Data Table on Japan - Year-over-year growth 2023-2028 (%)
    • 10.12 Market opportunity by geography
      • Market opportunity by geography ($ billion)
      • Data Tables on Market opportunity by geography ($ billion)

    11 Drivers, Challenges, and Opportunity/Restraints

    • 11.1 Market drivers
      • 11.2 Market challenges
        • 11.3 Impact of drivers and challenges
          • Impact of drivers and challenges in 2023 and 2028
        • 11.4 Market opportunities/restraints

          12 Competitive Landscape

          • 12.1 Overview
            • 12.2 Competitive Landscape
              • Overview on criticality of inputs and factors of differentiation
            • 12.3 Landscape disruption
              • Overview on factors of disruption
            • 12.4 Industry risks
              • Impact of key risks on business

            13 Competitive Analysis

            • 13.1 Companies profiled
              • Companies covered
            • 13.2 Market positioning of companies
              • Matrix on companies position and classification
            • 13.3 AbbVie Inc.
              • AbbVie Inc. - Overview
              • AbbVie Inc. - Product / Service
              • AbbVie Inc. - Key news
              • AbbVie Inc. - Key offerings
            • 13.4 Amgen Inc.
              • Amgen Inc. - Overview
              • Amgen Inc. - Product / Service
              • Amgen Inc. - Key news
              • Amgen Inc. - Key offerings
            • 13.5 AstraZeneca Plc
              • AstraZeneca Plc - Overview
              • AstraZeneca Plc - Product / Service
              • AstraZeneca Plc - Key news
              • AstraZeneca Plc - Key offerings
            • 13.6 Aurobindo Pharma Ltd.
              • Aurobindo Pharma Ltd. - Overview
              • Aurobindo Pharma Ltd. - Product / Service
              • Aurobindo Pharma Ltd. - Key offerings
            • 13.7 Baxter International Inc.
              • Baxter International Inc. - Overview
              • Baxter International Inc. - Business segments
              • Baxter International Inc. - Key news
              • Baxter International Inc. - Key offerings
              • Baxter International Inc. - Segment focus
            • 13.8 Biocon Ltd.
              • Biocon Ltd. - Overview
              • Biocon Ltd. - Business segments
              • Biocon Ltd. - Key offerings
              • Biocon Ltd. - Segment focus
            • 13.9 Celltrion Healthcare Co. Ltd.
              • Celltrion Healthcare Co. Ltd. - Overview
              • Celltrion Healthcare Co. Ltd. - Business segments
              • Celltrion Healthcare Co. Ltd. - Key offerings
              • Celltrion Healthcare Co. Ltd. - Segment focus
            • 13.10 Eli Lilly and Co.
              • Eli Lilly and Co. - Overview
              • Eli Lilly and Co. - Product / Service
              • Eli Lilly and Co. - Key news
              • Eli Lilly and Co. - Key offerings
            • 13.11 GlaxoSmithKline Plc
              • GlaxoSmithKline Plc - Overview
              • GlaxoSmithKline Plc - Business segments
              • GlaxoSmithKline Plc - Key news
              • GlaxoSmithKline Plc - Key offerings
              • GlaxoSmithKline Plc - Segment focus
            • 13.12 Merck and Co. Inc.
              • Merck and Co. Inc. - Overview
              • Merck and Co. Inc. - Business segments
              • Merck and Co. Inc. - Key news
              • Merck and Co. Inc. - Key offerings
              • Merck and Co. Inc. - Segment focus
            • 13.13 Novartis AG
              • Novartis AG - Overview
              • Novartis AG - Business segments
              • Novartis AG - Key news
              • Novartis AG - Key offerings
              • Novartis AG - Segment focus
            • 13.14 Pfizer Inc.
              • Pfizer Inc. - Overview
              • Pfizer Inc. - Product / Service
              • Pfizer Inc. - Key news
              • Pfizer Inc. - Key offerings
            • 13.15 Precision Biologics Inc.
              • Precision Biologics Inc. - Overview
              • Precision Biologics Inc. - Product / Service
              • Precision Biologics Inc. - Key offerings
            • 13.16 Samsung Electronics Co. Ltd.
              • Samsung Electronics Co. Ltd. - Overview
              • Samsung Electronics Co. Ltd. - Business segments
              • Samsung Electronics Co. Ltd. - Key news
              • Samsung Electronics Co. Ltd. - Key offerings
              • Samsung Electronics Co. Ltd. - Segment focus
            • 13.17 Sanofi SA
              • Sanofi SA - Overview
              • Sanofi SA - Business segments
              • Sanofi SA - Key news
              • Sanofi SA - Key offerings
              • Sanofi SA - Segment focus

            14 Appendix

            • 14.1 Scope of the report
              • 14.2 Inclusions and exclusions checklist
                • Inclusions checklist
                • Exclusions checklist
              • 14.3 Currency conversion rates for US$
                • Currency conversion rates for US$
              • 14.4 Research methodology
                • Research methodology
              • 14.5 Data procurement
                • Information sources
              • 14.6 Data validation
                • Data validation
              • 14.7 Validation techniques employed for market sizing
                • Validation techniques employed for market sizing
              • 14.8 Data synthesis
                • Data synthesis
              • 14.9 360 degree market analysis
                • 360 degree market analysis
              • 14.10 List of abbreviations
                • List of abbreviations

              Research Methodology

              Technavio presents a detailed picture of the market by way of study, synthesis, and summation of data from multiple sources. The analysts have presented the various facets of the market with a particular focus on identifying the key industry influencers. The data thus presented is comprehensive, reliable, and the result of extensive research, both primary and secondary.

              INFORMATION SOURCES

              Primary sources

              • Manufacturers and suppliers
              • Channel partners
              • Industry experts
              • Strategic decision makers

              Secondary sources

              • Industry journals and periodicals
              • Government data
              • Financial reports of key industry players
              • Historical data
              • Press releases

              DATA ANALYSIS

              Data Synthesis

              • Collation of data
              • Estimation of key figures
              • Analysis of derived insights

              Data Validation

              • Triangulation with data models
              • Reference against proprietary databases
              • Corroboration with industry experts

              REPORT WRITING

              Qualitative

              • Market drivers
              • Market challenges
              • Market trends
              • Five forces analysis

              Quantitative

              • Market size and forecast
              • Market segmentation
              • Geographical insights
              • Competitive landscape

              Interested in this report?

              Get your sample now to see our research methodology and insights!

              Download Now

              Frequently Asked Questions

              Biologic Therapeutics market growth will increase by $ 398.3 bn during 2024-2028.

              The Biologic Therapeutics market is expected to grow at a CAGR of 13.64% during 2024-2028.

              Biologic Therapeutics market is segmented by Application( Cancer, Infectious diseases, Autoimmune diseases, Others, other therapies) Product( Antibody therapeutics, Vaccines, Cell therapy, Gene therapy, Others)

              AbbVie Inc., Amgen Inc., Apogenix AG, AstraZeneca Plc, Aurobindo Pharma Ltd., Baxter International Inc., Biocon Ltd., BioMarin Pharmaceutical Inc., Celltrion Healthcare Co. Ltd., Eli Lilly and Co., GangaGen Biotechnologies Pvt Ltd., GlaxoSmithKline Plc, Johnson and Johnson Services Inc., Merck and Co. Inc., Novartis AG, Pfizer Inc., Precision Biologics Inc., Samsung Electronics Co. Ltd., Sanofi SA, Tubulis GmbH are a few of the key vendors in the Biologic Therapeutics market.

              North America will register the highest growth rate of 56% among the other regions. Therefore, the Biologic Therapeutics market in North America is expected to garner significant business opportunities for the vendors during the forecast period.

              US, China, Germany, France, Japan

              • Introduction of biosimilarsBiosimilars are biological products that are highly similar to an already approved biologic drug is the driving factor this market.
              • with no clinically meaningful differences in terms of safety is the driving factor this market.
              • purity is the driving factor this market.
              • and potency. They are developed using a different cell line is the driving factor this market.
              • manufacturing process is the driving factor this market.
              • or formulation is the driving factor this market.
              • but they have the same mechanism of action as the original biologic drug. The introduction of biosimilars has the potential to drive the biologic therapeutic market by increasing competition and reducing the cost of treatment. Biosimilars have the potential to provide greater access to life-saving medications for patients who otherwise could not afford them. Biosimilars may also help to reduce healthcare costs is the driving factor this market.
              • which is particularly important as healthcare spending continues to rise. Biosimilars are considered a follow-up of biologics once the latter faces patent expiration. The introduction of biosimilars is the most recent trend in the pharmaceutical market is the driving factor this market.
              • which will not only replace the biologics facing patent expiration but help in reducing healthcare costs. Thus is the driving factor this market.
              • the availability of biosimilars will drive the growth of the global biologic therapeutics market during the forecast period.   is the driving factor this market.

              The Biologic Therapeutics market vendors should focus on grabbing business opportunities from the Cancer segment as it accounted for the largest market share in the base year.