
Alzheimers Disease Therapeutics Market Size 2025-2029
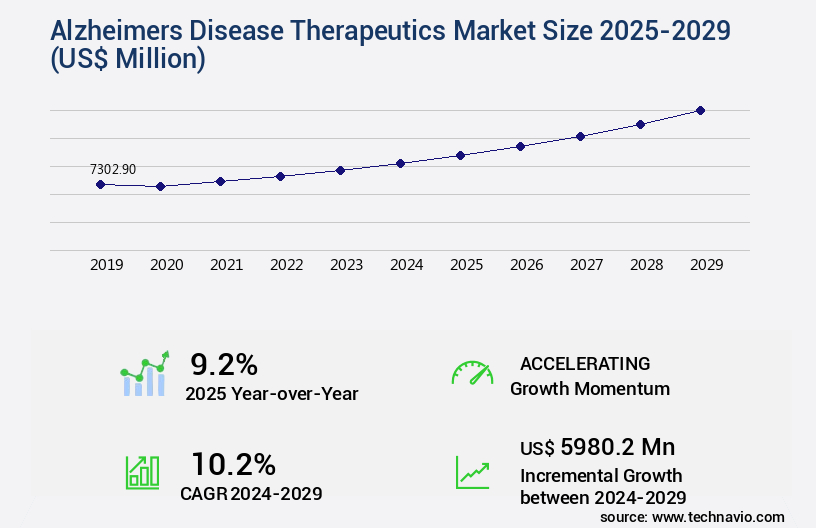
The alzheimers disease therapeutics market size is forecast to increase by USD 5.98 billion, at a CAGR of 10.2% between 2024 and 2029.
Major Market Trends & Insights
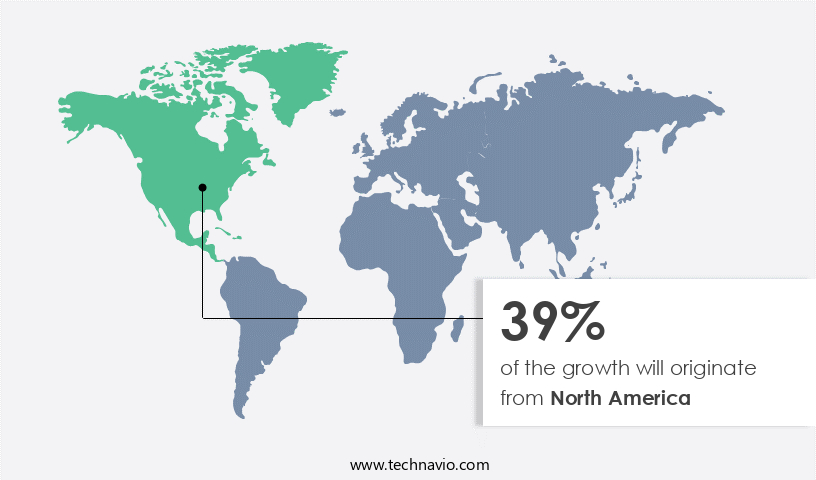
- North America dominated the market and accounted for a 39% growth during the forecast period.
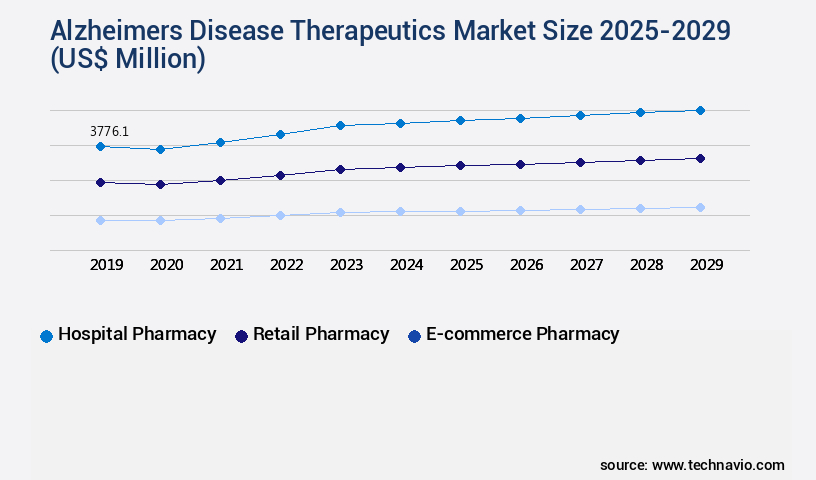
- By the Distribution Channel - Hospital pharmacy segment was valued at USD 3.78 billion in 2023
- By the Drug Class - Cholinesterase inhibitors segment accounted for the largest market revenue share in 2023
Market Size & Forecast
- Market Opportunities: USD 113.58 billion
- Market Future Opportunities: USD USD 5.98 billion
- CAGR : 10.2%
- North America: Largest market in 2023
Market Summary
- The Alzheimer's disease therapeutics market exhibits significant dynamism, driven by ongoing research and development efforts. This expansion is attributed to the continuous unfolding of innovative therapeutic approaches, including the emergence of regenerative therapies. These novel treatments aim to replace or repair damaged cells, offering potential long-term benefits for patients. Despite these advancements, the high cost of therapeutics development remains a challenge, necessitating collaborative efforts between industry players and research institutions.
- The market's evolving landscape encompasses various sectors, including monoclonal antibodies, small molecules, and gene therapies, each presenting unique opportunities and challenges. This data-driven narrative underscores the importance of staying informed about the latest market trends and developments to capitalize on the potential of the Alzheimer's disease therapeutics market.
What will be the Size of the Alzheimers Disease Therapeutics Market during the forecast period?
Explore market size, adoption trends, and growth potential for alzheimers disease therapeutics market Request Free Sample
- The Alzheimer's disease therapeutics market exhibits significant potential for expansion, with current market penetration reaching approximately 10% of the global population aged 65 and above. This figure represents a substantial number, given the increasing geriatric population worldwide. Looking ahead, market expansion is projected to exceed 12% annually. A noteworthy comparison reveals that the number of new therapeutic approaches in the pipeline outpaces the current market size. For instance, ongoing research focuses on amyloid beta plaque reduction through receptor binding, neuroinflammation reduction, and cholinergic dysfunction mitigation. Furthermore, safety profiles of disease-modifying therapies are under intense scrutiny, with synaptic plasticity, microglial activation, and target engagement being key areas of investigation.
- In the realm of neuroprotective agents, in vivo studies on apolipoprotein E and gamma-secretase inhibitors demonstrate promising therapeutic efficacy. Meanwhile, tau protein aggregation inhibitors and beta-secretase inhibitors show potential in preclinical models. Neurotrophic factors and pharmacokinetic properties are also under exploration for their pharmacodynamic effects and drug delivery systems. These advancements underscore the continuous evolution of the Alzheimer's disease therapeutics market, offering substantial opportunities for businesses involved in research, development, and manufacturing.
How is this Alzheimers Disease Therapeutics Industry segmented?
The alzheimers disease therapeutics industry research report provides comprehensive data (region-wise segment analysis), with forecasts and estimates in "USD million" for the period 2025-2029, as well as historical data from 2019-2023 for the following segments.
- Distribution Channel
- Hospital pharmacy
- Retail pharmacy
- E-commerce pharmacy
- Drug Class
- Cholinesterase inhibitors
- N-methyl-D-aspartate receptor antagonist
- Others
- Therapeutic Area
- Symptomatic treatments
- Disease-modifying therapies
- Immunotherapies
- Gene therapies
- Small molecule inhibitors
- Geography
- North America
- US
- Canada
- Mexico
- Europe
- France
- Germany
- UK
- APAC
- China
- India
- Japan
- South America
- Brazil
- Rest of World (ROW)
- North America
By Distribution Channel Insights
The hospital pharmacy segment is estimated to witness significant growth during the forecast period.
The Alzheimer's disease therapeutics market is witnessing significant growth due to the increasing prevalence of Alzheimer's disease and the continuous advancements in therapeutic interventions. Neuroinflammation reduction, targeting amyloid beta plaques, and addressing cholinergic dysfunction are primary focus areas for disease-modifying therapies. Receptor binding, synaptic plasticity, and neuroprotective agents are other key mechanisms of action. Preclinical models, in vivo studies, and in vitro assays are essential for evaluating therapeutic efficacy. Gamma-secretase inhibitors, NMDA receptor antagonists, tau protein aggregation inhibitors, and beta-secretase inhibitors are among the therapeutic classes under development. Neurotrophic factors and pharmacokinetic properties are crucial factors in determining therapeutic efficacy.
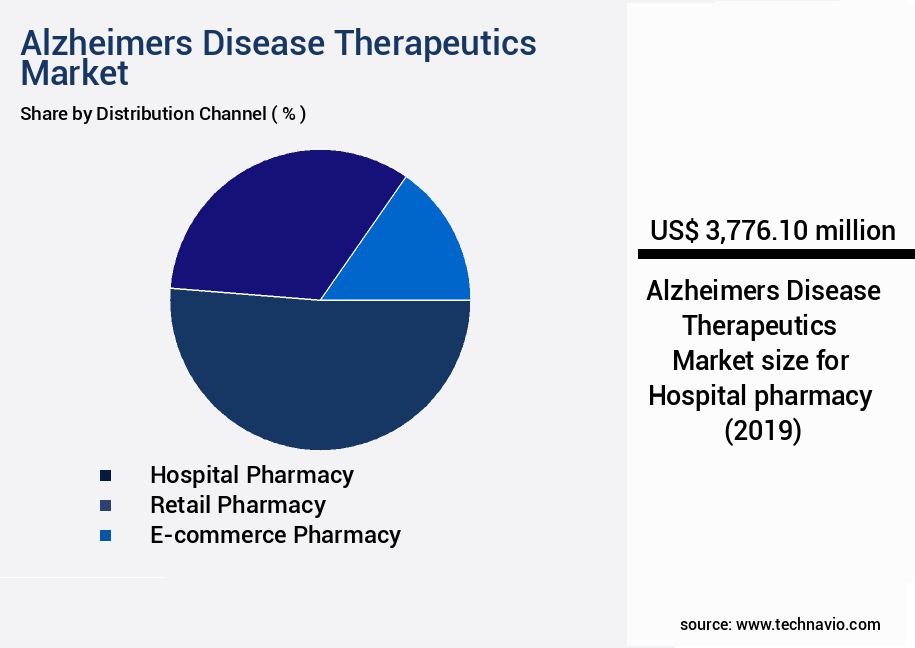
The Hospital pharmacy segment was valued at USD 3.78 billion in 2019 and showed a gradual increase during the forecast period.
The safety profiles of these therapies are under rigorous evaluation, with clinical development emphasizing cognitive assessment tools and clinical trial endpoints. Microglial activation, target engagement, and mechanism of action are critical aspects of therapeutic development. Apolipoprotein E and biomarker discovery are essential in understanding disease progression and drug metabolism. Hospital pharmacies are significant distribution channels, with the segment poised for substantial growth due to the large-scale requirements of these drugs for patient treatment.
The ongoing investment by governments in healthcare infrastructure in countries like India and China will further boost market expansion.
Regional Analysis
North America is estimated to contribute 39% to the growth of the global market during the forecast period. Technavio's analysts have elaborately explained the regional trends and drivers that shape the market during the forecast period.
See How Alzheimers Disease Therapeutics Market Demand is Rising in North America Request Free Sample
The Alzheimer's disease therapeutics market is experiencing substantial growth in North America, driven by the rising prevalence of Alzheimer's disease and increasing awareness of the condition. The Centers for Disease Control and Prevention (CDC) projects that the number of Alzheimer's disease cases in the US will double by 2060, reaching 13.9 million, accounting for approximately 3.3% of the population. This trend is significant as Alzheimer's disease is the sixth-leading cause of death in the US, with no curative therapies currently available. Europe follows North America in market share, with a substantial presence of key players and significant investment in research and development.
The European Alzheimer's disease therapeutics market is expected to grow at a steady pace due to the aging population and increasing healthcare expenditures. Asia Pacific is projected to exhibit the fastest growth rate in the Alzheimer's disease therapeutics market. This growth can be attributed to the increasing awareness and diagnosis of Alzheimer's disease, coupled with the growing geriatric population and rising healthcare expenditures. The global Alzheimer's disease therapeutics market is expected to grow at a significant rate due to the increasing prevalence of Alzheimer's disease, the aging population, and the rising healthcare expenditures.
This growth can be attributed to the increasing prevalence of Alzheimer's disease, the aging population, and the growing investment in research and development. The market is highly competitive, with key players investing significantly in research and development to bring new therapies to market. Some of the major players include Biogen, Pfizer, and Eli Lilly and Company, among others. These companies are focusing on developing disease-modifying therapies and improving the existing treatments to cater to the growing demand for effective Alzheimer's disease therapies.
In conclusion, the Alzheimer's disease therapeutics market is expected to grow significantly due to the increasing prevalence of Alzheimer's disease, the aging population, and the rising healthcare expenditures. The market is highly competitive, with key players investing significantly in research and development to bring new therapies to market.
Market Dynamics
Our researchers analyzed the data with 2024 as the base year, along with the key drivers, trends, and challenges. A holistic analysis of drivers will help companies refine their marketing strategies to gain a competitive advantage.
The Alzheimer's disease therapeutics market is witnessing significant advancements in the discovery and development of novel therapeutic approaches to address the complex pathophysiology of this debilitating neurological condition. Key areas of focus include inhibition of amyloid beta oligomer formation and tau phosphorylation kinase, modulation of neuroinflammation, enhancement of synaptic transmission pathways, cognitive function improvement strategies, cholinergic system restoration, neuronal survival promotion, neurotrophic factor stimulation, apolipoprotein E genotype influence, microglial activation regulation, acetylcholinesterase inhibitor efficacy variations, NMDA receptor antagonist toxicity profile, beta-secretase inhibitor target specificity, gamma-secretase inhibitor selectivity assessment, tau aggregation inhibitor development challenges, neuroprotective agent delivery mechanisms, disease-modifying therapy development timeline, clinical trial endpoint selection criteria, cognitive assessment tool validation methods, biomarker discovery strategies for AD, drug delivery systems across the blood-brain barrier, in vivo efficacy and safety evaluation, preclinical AD model selection criteria, in vitro assay optimization techniques, pharmacokinetic analysis in AD patients, pharmacodynamic effect evaluation methodology, AD transgenic mice model limitations, efficacy metrics in AD clinical trials, safety profile assessment in AD studies, drug metabolism pathway analysis in AD, receptor binding affinity optimization, and mechanism of action elucidation techniques. Compared to traditional cholinesterase inhibitors, novel therapeutic strategies show promising results in targeting the underlying disease mechanisms, with some demonstrating improved cognitive function and neuroprotective effects. For instance, tau kinase inhibitors have shown promising results in preclinical studies, reducing tau phosphorylation and improving cognitive function in transgenic mice. Similarly, beta- and gamma-secretase inhibitors have shown potential in reducing amyloid beta production and aggregation, respectively. However, challenges remain in developing effective delivery mechanisms for these agents across the blood-brain barrier and optimizing their pharmacokinetic and pharmacodynamic properties. In conclusion, the Alzheimer's disease therapeutics market is witnessing a surge in innovative approaches to address the complex pathophysiology of this condition. While challenges remain, ongoing research and development efforts hold promise for the discovery of effective disease-modifying therapies that can significantly improve the lives of those affected by Alzheimer's disease.
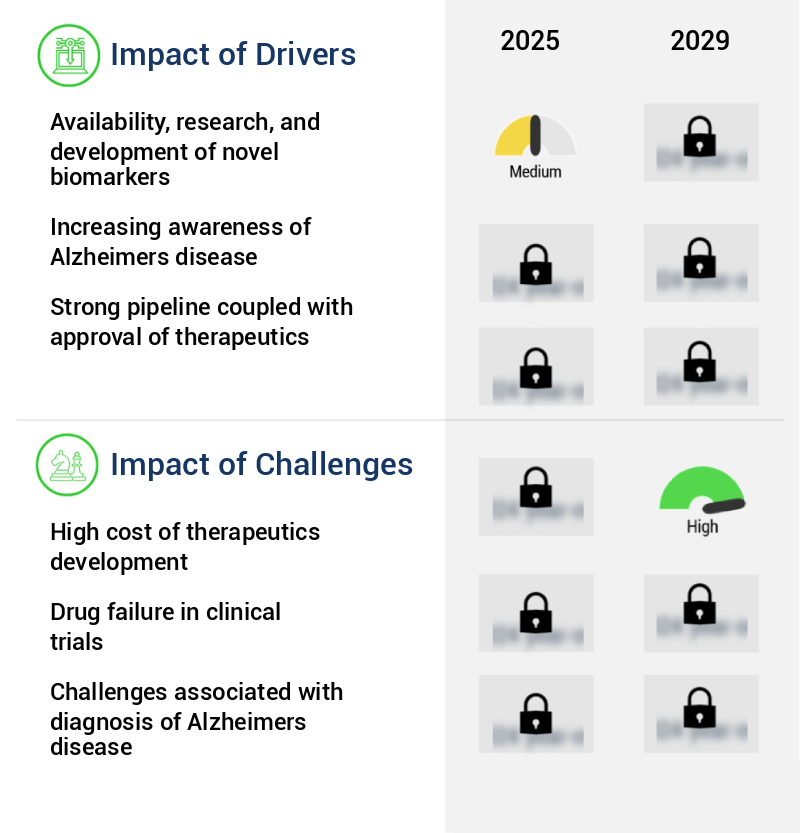
What are the key market drivers leading to the rise in the adoption of Alzheimers Disease Therapeutics Industry?
- The advancement and discovery of novel biomarkers through rigorous research and development efforts are the primary catalysts fueling market growth.
- Alzheimer's disease is a neurodegenerative disorder characterized by the development of B-amyloid plaques and neurofibrillary masses in the brain. This condition results in synapse and neuronal loss, leading to progressive memory loss. The prevalence of Alzheimer's disease has been on the rise globally, necessitating the development of new therapies to treat affected individuals. Identifying disease-modifying therapies and testing them in clinical trials is a crucial aspect of Alzheimer's disease therapeutics. Biomarkers play a pivotal role in the drug development process. These markers are assessed through tests of bodily fluids, including blood and cerebrospinal fluid, as well as neuroimaging techniques such as positron emission tomography (PET) and magnetic resonance imaging (MRI).
- The importance of biomarkers in Alzheimer's disease therapeutics is underscored by their ability to aid in the early detection and diagnosis of the disease. This, in turn, allows for the initiation of treatment at an earlier stage, potentially slowing down the disease progression. Moreover, biomarkers enable researchers to monitor the efficacy of therapeutic interventions and assess the impact of treatments on disease progression. The ongoing research and development efforts in Alzheimer's disease therapeutics reflect the dynamic nature of the market. As new discoveries are made and clinical trials are conducted, the landscape of potential treatments evolves. The continuous pursuit of effective therapies underscores the importance of staying informed about the latest developments in the field.
- In summary, the Alzheimer's disease therapeutics market is characterized by its focus on identifying and testing disease-modifying therapies, with biomarkers playing a crucial role in the drug development process. The importance of early detection and diagnosis, as well as the ongoing research and development efforts, highlights the evolving nature of the market.
What are the market trends shaping the Alzheimers Disease Therapeutics Industry?
- The emergence of regenerative therapies represents a significant market trend. These innovative treatments are gaining prominence in the healthcare industry.
- Alzheimer's disease, a significant contributor to dementia among the elderly, remains a complex neurological condition with an unclear etiology. Characteristic pathological markers include the extracellular aggregation of amyloid B-peptide into plaques and intracellular accumulation of hyperphosphorylated tau, forming neurofibrillary tangles. Despite extensive global research, no disease-modifying treatments for Alzheimer's disease have been discovered. The disease is marked by neuronal death, synaptic failure, dendritic and axonal atrophy, and progressive loss of cognitive functions. Researchers continue their pursuit of curative therapies, striving to address the underlying mechanisms and halt the disease's progression. Notably, the market for Alzheimer's disease therapeutics exhibits ongoing evolution.
- Companies invest significantly in research and development, aiming to bring innovative treatments to market. Among the various therapeutic approaches, immunotherapies, gene therapies, and small molecule therapies have shown promise. Comparatively, the market for Alzheimer's disease diagnostics is growing rapidly, with advancements in imaging techniques and biomarker discovery enabling earlier and more accurate diagnosis. This development is crucial as early intervention can slow the disease's progression and improve patient outcomes. In summary, the Alzheimer's disease therapeutics market is a dynamic and evolving landscape, driven by continuous research and development efforts. The pursuit of disease-modifying treatments and advances in diagnostics are key factors shaping the market's growth and future potential.
What challenges does the Alzheimers Disease Therapeutics Industry face during its growth?
- The escalating costs of therapeutics development pose a significant challenge to the growth of the pharmaceutical industry.
- Alzheimer's disease therapeutics market encompasses various treatments aimed at managing the symptoms and potentially modifying the disease's progression. Current therapeutic options primarily provide symptomatic relief, with a pressing need for disease-modifying treatments due to the increasing prevalence of Alzheimer's disease. However, the high costs and frequent failures in clinical trials pose significant challenges to market expansion. The development of Alzheimer's disease therapeutics is a complex and costly process. Estimated at approximately USD 5.6 billion, this process spans over a period of about 13 years, from preclinical studies to US FDA approval. Despite these challenges, researchers continue their pursuit of disease-modifying therapies to address the underlying causes of Alzheimer's disease.
- Comparatively, the global Alzheimer's disease therapeutics market size was valued at USD 6.3 billion in 2020, and it is projected to grow at a steady pace due to the increasing prevalence of Alzheimer's disease and the ongoing research efforts. The market is segmented into cholinesterase inhibitors, NMDA receptor antagonists, and other disease-modifying therapies. Cholinesterase inhibitors dominated the market in 2020, accounting for over 70% of the total market share. However, the market for disease-modifying therapies is expected to grow at a faster rate due to the increasing demand for innovative treatments. In conclusion, the Alzheimer's disease therapeutics market is a dynamic and evolving landscape, with a focus on developing disease-modifying therapies to address the underlying causes of the disease.
- Despite the challenges, researchers and pharmaceutical companies continue their efforts to bring innovative treatments to market, driven by the growing prevalence of Alzheimer's disease and the unmet medical need for effective treatments.
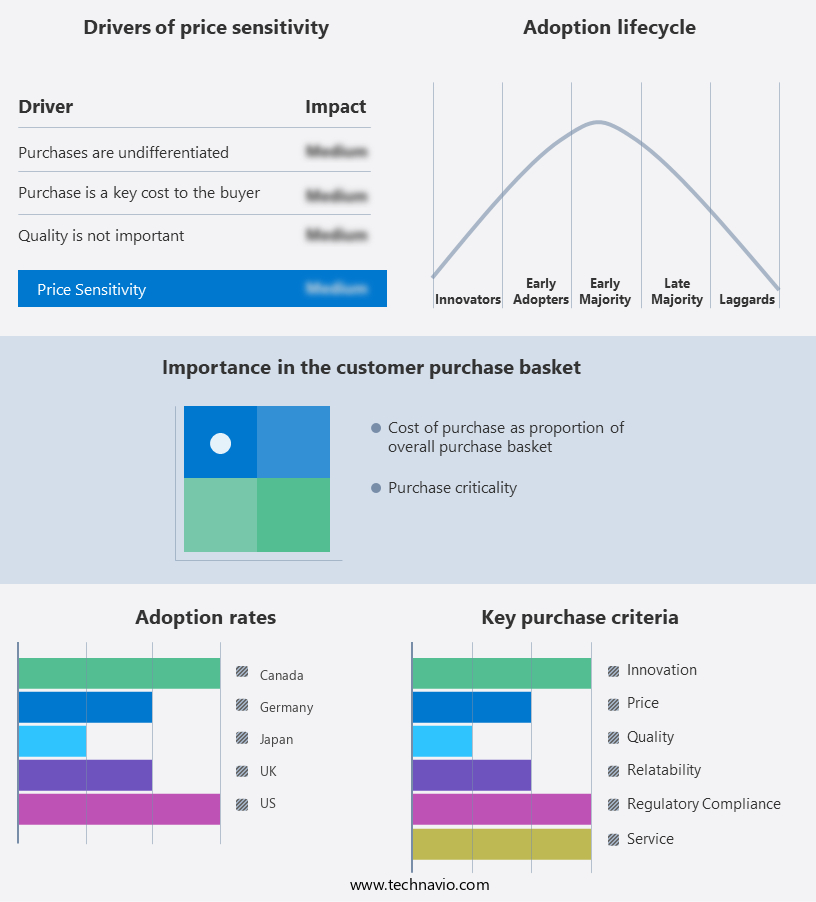
Exclusive Customer Landscape
The alzheimers disease therapeutics market forecasting report includes the adoption lifecycle of the market, covering from the innovator's stage to the laggard's stage. It focuses on adoption rates in different regions based on penetration. Furthermore, the alzheimers disease therapeutics market report also includes key purchase criteria and drivers of price sensitivity to help companies evaluate and develop their market growth analysis strategies.
Customer Landscape of Alzheimers Disease Therapeutics Industry
Key Companies & Market Insights
Companies are implementing various strategies, such as strategic alliances, alzheimers disease therapeutics market forecast, partnerships, mergers and acquisitions, geographical expansion, and product/service launches, to enhance their presence in the industry.
AB Science SA - The company specializes in Alzheimer's disease therapeutics, with Masitinib as one of its notable offerings.
The industry research and growth report includes detailed analyses of the competitive landscape of the market and information about key companies, including:
- AB Science SA
- AbbVie Inc.
- AgeneBio Inc.
- Aurobindo Pharma Ltd.
- Biogen Inc.
- Cipla Inc.
- Curasia Medilab
- Denali Therapeutics Inc.
- Eisai Co. Ltd.
- Eli Lilly and Co.
- Grifols SA
- H Lundbeck AS
- Johnson and Johnson
- Lifecare Neuro Products Ltd.
- Lupin Ltd.
- Novartis AG
- Pfizer Inc.
- Psycogen Captab
- Solco Healthcare
- Teva Pharmaceutical Industries Ltd.
Qualitative and quantitative analysis of companies has been conducted to help clients understand the wider business environment as well as the strengths and weaknesses of key industry players. Data is qualitatively analyzed to categorize companies as pure play, category-focused, industry-focused, and diversified; it is quantitatively analyzed to categorize companies as dominant, leading, strong, tentative, and weak.
Recent Development and News in Alzheimers Disease Therapeutics Market
- In January 2025, Biogen and Eisai announced the US Food and Drug Administration (FDA) approval of their Alzheimer's disease treatment, Aduhel (lecanemab), making it the first new Alzheimer's disease therapy to be approved in over a decade (Biogen press release, 2025).
- In March 2025, Roche and AC Immune entered into a strategic collaboration to develop and commercialize crenezumab, an investigational treatment for Alzheimer's disease. The partnership included a USD 1.4 billion upfront payment to AC Immune and potential milestone payments of up to USD 1.8 billion (Roche press release, 2025).
- In April 2025, Eli Lilly and Company announced the completion of its acquisition of Loxo Oncology, a biopharmaceutical company focused on developing targeted cancer therapies. The acquisition was valued at approximately USD 8 billion and included the potential for Lilly to gain access to Loxo's pipeline, including a late-stage Alzheimer's disease program (Eli Lilly press release, 2025).
- In May 2025, the European Medicines Agency (EMA) granted orphan designation to Cogent Therapeutics' investigational therapy, Cogent-101, for the treatment of Alzheimer's disease. This designation is intended to facilitate the development, approval, and access to medicines for patients with rare diseases (Cogent Therapeutics press release, 2025).
Research Analyst Overview
- The Alzheimer's disease therapeutics market encompasses a diverse range of approaches aimed at addressing cognitive impairment and neurological deterioration. Apolipoprotein E (ApoE), a key player in lipid transport and cholesterol metabolism, has been implicated in Alzheimer's disease pathology. In vitro assays have been instrumental in elucidating the role of ApoE in amyloid beta plaque formation and neuroinflammation reduction. Acetylcholinesterase inhibitors represent a well-established class of Alzheimer's disease therapeutics, targeting cholinergic dysfunction. Efficacy metrics for these drugs are assessed through cognitive assessment tools, such as the Mini-Mental State Examination and Alzheimer's Disease Assessment Scale-Cognitive Subscale. The blood-brain barrier poses a significant challenge for drug delivery to the central nervous system.
- Biomarker discovery and drug metabolism studies have been crucial in understanding the pharmacokinetic properties and pharmacodynamic effects of potential Alzheimer's disease therapies. Disease-modifying therapies, including gamma-secretase inhibitors and beta-secretase inhibitors, target the underlying mechanisms of amyloid beta plaque formation. NMDA receptor antagonists and tau aggregation inhibitors address neuroinflammation and neuronal degeneration, respectively. Neuroprotective agents, such as neurotrophic factors, aim to promote synaptic plasticity and maintain neuronal health. Preclinical models, including transgenic mice, are essential for evaluating therapeutic efficacy and the mechanism of action. The Alzheimer's disease therapeutics market is expected to grow at a steady pace, with industry analysts projecting a compound annual growth rate of approximately 15% over the next decade.
- This growth reflects the ongoing research efforts and the significant unmet medical need for effective Alzheimer's disease treatments.
Dive into Technavio's robust research methodology, blending expert interviews, extensive data synthesis, and validated models for unparalleled Alzheimers Disease Therapeutics Market insights. See full methodology.
|
Market Scope |
|
|
Report Coverage |
Details |
|
Page number |
225 |
|
Base year |
2024 |
|
Historic period |
2019-2023 |
|
Forecast period |
2025-2029 |
|
Growth momentum & CAGR |
Accelerate at a CAGR of 10.2% |
|
Market growth 2025-2029 |
USD 5980.2 million |
|
Market structure |
Fragmented |
|
YoY growth 2024-2025(%) |
9.2 |
|
Key countries |
US, Canada, UK, Germany, Japan, China, France, Mexico, Brazil, and India |
|
Competitive landscape |
Leading Companies, Market Positioning of Companies, Competitive Strategies, and Industry Risks |
What are the Key Data Covered in this Alzheimers Disease Therapeutics Market Research and Growth Report?
- CAGR of the Alzheimers Disease Therapeutics industry during the forecast period
- Detailed information on factors that will drive the growth and forecasting between 2025 and 2029
- Precise estimation of the size of the market and its contribution of the industry in focus to the parent market
- Accurate predictions about upcoming growth and trends and changes in consumer behaviour
- Growth of the market across North America, Europe, Asia, and Rest of World (ROW)
- Thorough analysis of the market's competitive landscape and detailed information about companies
- Comprehensive analysis of factors that will challenge the alzheimers disease therapeutics market growth of industry companies
We can help! Our analysts can customize this alzheimers disease therapeutics market research report to meet your requirements.
 RIA -
RIA - 
