Cancer Diagnostics Market Size 2024-2028
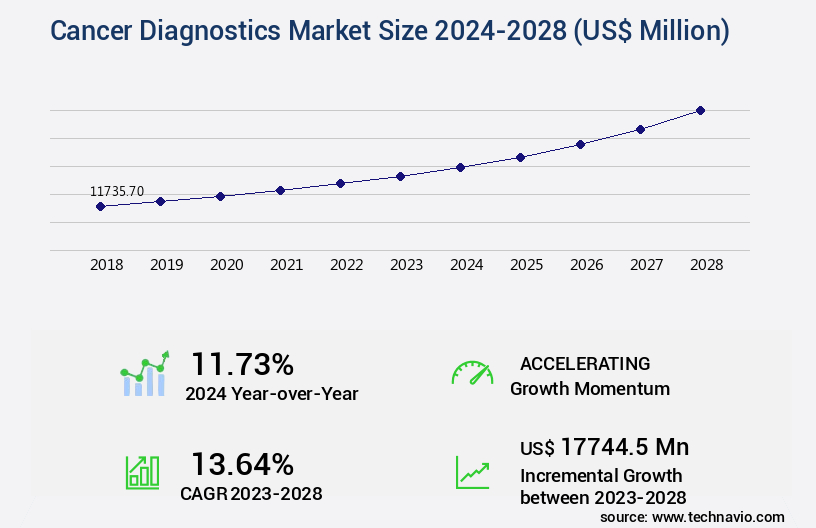
The cancer diagnostics market size is valued to increase USD 17.74 billion, at a CAGR of 13.64% from 2023 to 2028. High prevalence of cancer will drive the cancer diagnostics market.
Major Market Trends & Insights
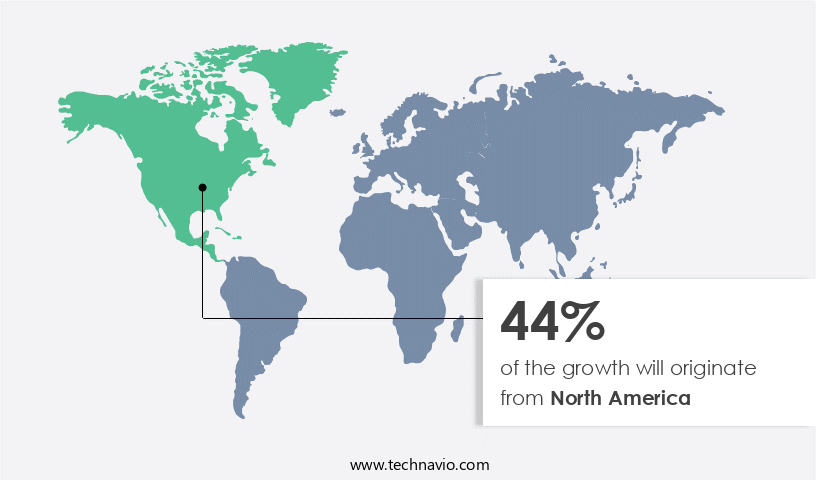
- North America dominated the market and accounted for a 44% growth during the forecast period.
- By End-user - Hospitals and clinics segment was valued at USD 6.71 billion in 2022
- By Type - IVD segment accounted for the largest market revenue share in 2022
Market Size & Forecast
- Market Opportunities: USD 220.16 million
- Market Future Opportunities: USD 17744.50 million
- CAGR : 13.64%
- North America: Largest market in 2022
Market Summary
- The market represents a significant and continually evolving sector, driven by the high prevalence of cancer worldwide. According to the World Health Organization, an estimated 19.3 million new cancer cases and nearly 10.0 million cancer deaths occurred in 2020. Core technologies, such as molecular diagnostics and imaging, are at the forefront of innovation, enabling earlier and more accurate detection. Applications, including liquid biopsies and non-invasive tests, are gaining traction due to their convenience and potential for improved patient outcomes. Service types, including laboratory testing and in-vitro diagnostics, are essential components of the market, with increasing investment in research and development (R&D) and advances in technology.
- Despite these opportunities, challenges persist, including the high cost of developing companion diagnostics and navigating complex regulatory landscapes. The market's dynamics are shaped by these factors and the ongoing unfolding of regional trends, with North America and Europe leading in market share due to advanced healthcare infrastructure and robust R&D investments.
What will be the Size of the Cancer Diagnostics Market during the forecast period?
Get Key Insights on Market Forecast (PDF) Request Free Sample
How is the Cancer Diagnostics Market Segmented and what are the key trends of market segmentation?
The cancer diagnostics industry research report provides comprehensive data (region-wise segment analysis), with forecasts and estimates in "USD million" for the period 2024-2028, as well as historical data from 2018-2022 for the following segments.
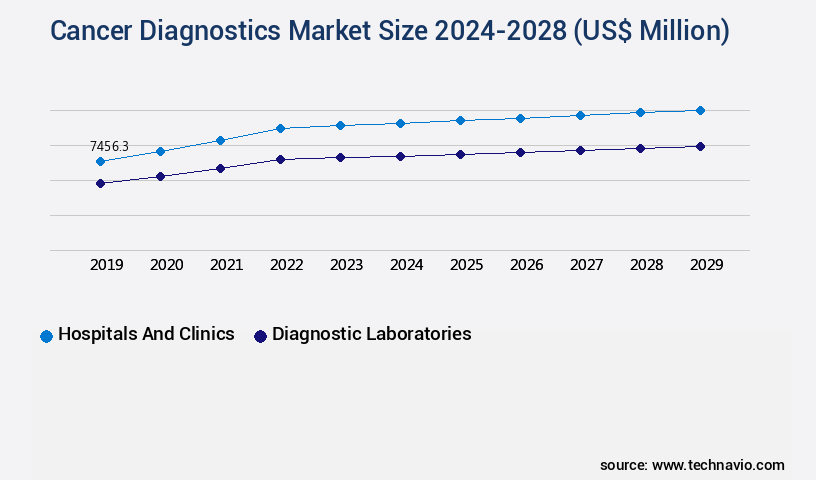
- End-user
- Hospitals and clinics
- Diagnostic laboratories
- Type
- IVD
- Imaging
- LDT
- Geography
- North America
- US
- Canada
- Europe
- France
- Germany
- APAC
- China
- Rest of World (ROW)
- North America
By End-user Insights
The hospitals and clinics segment is estimated to witness significant growth during the forecast period.
The market holds significant importance in the healthcare sector, delivering essential benefits to hospitals and clinics. This market's impact is felt across various levels, including enhanced patient care and satisfaction, operational efficiency at POC (Point of Care), and cost savings through strengthened operational bottom lines. In 2023, hospitals emerged as the primary revenue drivers for the market expansion. This growth can be attributed to the rising prevalence of chronic diseases, such as cervical, head and neck, lung, skin, and colorectal cancers, and the availability of skilled professionals adept at utilizing advanced diagnostic tools. These tools include circulating tumor cells analysis, cytogenetic analysis, molecular profiling, and liquid biopsy, among others.
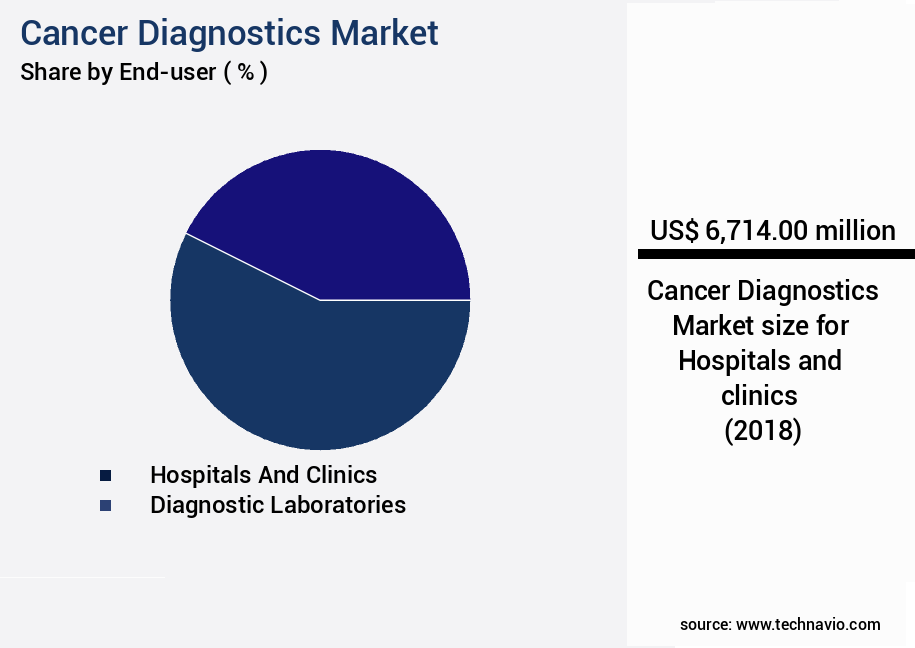
The Hospitals and clinics segment was valued at USD 6.71 billion in 2018 and showed a gradual increase during the forecast period.
Furthermore, the ongoing pursuit of biomarker discovery, minimal residual disease detection, and personalized medicine initiatives fuel market growth. Multiplex assays, RNA sequencing, and gene expression analysis are integral to these advancements. Prognostic markers, protein biomarkers, and predictive biomarkers are crucial in therapeutic response assessment and treatment efficacy evaluation. Clinical validation, early detection, and disease progression monitoring are integral to market development. Technologies like microarray technology, DNA sequencing, next-generation sequencing, mass spectrometry, and digital pathology are continually evolving to enhance diagnostic accuracy and reduce false negative and false positive rates. Diagnostic imaging and cancer screening are also integral components of the market, ensuring optimal patient care and outcomes.
The market's future growth is expected to be driven by the increasing adoption of targeted therapies and regulatory approvals for innovative diagnostic solutions.
Regional Analysis
North America is estimated to contribute 44% to the growth of the global market during the forecast period.Technavio's analysts have elaborately explained the regional trends and drivers that shape the market during the forecast period.
See How Cancer Diagnostics Market Demand is Rising in North America Request Free Sample
In North America, the market is witnessing significant growth due to the presence of numerous advanced medical facilities, such as NYU Langone Hospitals in New York and Mayo Clinic in Rochester. These institutions offer state-of-the-art infrastructure and advanced treatment solutions for various types of cancers. The increasing focus on personalized medicines and associated diagnostics has led to a surge in demand for these services. Government initiatives to increase cancer diagnostics awareness and early disease detection have further fueled market expansion.
Overall, the North American market is expected to witness continued growth in the coming years, driven by technological advancements and increasing demand for early and accurate cancer diagnoses.
Market Dynamics
Our researchers analyzed the data with 2023 as the base year, along with the key drivers, trends, and challenges. A holistic analysis of drivers will help companies refine their marketing strategies to gain a competitive advantage.
The market is a dynamic and evolving landscape, driven by advancements in technology and the clinical utility of various diagnostic modalities. This market is witnessing significant growth due to the integration of multi-omics data, including genomic alterations, predictive biomarkers for targeted therapies, and minimal residual disease detection methods. Liquid biopsy for early cancer detection is gaining traction, with technologies such as next generation sequencing workflow optimization, digital pathology image analysis software, mass spectrometry based proteomics analysis, and immunohistochemistry staining protocols leading the way. The clinical validation of novel diagnostic assays using machine learning and personalized medicine approaches is revolutionizing cancer diagnosis and treatment.
Prognostic markers in cancer survival and therapeutic response prediction models are increasingly important in improving patient outcomes. Advanced imaging techniques in oncology, such as digital pathology and chromosomal abnormalities detection methods, are providing valuable insights into cancer progression and treatment response. More than 70% of new product developments in the market focus on improving diagnostic accuracy metrics and regulatory pathways for diagnostic approval. The industrial application segment accounts for a significantly larger share than the academic segment, reflecting the growing demand for rapid and accurate cancer diagnoses in clinical settings. The impact of genomic instability on cancer prognosis is a major area of research, with the potential to significantly improve patient outcomes.
Despite the progress made, challenges remain, including the need for standardization and validation of new diagnostic technologies, as well as regulatory hurdles and reimbursement issues. The market is highly competitive, with a minority of players, less than 15%, dominating the high-end instrument market. The race is on to develop more accurate, cost-effective, and accessible diagnostic solutions to meet the growing demand for early and personalized cancer detection.
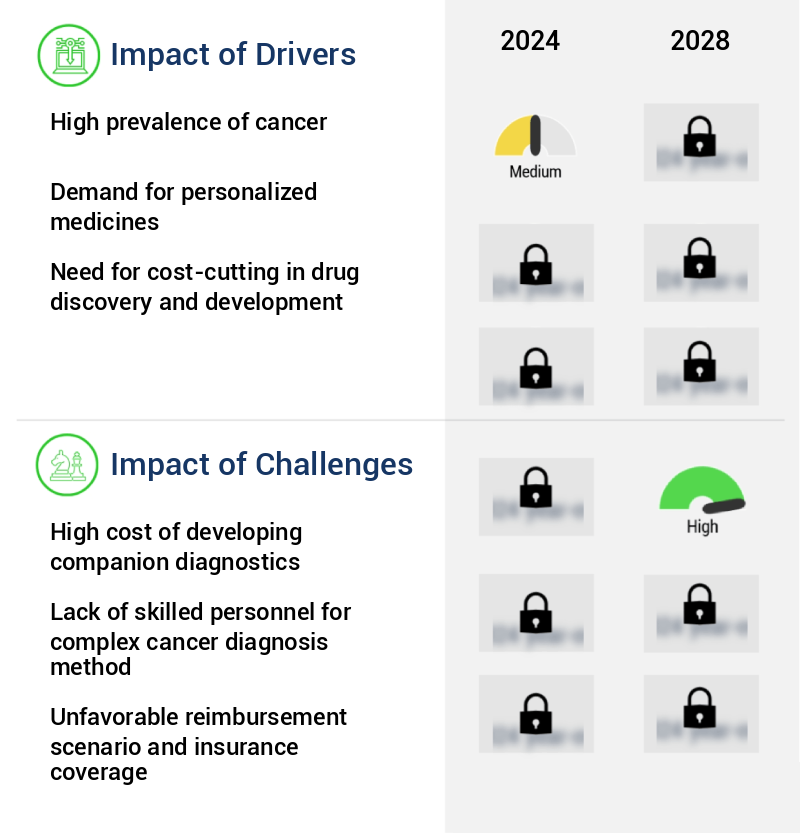
What are the key market drivers leading to the rise in the adoption of Cancer Diagnostics Industry?
- The high prevalence of cancer significantly drives the market due to the increasing demand for early detection and effective treatment solutions.
- The global health crisis landscape is marked by the continuous emergence of various diseases, with cancer being a significant concern. According to the National Cancer Institute, approximately 1.8 million new cancer cases were diagnosed in the United States alone in 2020, resulting in over 600,000 deaths. This alarming trend is driven by factors such as unhealthy lifestyle choices, including poor diet, physical inactivity, tobacco use, and excessive alcohol consumption. Additionally, exposure to environmental pollutants, ionizing radiations, chemical mutagens, and infectious micro-organisms contribute to the increasing cancer incidence. As the global population ages and healthcare advances, the costs associated with cancer diagnosis and treatment continue to escalate.
- The adoption of innovative and expensive treatments, such as immunotherapies and targeted therapies, further increases these costs. Despite these challenges, ongoing research and advancements in cancer care offer hope for improved patient outcomes and more effective, cost-efficient treatments. In summary, the cancer market is characterized by a growing need for advanced diagnostics and treatments due to the rising incidence of cancer cases worldwide. This dynamic landscape requires continuous innovation and adaptation to meet the evolving needs of patients and healthcare systems.
What are the market trends shaping the Cancer Diagnostics Industry?
- The upcoming market trend involves an increase in research and development and advances in technology. Increases in research and development and the resulting technological advances are shaping the current market trend.
- Company innovation in cancer diagnostics is driven by the development of advanced diagnostic devices. One such innovative approach is nanoparticle-based cancer theranostics, which integrates diagnostic and therapeutic agents with gold nanoparticles. This combination offers real-time monitoring of target tumors and enhances understanding of cancer drug impact. Similar approaches are anticipated to fuel the emergence of new theranostic combined therapeutics. Market growth is underpinned by the increasing demand for these therapeutics, leading to heightened adoption of cancer diagnostic devices globally. Numerous companies are investing significantly in research and development to expand their offerings in this sector.
- The market's continuous evolution is marked by the introduction of more sophisticated diagnostic tools and the integration of AI and machine learning technologies to improve accuracy and efficiency.
What challenges does the Cancer Diagnostics Industry face during its growth?
- The high cost of developing companion diagnostics is a significant challenge that hinders the growth of the industry. Companion diagnostics, which are tests that are used in conjunction with therapeutic products to optimize treatment, require substantial investment in research and development, making it a crucial issue for industry expansion.
- Biomarkers play a pivotal role in the healthcare industry as they aid in the identification and diagnosis of various medical conditions. The use of companion diagnostics, which combine biomarkers with specific contexts, enhances the ability to obtain valuable biological and clinical information for improved therapeutic decision-making. However, the development of novel biomarkers is an intricate and costly process. The initial investment in biomarker development is substantial. This cost is primarily driven by the need for advanced technologies and the expertise of highly specialized professionals. The development process commences with the creation of technology platforms, which serve as the foundation for biomarker identification and measurement.
- Subsequently, these platforms are applied to specific applications, further refining the biomarker's potential utility. Despite the high costs, the biomarker development market continues to evolve, with ongoing research and advancements in technology driving innovation. The ongoing investment in this sector underscores the significant potential of biomarkers in revolutionizing healthcare and improving patient outcomes.
Exclusive Customer Landscape
The cancer diagnostics market forecasting report includes the adoption lifecycle of the market, covering from the innovator's stage to the laggard's stage. It focuses on adoption rates in different regions based on penetration. Furthermore, the cancer diagnostics market report also includes key purchase criteria and drivers of price sensitivity to help companies evaluate and develop their market growth analysis strategies.
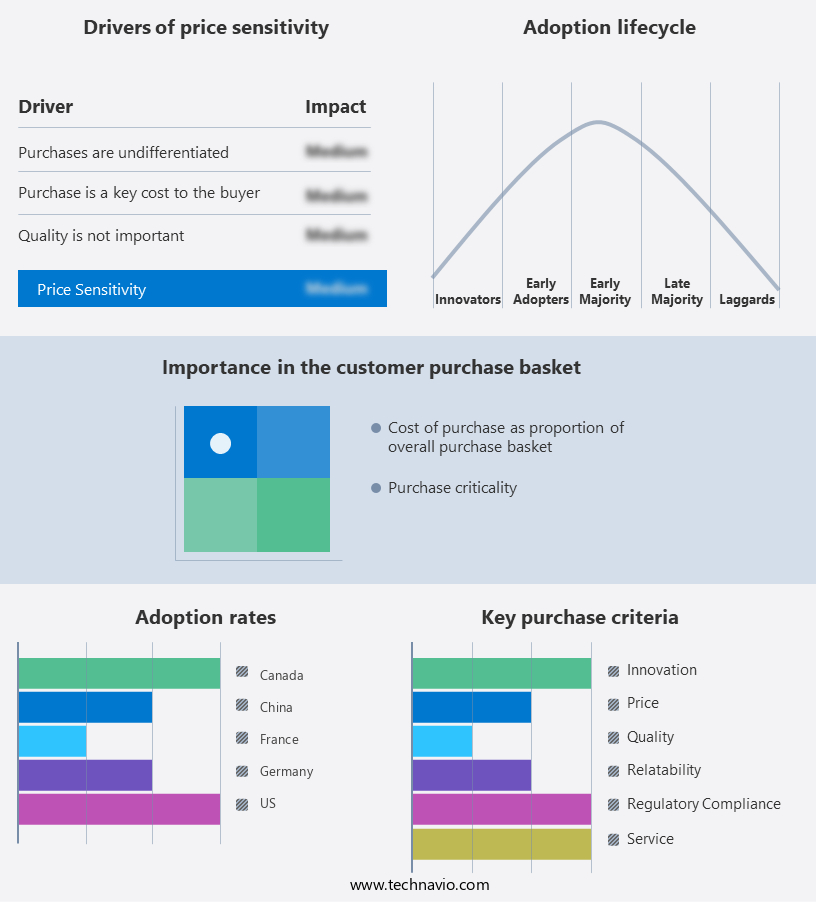
Customer Landscape of Cancer Diagnostics Industry
Competitive Landscape & Market Insights
Companies are implementing various strategies, such as strategic alliances, cancer diagnostics market forecast, partnerships, mergers and acquisitions, geographical expansion, and product/service launches, to enhance their presence in the industry.
Abbott Laboratories - This company specializes in cancer diagnostics, delivering clinically significant results for the most prevalent and expensive types of cancer through the use of comprehensive tumor marker panels and harmonized instrument families.
The industry research and growth report includes detailed analyses of the competitive landscape of the market and information about key companies, including:
- Abbott Laboratories
- Agilent Technologies Inc.
- Astellas Pharma Inc.
- Becton Dickinson and Co.
- bioMerieux SA
- Bristol Myers Squibb Co.
- Eli Lilly and Co.
- F. Hoffmann La Roche Ltd.
- General Electric Co.
- GlaxoSmithKline Plc
- Hologic Inc.
- Illumina Inc.
- Merck KGaA
- Myriad Genetics Inc.
- Novartis AG
- Pfizer Inc.
- QIAGEN NV
- Quest Diagnostics Inc.
- Siemens AG
- Thermo Fisher Scientific Inc.
Qualitative and quantitative analysis of companies has been conducted to help clients understand the wider business environment as well as the strengths and weaknesses of key industry players. Data is qualitatively analyzed to categorize companies as pure play, category-focused, industry-focused, and diversified; it is quantitatively analyzed to categorize companies as dominant, leading, strong, tentative, and weak.
Recent Development and News in Cancer Diagnostics Market
- In January 2024, Roche Holding AG announced the launch of its new fully automated cobas EGFR Mutation Test v2, expanding its portfolio of oncology diagnostics solutions. This test helps identify EGFR mutations in non-small cell lung cancer patients, enabling personalized treatment decisions (Roche Press Release, 2024).
- In March 2024, Illumina, Inc. and Grail, Inc. entered into a strategic collaboration to develop and commercialize multi-cancer early detection tests. The partnership combines Illumina's sequencing technology with Grail's proprietary technology for detecting and identifying cancer at early stages (Illumina Press Release, 2024).
- In May 2024, QIAGEN N.V. completed the acquisition of Thermo Fisher Scientific's Clinical and Applied Laboratories business, strengthening its position in the molecular diagnostics market. The acquisition includes the GeneGlobe and OneCodex platforms, expanding QIAGEN's portfolio of genetic and genomic testing solutions (QIAGEN Press Release, 2024).
- In April 2025, the U.S. Food and Drug Administration (FDA) granted approval to Guardant Health, Inc.'s Lunar-2 liquid biopsy test for non-small cell lung cancer patients. This test enables monitoring of cancer progression and response to treatment, offering a non-invasive alternative to traditional biopsies (Guardant Health Press Release, 2025).
Dive into Technavio's robust research methodology, blending expert interviews, extensive data synthesis, and validated models for unparalleled Cancer Diagnostics Market insights. See full methodology.
|
Market Scope |
|
|
Report Coverage |
Details |
|
Page number |
170 |
|
Base year |
2023 |
|
Historic period |
2018-2022 |
|
Forecast period |
2024-2028 |
|
Growth momentum & CAGR |
Accelerate at a CAGR of 13.64% |
|
Market growth 2024-2028 |
USD 17744.5 million |
|
Market structure |
Fragmented |
|
YoY growth 2023-2024(%) |
11.73 |
|
Key countries |
US, Germany, Canada, China, and France |
|
Competitive landscape |
Leading Companies, Market Positioning of Companies, Competitive Strategies, and Industry Risks |
Research Analyst Overview
- The market is a dynamic and evolving landscape, driven by advancements in technology and the ongoing discovery of new biomarkers. One area of significant growth is the use of circulating tumor cells (CTCs) for diagnostics. CTCs, which originate from primary tumors and can circulate in the bloodstream, offer valuable insights into disease progression and treatment response. Another key area of focus is cytogenetic analysis, which involves the study of an individual's chromosomes to identify genetic abnormalities associated with cancer. This approach has led to the discovery of numerous prognostic markers, enabling more personalized treatment plans. False negative rates have long been a concern in cancer diagnostics, but advances in technology have led to improvements.
- Multiplex assays, molecular profiling, and RNA sequencing are just a few of the techniques being used to increase diagnostic accuracy. These methods allow for the simultaneous detection of multiple biomarkers, including protein biomarkers and predictive markers. Liquid biopsy, a minimally invasive diagnostic approach that uses a patient's blood or other bodily fluids, is also gaining popularity. This technique has been shown to be effective in detecting minimal residual disease and monitoring therapeutic response. Clinical validation is a crucial step in the development of new diagnostic tools and techniques. Early detection is a key goal, and diagnostic imaging, cancer screening, and mass spectrometry are among the technologies being used to improve sensitivity and specificity.
- The use of targeted therapy and regulatory approval are also significant factors in the market. Gene expression analysis, DNA sequencing, and next-generation sequencing are just a few of the techniques being used to identify mutations that can be targeted with specific therapies. Despite these advancements, challenges remain. False positive rates and diagnostic accuracy continue to be areas of focus, as does the need for regulatory approval and the development of cost-effective solutions. Overall, the market is a complex and dynamic field, driven by ongoing research and the pursuit of more accurate and effective diagnostic tools.
What are the Key Data Covered in this Cancer Diagnostics Market Research and Growth Report?
-
What is the expected growth of the Cancer Diagnostics Market between 2024 and 2028?
-
USD 17.74 billion, at a CAGR of 13.64%
-
-
What segmentation does the market report cover?
-
The report segmented by End-user (Hospitals and clinics and Diagnostic laboratories), Type (IVD, Imaging, and LDT), and Geography (North America, Europe, APAC, and Rest of World (ROW))
-
-
Which regions are analyzed in the report?
-
North America, Europe, APAC, and Rest of World (ROW)
-
-
What are the key growth drivers and market challenges?
-
High prevalence of cancer, High cost of developing companion diagnostics
-
-
Who are the major players in the Cancer Diagnostics Market?
-
Key Companies Abbott Laboratories, Agilent Technologies Inc., Astellas Pharma Inc., Becton Dickinson and Co., bioMerieux SA, Bristol Myers Squibb Co., Eli Lilly and Co., F. Hoffmann La Roche Ltd., General Electric Co., GlaxoSmithKline Plc, Hologic Inc., Illumina Inc., Merck KGaA, Myriad Genetics Inc., Novartis AG, Pfizer Inc., QIAGEN NV, Quest Diagnostics Inc., Siemens AG, and Thermo Fisher Scientific Inc.
-
Market Research Insights
- The market encompasses a range of technologies and techniques used to identify oncogenic mutations, chromosomal abnormalities, epigenetic modifications, and other indicators of genomic instability. Two key areas of innovation include advanced imaging techniques and molecular diagnostics. The integration of big data analytics, machine learning, and artificial intelligence in cancer diagnostics is revolutionizing the field.
- For instance, image analysis algorithms can now accurately detect tumors and assess their size and growth rate, while clinical decision support systems enable more precise treatment selection based on patient stratification and tumor heterogeneity. Sample preparation techniques, such as liquid biopsy technologies, facilitate the identification of cancer stem cells and drug resistance markers, further enhancing the diagnostic process. Despite these advancements, challenges remain, including tumor heterogeneity and the need for standardized data integration and clinical workflows. Nevertheless, the potential for improved disease monitoring, treatment selection, and patient outcomes continues to drive investment and innovation in cancer diagnostics.
We can help! Our analysts can customize this cancer diagnostics market research report to meet your requirements.
 RIA -
RIA - 
