Biosensors Market Analysis, Size, and Forecast 2026-2030: North America (US, Canada, and Mexico), Europe (Germany, UK, and France), APAC (China, Japan, and India), South America (Brazil and Argentina), Middle East and Africa (Saudi Arabia, UAE, and South Africa), and Rest of World (ROW)

Biosensors Market Analysis, Size, and Forecast 2026-2030:
North America (US, Canada, and Mexico), Europe (Germany, UK, and France), APAC (China, Japan, and India), South America (Brazil and Argentina), Middle East and Africa (Saudi Arabia, UAE, and South Africa), and Rest of World (ROW)

Published: Apr 2026 310 Pages SKU: IRTNTR71617

Market Overview at a Glance

$12.28 B
Market Opportunity
7.7%
CAGR 2025 - 2030
46.7%
North America Growth
$16.79 B
Wearable segment 2024

Biosensors Market Size 2026-2030

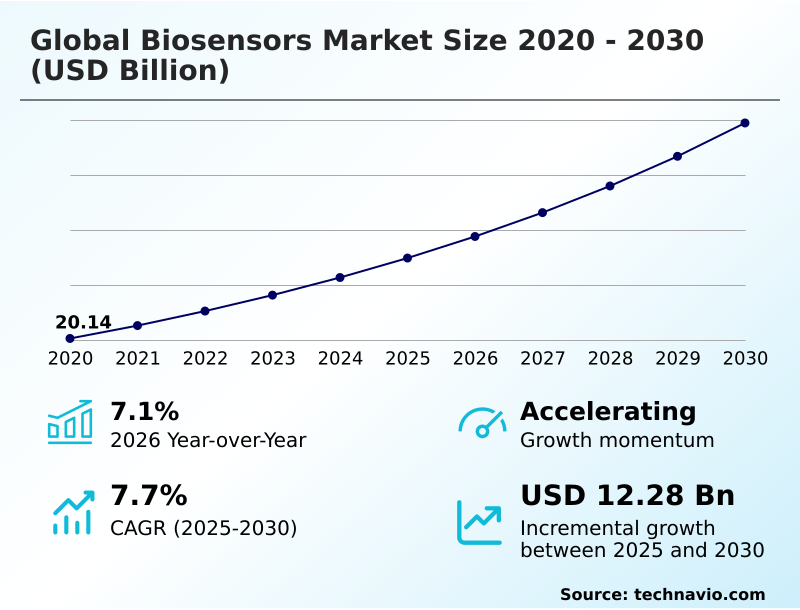
The biosensors market size is valued to increase by USD 12.28 billion, at a CAGR of 7.7% from 2025 to 2030. Increasing incidence of chronic and lifestyle-related diseases will drive the biosensors market.

Major Market Trends & Insights

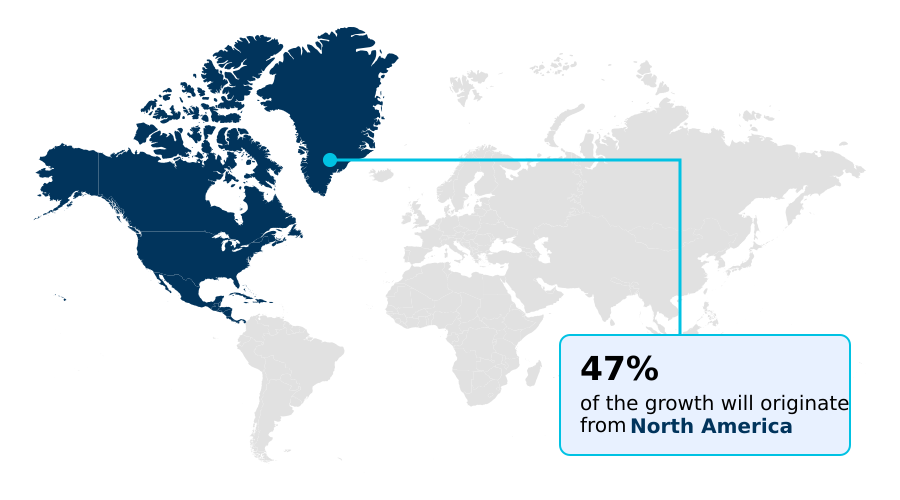
  • North America dominated the market and accounted for a 46.7% growth during the forecast period.
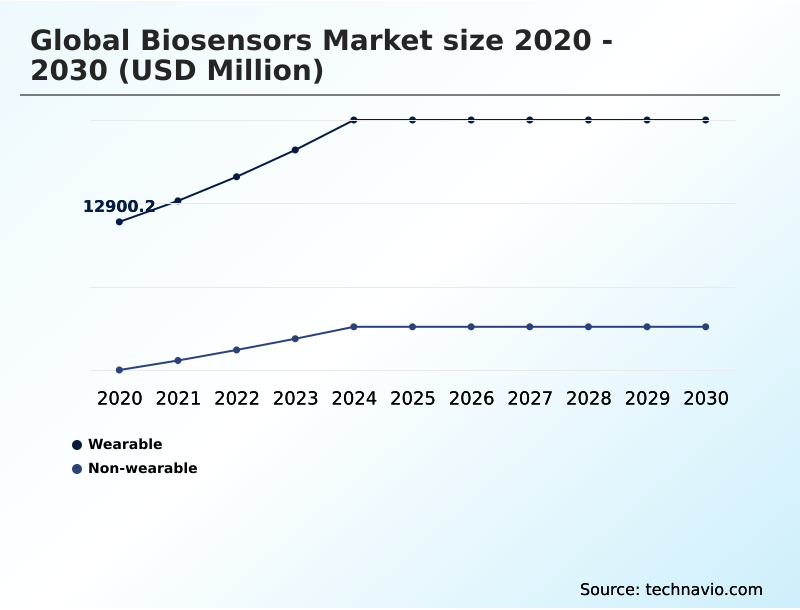
  • By Product - Wearable segment was valued at USD 16.79 billion in 2024
  • By Technology - Electrochemical segment accounted for the largest market revenue share in 2024

Market Size & Forecast

  • Market Opportunities: USD 19.59 billion
  • Market Future Opportunities: USD 12.28 billion
  • CAGR from 2025 to 2030 : 7.7%

Market Summary

  • The biosensors market is driven by the escalating need for rapid and precise analytical tools across healthcare and industrial sectors. Core to its function is the biological recognition element, which, when paired with a physicochemical transducer, enables highly specific analyte concentration measurement.
  • This capability is pivotal for point-of-care testing diagnostics, revolutionizing chronic disease management through devices for continuous glucose monitoring and non-invasive health tracking. For example, a hospital leveraging rapid infectious disease diagnostics can reduce patient wait times by 40%, optimizing bed turnover and clinical workflow.
  • Technological advancements in wearable sensor technology and microfluidic chip integration are further expanding applications into environmental pollutant detection and food safety, while ongoing research into synthetic biorecognition elements and label-free detection methods promises to overcome current limitations and broaden market reach.
  • The convergence of these factors creates a dynamic landscape where innovation directly translates to improved health outcomes and operational efficiencies.

What will be the Size of the Biosensors Market during the forecast period?

Get Key Insights on Market Forecast (PDF) Request Free Sample

How is the Biosensors Market Segmented?

The biosensors industry research report provides comprehensive data (region-wise segment analysis), with forecasts and estimates in "USD million" for the period 2026-2030, as well as historical data from 2020-2024 for the following segments.

  • Product
    • Wearable
    • Non-wearable
  • Technology
    • Electrochemical
    • Optical
    • Piezoelectric
    • Thermal
  • End-user
    • PoC testing
    • Home healthcare diagnostics
    • Research laboratories
    • Security and bio-defense
    • Food industry
  • Geography
    • North America
      • US
      • Canada
      • Mexico
    • Europe
      • Germany
      • UK
      • France
    • APAC
      • China
      • Japan
      • India
    • South America
      • Brazil
      • Argentina
    • Middle East and Africa
      • Saudi Arabia
      • UAE
      • South Africa
    • Rest of World (ROW)

By Product Insights

The wearable segment is estimated to witness significant growth during the forecast period.

The wearable segment is defined by devices enabling continuous and non-invasive health tracking. Central to this segment is wearable sensor technology that facilitates in-vivo physiological monitoring, with applications like continuous glucose monitoring driving significant adoption.

The shift toward proactive health management is a primary catalyst, supported by seamless wireless data transmission protocols connecting to remote patient monitoring systems.

Innovations focus on enhancing user experience through biocompatible device materials and improving data fidelity, with some platforms achieving a 15% reduction in signal noise through advanced algorithms.

Success hinges on balancing sophisticated functionality with user-friendly design, ensuring data security and delivering actionable health insights.

Request Free Sample

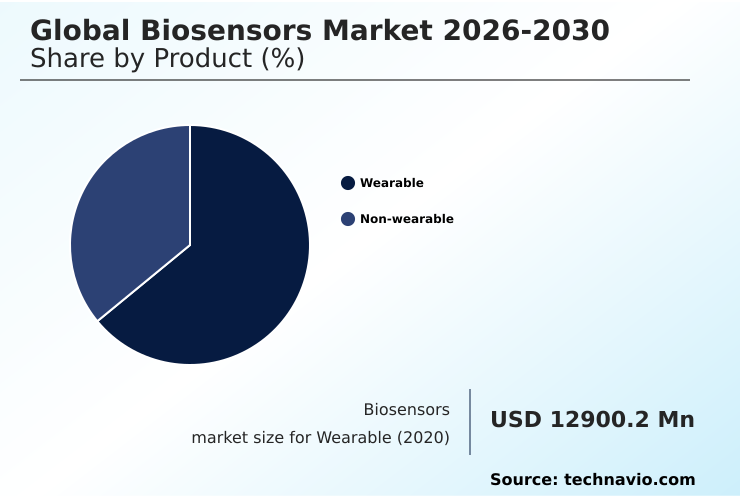
The Wearable segment was valued at USD 16.79 billion in 2024 and showed a gradual increase during the forecast period.

Request Free Sample

Regional Analysis

North America is estimated to contribute 46.7% to the growth of the global market during the forecast period.Technavio’s analysts have elaborately explained the regional trends and drivers that shape the market during the forecast period.

See How Biosensors Market Demand is Rising in North America Request Free Sample

The geographic landscape of the biosensors market is characterized by mature, high-value demand in North America and rapid expansion in the APAC region.

North America continues to lead, accounting for over 46% of the market's incremental growth, driven by advanced healthcare infrastructure and high adoption rates for point-of-care testing diagnostics.

In Europe, a strong focus on healthcare efficiency and environmental standards supports demand for agricultural quality control and environmental pollutant detection.

Meanwhile, the APAC region's fast-growing healthcare sector is accelerating the uptake of rapid infectious disease diagnostics, with some national programs achieving a 20% improvement in diagnostic access for rural populations.

The integration of digital health ecosystems is a global phenomenon, with biodefense threat agent detection remaining a priority for government-funded initiatives worldwide, influencing regional development and investment.

Market Dynamics

Our researchers analyzed the data with 2025 as the base year, along with the key drivers, trends, and challenges. A holistic analysis of drivers will help companies refine their marketing strategies to gain a competitive advantage.

  • Strategic decision-making in the biosensors market requires a deep understanding of evolving technological and application-specific nuances. Evaluating electrochemical vs optical biosensor performance is critical for product development, as is addressing the challenges in implantable biosensor longevity to meet long-term clinical needs.
  • The role of biosensors in personalized medicine is expanding, driven by the nanotechnology impact on biosensor sensitivity, which enables earlier disease detection. In parallel, biosensor applications in food safety testing are becoming standard practice. For healthcare providers, point-of-care diagnostics for cardiac biomarkers are improving emergency room efficiency.
  • Research-intensive sectors increasingly rely on label-free detection using surface plasmon resonance and piezoelectric biosensors for viral pathogen detection. The industry is also focused on overcoming sample matrix effects in biosensors and developing cost-effective biosensor manufacturing techniques. Key growth areas include real-time environmental monitoring with biosensors and tools for detecting biological warfare agents.
  • The successful integration of biosensors with internet of things platforms is creating new service models. Future innovation will depend on advancements in multiplexed biosensors for infectious disease panels, thermal biosensors for metabolic activity monitoring, and improved bioreceptor immobilization techniques for stability.
  • As companies navigate the complex regulatory pathways for biosensor-based medical devices, the development of synthetic antibodies in biosensor development and the use of microfluidics for high-throughput biosensor assays will be crucial for maintaining a competitive edge.

What are the key market drivers leading to the rise in the adoption of Biosensors Industry?

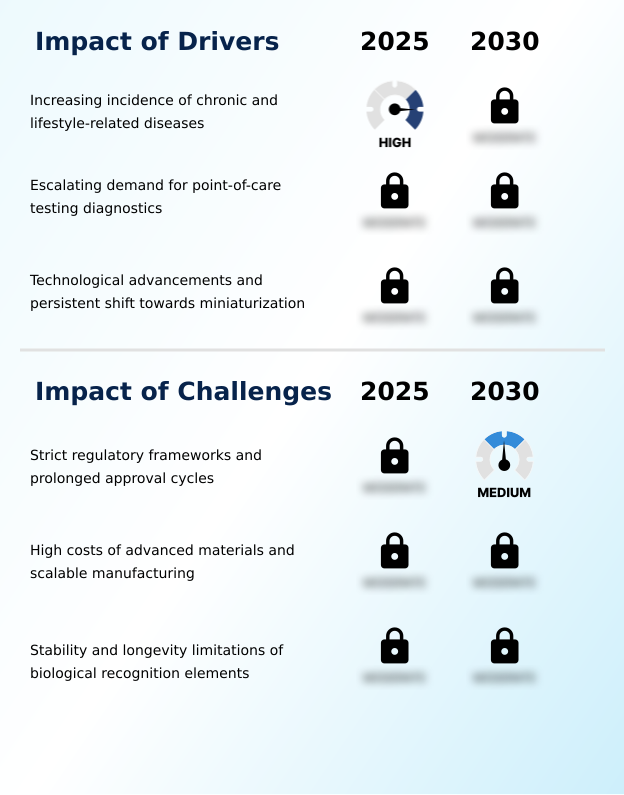
  • The increasing global incidence of chronic and lifestyle-related diseases is a key driver fueling the growth of the biosensors market.

  • Technological advancement is a primary market driver, particularly in miniaturization and material science. The refinement of electrochemical biosensors through advanced material integration, including the use of nanomaterial-based sensors, has enhanced sensitivity by over 25% in certain critical applications.
  • This innovation supports the broader demand for high-performance miniaturized diagnostic devices suitable for point-of-care settings. Furthermore, progress in microfluidic chip integration is enabling the development of sophisticated high-throughput screening assays and in-line process monitoring tools.
  • These platforms have achieved more than a 50% reduction in sample volume requirements, making complex analyses more cost-effective and accessible, thereby fueling adoption across both clinical and industrial sectors.

What are the market trends shaping the Biosensors Industry?

  • The advancement of integrated digital health ecosystems is an influential market trend. This development is reshaping expectations for performance and interoperability in biosensing technologies.

  • Key market trends are centered on enhancing performance and sustainability. The development of multifunctional sensing platforms and optical biosensing platforms is enabling more comprehensive diagnostics from a single test, with some integrated systems improving analytical throughput by up to 30%. This trend toward multiparametric analysis tools is complemented by a push for label-free detection methods that simplify workflows.
  • Concurrently, there is a significant movement towards sustainability, focusing on eco-efficient production design and the use of biodegradable sensor substrates, which can reduce material waste by over 15%. This emphasis on sustainable manufacturing processes is reshaping innovation, driving research into novel materials and more efficient multiplexed analyte analysis techniques across the industry.

What challenges does the Biosensors Industry face during its growth?

  • Strict regulatory frameworks and prolonged approval cycles present a significant challenge affecting the biosensors market's growth and innovation pace.

  • Persistent technical challenges constrain market potential, primarily related to the stability of the biological recognition element. Issues such as sensor surface biofouling and the complexities of bioreceptor immobilization can lead to signal drift, with some devices showing a 10% decline in accuracy over their operational lifespan without recalibration. This limits long-term sensor stability, a critical factor for continuous monitoring applications.
  • High material and fabrication costs also present a hurdle. Navigating the intricate regulatory pathways for biosensor-based medical devices further complicates commercialization, often extending development timelines by up to 3 years. Efforts to develop more robust synthetic biorecognition elements and biomimetic sensor surfaces are underway to address these core limitations.

Exclusive Technavio Analysis on Customer Landscape

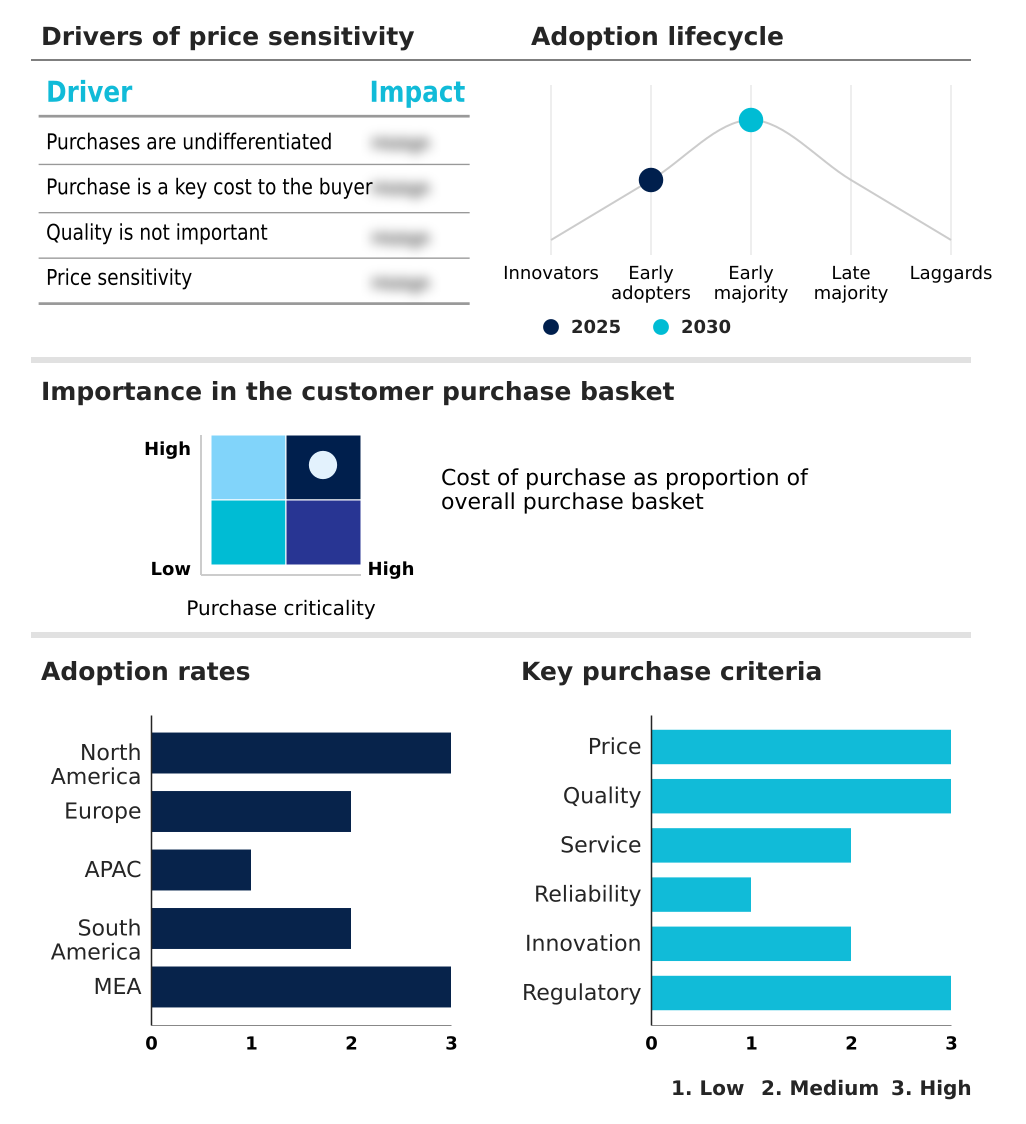
The biosensors market forecasting report includes the adoption lifecycle of the market, covering from the innovator’s stage to the laggard’s stage. It focuses on adoption rates in different regions based on penetration. Furthermore, the biosensors market report also includes key purchase criteria and drivers of price sensitivity to help companies evaluate and develop their market growth analysis strategies.

Customer Landscape of Biosensors Industry

Competitive Landscape

Companies are implementing various strategies, such as strategic alliances, biosensors market forecast, partnerships, mergers and acquisitions, geographical expansion, and product/service launches, to enhance their presence in the industry.

Abbott Laboratories - Advanced biosensor solutions are driving innovation in continuous glucose monitoring and point-of-care diagnostics, enhancing real-time patient data analysis.

The industry research and growth report includes detailed analyses of the competitive landscape of the market and information about key companies, including:

  • Abbott Laboratories
  • ACON Laboratories Inc.
  • Agamatrix Inc.
  • Ascensia Diabetes Care Holdings AG
  • Bio Rad Laboratories Inc.
  • Biolin Scientific AB
  • Conductive Technologies Inc.
  • Cytiva
  • Dexcom Inc.
  • F. Hoffmann La Roche Ltd.
  • LifeScan IP Holdings LLC
  • Medtronic Plc
  • Nova Biomedical Corp.
  • Sartorius AG
  • Sd Biosensor Inc.
  • Siemens Healthineers AG
  • Universal Biosensors Group
  • Xylem Inc.
  • Zimmer and Peacock

Qualitative and quantitative analysis of companies has been conducted to help clients understand the wider business environment as well as the strengths and weaknesses of key industry players. Data is qualitatively analyzed to categorize companies as pure play, category-focused, industry-focused, and diversified; it is quantitatively analyzed to categorize companies as dominant, leading, strong, tentative, and weak.

Recent Development and News in Biosensors market

  • In March, 2025, Dexcom Inc. announced a collaboration with Life Time to offer its Stelo glucose biosensor system to members, marking an expansion from clinical management to the broader wellness sector.
  • In April, 2025, Siemens Healthineers AG announced a strategic expansion, breaking ground on a new research and production facility in Shenzhen and detailing plans to launch approximately twenty new locally manufactured products in China.
  • In April, 2025, iolinq secured $100 million in a Series C funding round led by Alpha Wave Ventures to support the US regulatory approval and launch of its autonomous intradermal glucose sensor.
  • In May, 2025, Cytiva announced a strategic collaboration with Nuclera to integrate Nuclera's eProtein Discovery System with Cytiva's Biacore SPR technology, aiming to accelerate drug research and development workflows.

Dive into Technavio’s robust research methodology, blending expert interviews, extensive data synthesis, and validated models for unparalleled Biosensors Market insights. See full methodology.

Market Scope
Page number 310
Base year 2025
Historic period 2020-2024
Forecast period 2026-2030
Growth momentum & CAGR Accelerate at a CAGR of 7.7%
Market growth 2026-2030 USD 12281.6 million
Market structure Fragmented
YoY growth 2025-2026(%) 7.1%
Key countries US, Canada, Mexico, Germany, UK, France, Italy, Spain, The Netherlands, China, Japan, India, South Korea, Australia, Indonesia, Brazil, Argentina, Chile, Saudi Arabia, UAE, South Africa, Israel and Turkey
Competitive landscape Leading Companies, Market Positioning of Companies, Competitive Strategies, and Industry Risks

Request Free Sample

Research Analyst Overview

  • The biosensors market is underpinned by a diverse technology base, with electrochemical biosensors and optical biosensing platforms leading adoption. These systems rely on a biological recognition element and a physicochemical transducer for analyte concentration measurement, with performance defined by diagnostic sensitivity and specificity.
  • Key technologies such as surface plasmon resonance (SPR), biolayer interferometry (BLI), and quartz crystal microbalance (QCM) enable real-time kinetic analysis and label-free detection methods, critical for biomarker discovery and validation. In healthcare, this translates to advanced point-of-care testing diagnostics and continuous glucose monitoring.
  • Innovation is driven by nanomaterial-based sensors and microfluidic chip integration, enhancing in-vivo physiological monitoring in both wearable sensor technology and implantable biosensor devices. Progress in bioreceptor immobilization is key to mitigating sensor surface biofouling. Applications are expanding beyond medicine to include environmental pollutant detection, food pathogen identification, and bioprocess control systems.
  • Boardroom decisions are increasingly influenced by the potential of these technologies, as an investment in a multiplexed immunosensor assay platform or nucleic acid hybridization tools can reduce diagnostic timelines by 30%. Further advancements in enzyme-based biosensors, antibody-antigen interaction studies, and various transduction methods—including amperometric, potentiometric, and conductometric—are crucial.

What are the Key Data Covered in this Biosensors Market Research and Growth Report?

  • What is the expected growth of the Biosensors Market between 2026 and 2030?

    • USD 12.28 billion, at a CAGR of 7.7%

  • What segmentation does the market report cover?

    • The report is segmented by Product (Wearable, and Non-wearable), Technology (Electrochemical, Optical, Piezoelectric, and Thermal), End-user (PoC testing, Home healthcare diagnostics, Research laboratories, Security and bio-defense, and Food industry) and Geography (North America, Europe, APAC, South America, Middle East and Africa)

  • Which regions are analyzed in the report?

    • North America, Europe, APAC, South America and Middle East and Africa

  • What are the key growth drivers and market challenges?

    • Increasing incidence of chronic and lifestyle-related diseases, Strict regulatory frameworks and prolonged approval cycles

  • Who are the major players in the Biosensors Market?

    • Abbott Laboratories, ACON Laboratories Inc., Agamatrix Inc., Ascensia Diabetes Care Holdings AG, Bio Rad Laboratories Inc., Biolin Scientific AB, Conductive Technologies Inc., Cytiva, Dexcom Inc., F. Hoffmann La Roche Ltd., LifeScan IP Holdings LLC, Medtronic Plc, Nova Biomedical Corp., Sartorius AG, Sd Biosensor Inc., Siemens Healthineers AG, Universal Biosensors Group, Xylem Inc. and Zimmer and Peacock

Market Research Insights

  • Market dynamics are shaped by a push towards decentralization, where the adoption of remote patient monitoring systems has increased by over 30% in certain clinical areas. This shift is enabled by miniaturized diagnostic devices and robust wireless data transmission protocols. The integration with digital health ecosystems allows for sophisticated, cloud-based data analytics, transforming raw data into actionable insights for preventative care.
  • For instance, facilities using these integrated systems report a 15% reduction in unnecessary follow-up appointments. The demand for rapid infectious disease diagnostics and high-throughput screening assays continues to drive innovation, while customizable sensor arrays are meeting specialized needs in research and industrial settings, highlighting a market that values both accessibility and performance.

We can help! Our analysts can customize this biosensors market research report to meet your requirements.

Get in touch

1. Executive Summary

1.1 Market overview

Executive Summary - Chart on Market Overview
Executive Summary - Data Table on Market Overview
Executive Summary - Chart on Global Market Characteristics
Executive Summary - Chart on Market by Geography
Executive Summary - Chart on Market Segmentation by Product
Executive Summary - Chart on Market Segmentation by Technology
Executive Summary - Chart on Market Segmentation by End-user
Executive Summary - Chart on Incremental Growth
Executive Summary - Data Table on Incremental Growth
Executive Summary - Chart on Company Market Positioning

2. Technavio Analysis

2.1 Analysis of price sensitivity, lifecycle, customer purchase basket, adoption rates, and purchase criteria

2.2 Criticality of inputs and Factors of differentiation

Chart on Overview on criticality of inputs and factors of differentiation

2.3 Factors of disruption

Chart on Overview on factors of disruption

2.4 Impact of drivers and challenges

Chart on Impact of drivers and challenges in 2025 and 2030

3. Market Landscape

3.1 Market ecosystem

Chart on Parent Market
Data Table on - Parent Market

3.2 Market characteristics

Chart on Market characteristics analysis

3.3 Value chain analysis

Chart on Value chain analysis

4. Market Sizing

4.1 Market definition

Data Table on Offerings of companies included in the market definition

4.2 Market segment analysis

Market segments

4.3 Market size 2025

4.4 Market outlook: Forecast for 2025-2030

Chart on Global - Market size and forecast 2025-2030 ($ million)
Data Table on Global - Market size and forecast 2025-2030 ($ million)
Chart on Global Market: Year-over-year growth 2025-2030 (%)
Data Table on Global Market: Year-over-year growth 2025-2030 (%)

5. Historic Market Size

5.1 Global Biosensors Market 2020 - 2024

Historic Market Size - Data Table on Global Biosensors Market 2020 - 2024 ($ million)

5.2 Product segment analysis 2020 - 2024

Historic Market Size - Product Segment 2020 - 2024 ($ million)

5.3 Technology segment analysis 2020 - 2024

Historic Market Size - Technology Segment 2020 - 2024 ($ million)

5.4 End-user segment analysis 2020 - 2024

Historic Market Size - End-user Segment 2020 - 2024 ($ million)

5.5 Geography segment analysis 2020 - 2024

Historic Market Size - Geography Segment 2020 - 2024 ($ million)

5.6 Country segment analysis 2020 - 2024

Historic Market Size - Country Segment 2020 - 2024 ($ million)

6. Qualitative Analysis

6.1 Impact of AI on global biosensors market

6.2 Impact of geopolitical conflicts on global biosensors market

7. Five Forces Analysis

7.1 Five forces summary

Five forces analysis - Comparison between 2025 and 2030

7.2 Bargaining power of buyers

Bargaining power of buyers - Impact of key factors 2025 and 2030

7.3 Bargaining power of suppliers

Bargaining power of suppliers - Impact of key factors in 2025 and 2030

7.4 Threat of new entrants

Threat of new entrants - Impact of key factors in 2025 and 2030

7.5 Threat of substitutes

Threat of substitutes - Impact of key factors in 2025 and 2030

7.6 Threat of rivalry

Threat of rivalry - Impact of key factors in 2025 and 2030

7.7 Market condition

Chart on Market condition - Five forces 2025 and 2030

8. Market Segmentation by Product

8.1 Market segments

Chart on Product - Market share 2025-2030 (%)
Data Table on Product - Market share 2025-2030 (%)

8.2 Comparison by Product

Chart on Comparison by Product
Data Table on Comparison by Product

8.3 Wearable - Market size and forecast 2025-2030

Chart on Wearable - Market size and forecast 2025-2030 ($ million)
Data Table on Wearable - Market size and forecast 2025-2030 ($ million)
Chart on Wearable - Year-over-year growth 2025-2030 (%)
Data Table on Wearable - Year-over-year growth 2025-2030 (%)

8.4 Non-wearable - Market size and forecast 2025-2030

Chart on Non-wearable - Market size and forecast 2025-2030 ($ million)
Data Table on Non-wearable - Market size and forecast 2025-2030 ($ million)
Chart on Non-wearable - Year-over-year growth 2025-2030 (%)
Data Table on Non-wearable - Year-over-year growth 2025-2030 (%)

8.5 Market opportunity by Product

Market opportunity by Product ($ million)
Data Table on Market opportunity by Product ($ million)

9. Market Segmentation by Technology

9.1 Market segments

Chart on Technology - Market share 2025-2030 (%)
Data Table on Technology - Market share 2025-2030 (%)

9.2 Comparison by Technology

Chart on Comparison by Technology
Data Table on Comparison by Technology

9.3 Electrochemical - Market size and forecast 2025-2030

Chart on Electrochemical - Market size and forecast 2025-2030 ($ million)
Data Table on Electrochemical - Market size and forecast 2025-2030 ($ million)
Chart on Electrochemical - Year-over-year growth 2025-2030 (%)
Data Table on Electrochemical - Year-over-year growth 2025-2030 (%)

9.4 Optical - Market size and forecast 2025-2030

Chart on Optical - Market size and forecast 2025-2030 ($ million)
Data Table on Optical - Market size and forecast 2025-2030 ($ million)
Chart on Optical - Year-over-year growth 2025-2030 (%)
Data Table on Optical - Year-over-year growth 2025-2030 (%)

9.5 Piezoelectric - Market size and forecast 2025-2030

Chart on Piezoelectric - Market size and forecast 2025-2030 ($ million)
Data Table on Piezoelectric - Market size and forecast 2025-2030 ($ million)
Chart on Piezoelectric - Year-over-year growth 2025-2030 (%)
Data Table on Piezoelectric - Year-over-year growth 2025-2030 (%)

9.6 Thermal - Market size and forecast 2025-2030

Chart on Thermal - Market size and forecast 2025-2030 ($ million)
Data Table on Thermal - Market size and forecast 2025-2030 ($ million)
Chart on Thermal - Year-over-year growth 2025-2030 (%)
Data Table on Thermal - Year-over-year growth 2025-2030 (%)

9.7 Market opportunity by Technology

Market opportunity by Technology ($ million)
Data Table on Market opportunity by Technology ($ million)

10. Market Segmentation by End-user

10.1 Market segments

Chart on End-user - Market share 2025-2030 (%)
Data Table on End-user - Market share 2025-2030 (%)

10.2 Comparison by End-user

Chart on Comparison by End-user
Data Table on Comparison by End-user

10.3 PoC testing - Market size and forecast 2025-2030

Chart on PoC testing - Market size and forecast 2025-2030 ($ million)
Data Table on PoC testing - Market size and forecast 2025-2030 ($ million)
Chart on PoC testing - Year-over-year growth 2025-2030 (%)
Data Table on PoC testing - Year-over-year growth 2025-2030 (%)

10.4 Home healthcare diagnostics - Market size and forecast 2025-2030

Chart on Home healthcare diagnostics - Market size and forecast 2025-2030 ($ million)
Data Table on Home healthcare diagnostics - Market size and forecast 2025-2030 ($ million)
Chart on Home healthcare diagnostics - Year-over-year growth 2025-2030 (%)
Data Table on Home healthcare diagnostics - Year-over-year growth 2025-2030 (%)

10.5 Research laboratories - Market size and forecast 2025-2030

Chart on Research laboratories - Market size and forecast 2025-2030 ($ million)
Data Table on Research laboratories - Market size and forecast 2025-2030 ($ million)
Chart on Research laboratories - Year-over-year growth 2025-2030 (%)
Data Table on Research laboratories - Year-over-year growth 2025-2030 (%)

10.6 Security and bio-defense - Market size and forecast 2025-2030

Chart on Security and bio-defense - Market size and forecast 2025-2030 ($ million)
Data Table on Security and bio-defense - Market size and forecast 2025-2030 ($ million)
Chart on Security and bio-defense - Year-over-year growth 2025-2030 (%)
Data Table on Security and bio-defense - Year-over-year growth 2025-2030 (%)

10.7 Food industry - Market size and forecast 2025-2030

Chart on Food industry - Market size and forecast 2025-2030 ($ million)
Data Table on Food industry - Market size and forecast 2025-2030 ($ million)
Chart on Food industry - Year-over-year growth 2025-2030 (%)
Data Table on Food industry - Year-over-year growth 2025-2030 (%)

10.8 Market opportunity by End-user

Market opportunity by End-user ($ million)
Data Table on Market opportunity by End-user ($ million)

11. Customer Landscape

11.1 Customer landscape overview

Analysis of price sensitivity, lifecycle, customer purchase basket, adoption rates, and purchase criteria

12. Geographic Landscape

12.1 Geographic segmentation

Chart on Market share by geography 2025-2030 (%)
Data Table on Market share by geography 2025-2030 (%)

12.2 Geographic comparison

Chart on Geographic comparison
Data Table on Geographic comparison

12.3 North America - Market size and forecast 2025-2030

Chart on North America - Market size and forecast 2025-2030 ($ million)
Data Table on North America - Market size and forecast 2025-2030 ($ million)
Chart on North America - Year-over-year growth 2025-2030 (%)
Data Table on North America - Year-over-year growth 2025-2030 (%)
Chart on Regional Comparison - North America
Data Table on Regional Comparison - North America

12.3.1 US - Market size and forecast 2025-2030

Chart on US - Market size and forecast 2025-2030 ($ million)
Data Table on US - Market size and forecast 2025-2030 ($ million)
Chart on US - Year-over-year growth 2025-2030 (%)
Data Table on US - Year-over-year growth 2025-2030 (%)

12.3.2 Canada - Market size and forecast 2025-2030

Chart on Canada - Market size and forecast 2025-2030 ($ million)
Data Table on Canada - Market size and forecast 2025-2030 ($ million)
Chart on Canada - Year-over-year growth 2025-2030 (%)
Data Table on Canada - Year-over-year growth 2025-2030 (%)

12.3.3 Mexico - Market size and forecast 2025-2030

Chart on Mexico - Market size and forecast 2025-2030 ($ million)
Data Table on Mexico - Market size and forecast 2025-2030 ($ million)
Chart on Mexico - Year-over-year growth 2025-2030 (%)
Data Table on Mexico - Year-over-year growth 2025-2030 (%)

12.4 Europe - Market size and forecast 2025-2030

Chart on Europe - Market size and forecast 2025-2030 ($ million)
Data Table on Europe - Market size and forecast 2025-2030 ($ million)
Chart on Europe - Year-over-year growth 2025-2030 (%)
Data Table on Europe - Year-over-year growth 2025-2030 (%)
Chart on Regional Comparison - Europe
Data Table on Regional Comparison - Europe

12.4.1 Germany - Market size and forecast 2025-2030

Chart on Germany - Market size and forecast 2025-2030 ($ million)
Data Table on Germany - Market size and forecast 2025-2030 ($ million)
Chart on Germany - Year-over-year growth 2025-2030 (%)
Data Table on Germany - Year-over-year growth 2025-2030 (%)

12.4.2 UK - Market size and forecast 2025-2030

Chart on UK - Market size and forecast 2025-2030 ($ million)
Data Table on UK - Market size and forecast 2025-2030 ($ million)
Chart on UK - Year-over-year growth 2025-2030 (%)
Data Table on UK - Year-over-year growth 2025-2030 (%)

12.4.3 France - Market size and forecast 2025-2030

Chart on France - Market size and forecast 2025-2030 ($ million)
Data Table on France - Market size and forecast 2025-2030 ($ million)
Chart on France - Year-over-year growth 2025-2030 (%)
Data Table on France - Year-over-year growth 2025-2030 (%)

12.4.4 Italy - Market size and forecast 2025-2030

Chart on Italy - Market size and forecast 2025-2030 ($ million)
Data Table on Italy - Market size and forecast 2025-2030 ($ million)
Chart on Italy - Year-over-year growth 2025-2030 (%)
Data Table on Italy - Year-over-year growth 2025-2030 (%)

12.4.5 Spain - Market size and forecast 2025-2030

Chart on Spain - Market size and forecast 2025-2030 ($ million)
Data Table on Spain - Market size and forecast 2025-2030 ($ million)
Chart on Spain - Year-over-year growth 2025-2030 (%)
Data Table on Spain - Year-over-year growth 2025-2030 (%)

12.4.6 The Netherlands - Market size and forecast 2025-2030

Chart on The Netherlands - Market size and forecast 2025-2030 ($ million)
Data Table on The Netherlands - Market size and forecast 2025-2030 ($ million)
Chart on The Netherlands - Year-over-year growth 2025-2030 (%)
Data Table on The Netherlands - Year-over-year growth 2025-2030 (%)

12.5 APAC - Market size and forecast 2025-2030

Chart on APAC - Market size and forecast 2025-2030 ($ million)
Data Table on APAC - Market size and forecast 2025-2030 ($ million)
Chart on APAC - Year-over-year growth 2025-2030 (%)
Data Table on APAC - Year-over-year growth 2025-2030 (%)
Chart on Regional Comparison - APAC
Data Table on Regional Comparison - APAC

12.5.1 China - Market size and forecast 2025-2030

Chart on China - Market size and forecast 2025-2030 ($ million)
Data Table on China - Market size and forecast 2025-2030 ($ million)
Chart on China - Year-over-year growth 2025-2030 (%)
Data Table on China - Year-over-year growth 2025-2030 (%)

12.5.2 Japan - Market size and forecast 2025-2030

Chart on Japan - Market size and forecast 2025-2030 ($ million)
Data Table on Japan - Market size and forecast 2025-2030 ($ million)
Chart on Japan - Year-over-year growth 2025-2030 (%)
Data Table on Japan - Year-over-year growth 2025-2030 (%)

12.5.3 India - Market size and forecast 2025-2030

Chart on India - Market size and forecast 2025-2030 ($ million)
Data Table on India - Market size and forecast 2025-2030 ($ million)
Chart on India - Year-over-year growth 2025-2030 (%)
Data Table on India - Year-over-year growth 2025-2030 (%)

12.5.4 South Korea - Market size and forecast 2025-2030

Chart on South Korea - Market size and forecast 2025-2030 ($ million)
Data Table on South Korea - Market size and forecast 2025-2030 ($ million)
Chart on South Korea - Year-over-year growth 2025-2030 (%)
Data Table on South Korea - Year-over-year growth 2025-2030 (%)

12.5.5 Australia - Market size and forecast 2025-2030

Chart on Australia - Market size and forecast 2025-2030 ($ million)
Data Table on Australia - Market size and forecast 2025-2030 ($ million)
Chart on Australia - Year-over-year growth 2025-2030 (%)
Data Table on Australia - Year-over-year growth 2025-2030 (%)

12.5.6 Indonesia - Market size and forecast 2025-2030

Chart on Indonesia - Market size and forecast 2025-2030 ($ million)
Data Table on Indonesia - Market size and forecast 2025-2030 ($ million)
Chart on Indonesia - Year-over-year growth 2025-2030 (%)
Data Table on Indonesia - Year-over-year growth 2025-2030 (%)

12.6 South America - Market size and forecast 2025-2030

Chart on South America - Market size and forecast 2025-2030 ($ million)
Data Table on South America - Market size and forecast 2025-2030 ($ million)
Chart on South America - Year-over-year growth 2025-2030 (%)
Data Table on South America - Year-over-year growth 2025-2030 (%)
Chart on Regional Comparison - South America
Data Table on Regional Comparison - South America

12.6.1 Brazil - Market size and forecast 2025-2030

Chart on Brazil - Market size and forecast 2025-2030 ($ million)
Data Table on Brazil - Market size and forecast 2025-2030 ($ million)
Chart on Brazil - Year-over-year growth 2025-2030 (%)
Data Table on Brazil - Year-over-year growth 2025-2030 (%)

12.6.2 Argentina - Market size and forecast 2025-2030

Chart on Argentina - Market size and forecast 2025-2030 ($ million)
Data Table on Argentina - Market size and forecast 2025-2030 ($ million)
Chart on Argentina - Year-over-year growth 2025-2030 (%)
Data Table on Argentina - Year-over-year growth 2025-2030 (%)

12.6.3 Chile - Market size and forecast 2025-2030

Chart on Chile - Market size and forecast 2025-2030 ($ million)
Data Table on Chile - Market size and forecast 2025-2030 ($ million)
Chart on Chile - Year-over-year growth 2025-2030 (%)
Data Table on Chile - Year-over-year growth 2025-2030 (%)

12.7 Middle East and Africa - Market size and forecast 2025-2030

Chart on Middle East and Africa - Market size and forecast 2025-2030 ($ million)
Data Table on Middle East and Africa - Market size and forecast 2025-2030 ($ million)
Chart on Middle East and Africa - Year-over-year growth 2025-2030 (%)
Data Table on Middle East and Africa - Year-over-year growth 2025-2030 (%)
Chart on Regional Comparison - Middle East and Africa
Data Table on Regional Comparison - Middle East and Africa

12.7.1 Saudi Arabia - Market size and forecast 2025-2030

Chart on Saudi Arabia - Market size and forecast 2025-2030 ($ million)
Data Table on Saudi Arabia - Market size and forecast 2025-2030 ($ million)
Chart on Saudi Arabia - Year-over-year growth 2025-2030 (%)
Data Table on Saudi Arabia - Year-over-year growth 2025-2030 (%)

12.7.2 UAE - Market size and forecast 2025-2030

Chart on UAE - Market size and forecast 2025-2030 ($ million)
Data Table on UAE - Market size and forecast 2025-2030 ($ million)
Chart on UAE - Year-over-year growth 2025-2030 (%)
Data Table on UAE - Year-over-year growth 2025-2030 (%)

12.7.3 South Africa - Market size and forecast 2025-2030

Chart on South Africa - Market size and forecast 2025-2030 ($ million)
Data Table on South Africa - Market size and forecast 2025-2030 ($ million)
Chart on South Africa - Year-over-year growth 2025-2030 (%)
Data Table on South Africa - Year-over-year growth 2025-2030 (%)

12.7.4 Israel - Market size and forecast 2025-2030

Chart on Israel - Market size and forecast 2025-2030 ($ million)
Data Table on Israel - Market size and forecast 2025-2030 ($ million)
Chart on Israel - Year-over-year growth 2025-2030 (%)
Data Table on Israel - Year-over-year growth 2025-2030 (%)

12.7.5 Turkey - Market size and forecast 2025-2030

Chart on Turkey - Market size and forecast 2025-2030 ($ million)
Data Table on Turkey - Market size and forecast 2025-2030 ($ million)
Chart on Turkey - Year-over-year growth 2025-2030 (%)
Data Table on Turkey - Year-over-year growth 2025-2030 (%)

12.8 Market opportunity by geography

Market opportunity by geography ($ million)
Data Tables on Market opportunity by geography ($ million)

13. Drivers, Challenges, and Opportunity

13.1 Market drivers

Increasing incidence of chronic and lifestyle-related diseases
Escalating demand for point-of-care testing diagnostics
Technological advancements and persistent shift towards miniaturization

13.2 Market challenges

Strict regulatory frameworks and prolonged approval cycles
High costs of advanced materials and scalable manufacturing
Stability and longevity limitations of biological recognition elements

13.3 Impact of drivers and challenges

Impact of drivers and challenges in 2025 and 2030

13.4 Market opportunities

Advancement of integrated digital health ecosystems
Expansion of multiparametric and multifunctional biosensing platforms
Increasing emphasis on sustainable biosensor design and eco efficient production practices

14. Competitive Landscape

14.1 Overview

14.2

Overview on criticality of inputs and factors of differentiation

14.3 Landscape disruption

Overview on factors of disruption

14.4 Industry risks

Impact of key risks on business

15. Competitive Analysis

15.1 Companies profiled

Companies covered

15.2 Company ranking index

15.3 Market positioning of companies

Matrix on companies position and classification

15.4 Abbott Laboratories

Abbott Laboratories - Overview
Abbott Laboratories - Business segments
Abbott Laboratories - Key news
Abbott Laboratories - Key offerings
Abbott Laboratories - Segment focus
SWOT

15.5 ACON Laboratories Inc.

ACON Laboratories Inc. - Overview
ACON Laboratories Inc. - Product / Service
ACON Laboratories Inc. - Key offerings
SWOT

15.6 Agamatrix Inc.

Agamatrix Inc. - Overview
Agamatrix Inc. - Product / Service
Agamatrix Inc. - Key offerings
SWOT

15.7 Bio Rad Laboratories Inc.

Bio Rad Laboratories Inc. - Overview
Bio Rad Laboratories Inc. - Business segments
Bio Rad Laboratories Inc. - Key news
Bio Rad Laboratories Inc. - Key offerings
Bio Rad Laboratories Inc. - Segment focus
SWOT

15.8 Biolin Scientific AB

Biolin Scientific AB - Overview
Biolin Scientific AB - Product / Service
Biolin Scientific AB - Key offerings
SWOT

15.9 Conductive Technologies Inc.

Conductive Technologies Inc. - Overview
Conductive Technologies Inc. - Product / Service
Conductive Technologies Inc. - Key offerings
SWOT

15.10 Dexcom Inc.

Dexcom Inc. - Overview
Dexcom Inc. - Product / Service
Dexcom Inc. - Key news
Dexcom Inc. - Key offerings
SWOT

15.11 F. Hoffmann La Roche Ltd.

F. Hoffmann La Roche Ltd. - Overview
F. Hoffmann La Roche Ltd. - Business segments
F. Hoffmann La Roche Ltd. - Key news
F. Hoffmann La Roche Ltd. - Key offerings
F. Hoffmann La Roche Ltd. - Segment focus
SWOT

15.12 LifeScan IP Holdings LLC

LifeScan IP Holdings LLC - Overview
LifeScan IP Holdings LLC - Product / Service
LifeScan IP Holdings LLC - Key offerings
SWOT

15.13 Medtronic Plc

Medtronic Plc - Overview
Medtronic Plc - Business segments
Medtronic Plc - Key offerings
Medtronic Plc - Segment focus
SWOT

15.14 Nova Biomedical Corp.

Nova Biomedical Corp. - Overview
Nova Biomedical Corp. - Product / Service
Nova Biomedical Corp. - Key offerings
SWOT

15.15 Sartorius AG

Sartorius AG - Overview
Sartorius AG - Business segments
Sartorius AG - Key news
Sartorius AG - Key offerings
Sartorius AG - Segment focus
SWOT

15.16 Sd Biosensor Inc.

Sd Biosensor Inc. - Overview
Sd Biosensor Inc. - Product / Service
Sd Biosensor Inc. - Key offerings
SWOT

15.17 Siemens Healthineers AG

Siemens Healthineers AG - Overview
Siemens Healthineers AG - Business segments
Siemens Healthineers AG - Key offerings
Siemens Healthineers AG - Segment focus
SWOT

15.18 Xylem Inc.

Xylem Inc. - Overview
Xylem Inc. - Business segments
Xylem Inc. - Key news
Xylem Inc. - Key offerings
Xylem Inc. - Segment focus
SWOT

16. Appendix

16.1 Scope of the report

Market definition
Objectives
Notes and caveats

16.2 Inclusions and exclusions checklist

Inclusions checklist
Exclusions checklist

16.3 Currency conversion rates for US$

16.4 Research methodology

16.5 Data procurement

Information sources

16.6 Data validation

16.7 Validation techniques employed for market sizing

16.8 Data synthesis

16.9 360 degree market analysis

16.10 List of abbreviations

Research Methodology

Technavio presents a detailed picture of the market by way of study, synthesis, and summation of data from multiple sources. The analysts have presented the various facets of the market with a particular focus on identifying the key industry influencers. The data thus presented is comprehensive, reliable, and the result of extensive research, both primary and secondary.

INFORMATION SOURCES

Primary sources

  • Manufacturers and suppliers
  • Channel partners
  • Industry experts
  • Strategic decision makers

Secondary sources

  • Industry journals and periodicals
  • Government data
  • Financial reports of key industry players
  • Historical data
  • Press releases

DATA ANALYSIS

Data Synthesis

  • Collation of data
  • Estimation of key figures
  • Analysis of derived insights

Data Validation

  • Triangulation with data models
  • Reference against proprietary databases
  • Corroboration with industry experts

REPORT WRITING

Qualitative

  • Market drivers
  • Market challenges
  • Market trends
  • Five forces analysis

Quantitative

  • Market size and forecast
  • Market segmentation
  • Geographical insights
  • Competitive landscape

Interested in this report?

Get your sample now to see our research methodology and insights!

Download Now

Frequently Asked Questions

Biosensors market growth will increase by USD 12281.6 million during 2026-2030.

The Biosensors market is expected to grow at a CAGR of 7.7% during 2026-2030.

Biosensors market is segmented by Product (Wearable, Non-wearable) Technology (Electrochemical, Optical, Piezoelectric, Thermal) End-user (PoC testing, Home healthcare diagnostics, Research laboratories, Security and bio-defense, Food industry)

Abbott Laboratories, ACON Laboratories Inc., Agamatrix Inc., Ascensia Diabetes Care Holdings AG, Bio Rad Laboratories Inc., Biolin Scientific AB, Conductive Technologies Inc., Cytiva, Dexcom Inc., F. Hoffmann La Roche Ltd., LifeScan IP Holdings LLC, Medtronic Plc, Nova Biomedical Corp., Sartorius AG, Sd Biosensor Inc., Siemens Healthineers AG, Universal Biosensors Group, Xylem Inc., Zimmer and Peacock are a few of the key vendors in the Biosensors market.

North America will register the highest growth rate of 46.7% among the other regions. Therefore, the Biosensors market in North America is expected to garner significant business opportunities for the vendors during the forecast period.

US, Canada, Mexico, Germany, UK, France, Italy, Spain, The Netherlands, China, Japan, India, South Korea, Australia, Indonesia, Brazil, Argentina, Chile, Saudi Arabia, UAE, South Africa, Israel, Turkey

  • Increasing incidence of chronic and lifestyle-related diseases is the driving factor this market.

The Biosensors market vendors should focus on grabbing business opportunities from the Product segment as it accounted for the largest market share in the base year.
RIA - Research AI Assistant
Ask RIA