Synthetic Biology Market Size 2025-2029
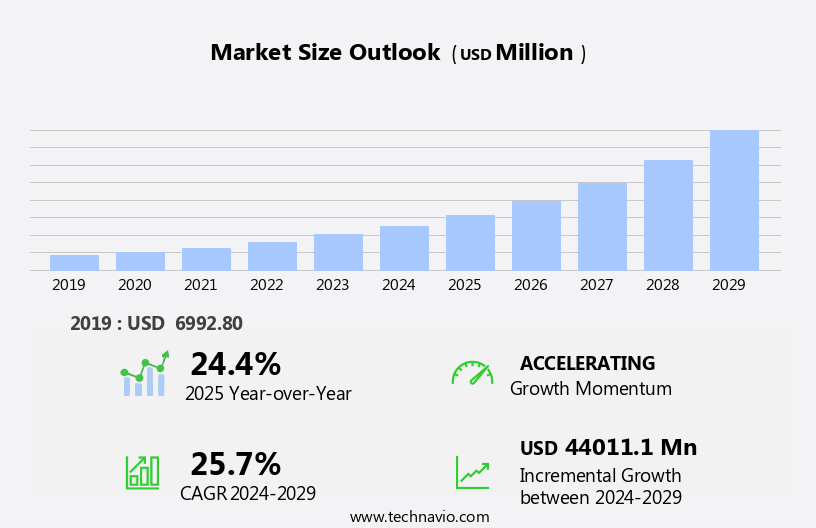
The synthetic biology market size is forecast to increase by USD 44.01 billion, at a CAGR of 25.7% between 2024 and 2029.
- Synthetic biology, an emerging field that combines engineering principles with biology, is experiencing significant growth driven by expanding applications across various industries. The market's adoption is fueled by its potential to revolutionize sectors such as healthcare, agriculture, and energy production. However, the regulatory landscape surrounding synthetic biology is evolving, presenting both opportunities and challenges. On the one hand, regulatory bodies are recognizing the potential benefits of synthetic biology and are developing frameworks to support its development and commercialization. On the other hand, technical challenges persist, including the need for standardization, scalability, and cost reduction.
- These challenges necessitate collaboration between industry, academia, and regulatory agencies to address complex issues and ensure the safe and effective implementation of synthetic biology technologies. Companies seeking to capitalize on this market's opportunities must navigate these regulatory and technical hurdles while staying informed of the latest developments and trends.
What will be the Size of the Synthetic Biology Market during the forecast period?

Explore in-depth regional segment analysis with market size data - historical 2019-2023 and forecasts 2025-2029 - in the full report.
Request Free Sample
Synthetic biology, a rapidly evolving field, continues to redefine industry boundaries with its innovative applications across various sectors. Synthetic biology platforms, such as phage display and cell-free systems, facilitate protein engineering and high-throughput screening, revolutionizing research and development in biotechnology. Data analytics and cost reduction strategies enable more efficient quality control, while personalized medicine and mRNA technology offer new avenues for healthcare. Advancements in DNA sequencing, yeast display, metabolic engineering, and predictive modeling contribute to the continuous unfolding of market activities. Downstream processing and automated workflow optimize production processes, while public perception and ethical considerations shape regulatory frameworks.
Directed evolution, next-generation sequencing (NGS), RNA interference (RNAi), genome editing, synthetic DNA, gene synthesis, transcription factors, enzyme engineering, and process optimization are integral components of this dynamic landscape. The ongoing integration of these technologies propels synthetic biology forward, shaping the future of drug discovery, bioprocess development, and systems biology. Environmental impact and sustainability are increasingly important considerations, driving the development of eco-friendly synthetic biology applications. As the field continues to evolve, it promises to deliver groundbreaking advancements and transform industries, from agriculture to energy and beyond.
How is this Synthetic Biology Industry segmented?
The synthetic biology industry research report provides comprehensive data (region-wise segment analysis), with forecasts and estimates in "USD million" for the period 2025-2029, as well as historical data from 2019-2023 for the following segments.
- Application
- Healthcare
- Industrial
- Food and agriculture
- Environmental Applications
- Consumer Care
- Energy/BiofuelsOthers
- Product
- Oligonucleotides
- Enzymes
- Cloning technology kits
- Xeno-nucleic acids
- Chassis organisms
- Synthetic Cells
- Synthetic DNA/Synthetic Genes
- Technology
- Gene Synthesis
- Genome Engineering
- Sequencing
- Bioinformatics
- Cloning
- Site-Directed Mutagenesis
- Measurement & Modeling
- Microfluidics
- Nanotechnology
- End-user
- Biotechnology and Pharmaceutical Companies
- Academic and Research Institutes
- Others
- Geography
- North America
- Europe
- Middle East and Africa
- APAC
- China
- India
- Japan
- South Korea
- Rest of World (ROW)
By Application Insights
The healthcare segment is estimated to witness significant growth during the forecast period.
The market is experiencing significant growth, particularly in the healthcare sector. Synthetic biology's engineered gene systems and molecular components are revolutionizing healthcare, offering potential cures for various health issues and enhancing medical treatment efficacy. Technological advancements, such as gene-editing tools, facilitate the application of synthetic biology in healthcare, expanding its clinical uses. These applications span diagnostics and treatments, with potential for creating molecularly engineered tissues, developing new medicines and vaccines, and designing innovative diagnostics. Furthermore, synthetic biology's impact extends to metabolic engineering, predictive modeling, and process optimization for drug discovery and bioprocess development. Ethical considerations and quality control are crucial aspects of the market, ensuring safety and reliability.
Intellectual property, data analytics, and cost reduction are essential drivers for market growth. Synthetic biology platforms, including phage display, cell-free systems, protein engineering, high-throughput screening, and yeast display, are transforming the industry. Gene regulation, gene expression, transcription factors, enzyme engineering, and RNA technology, such as mRNA and RNAi, are integral components of these platforms. Gene synthesis, genome editing, and synthetic DNA are also vital elements. The market's environmental impact is a growing concern, necessitating continuous process optimization and sustainability efforts.

Request Free Sample
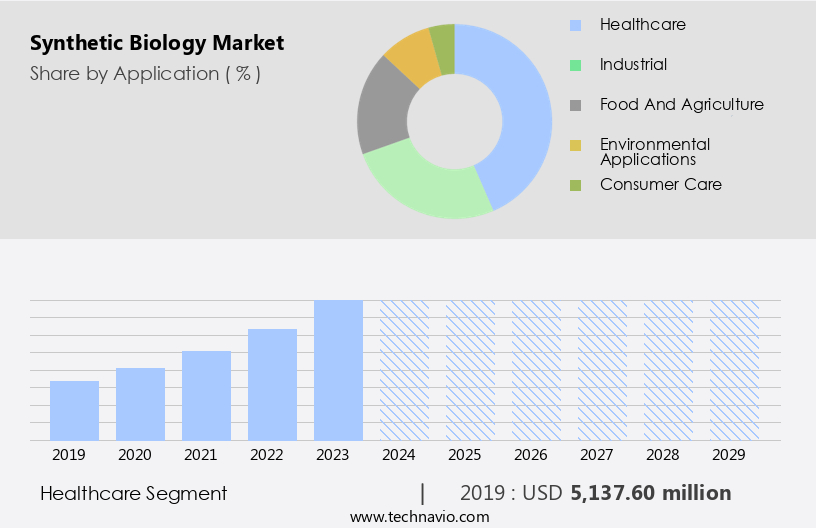
The Healthcare segment was valued at USD 5.14 billion in 2019 and showed a gradual increase during the forecast period.
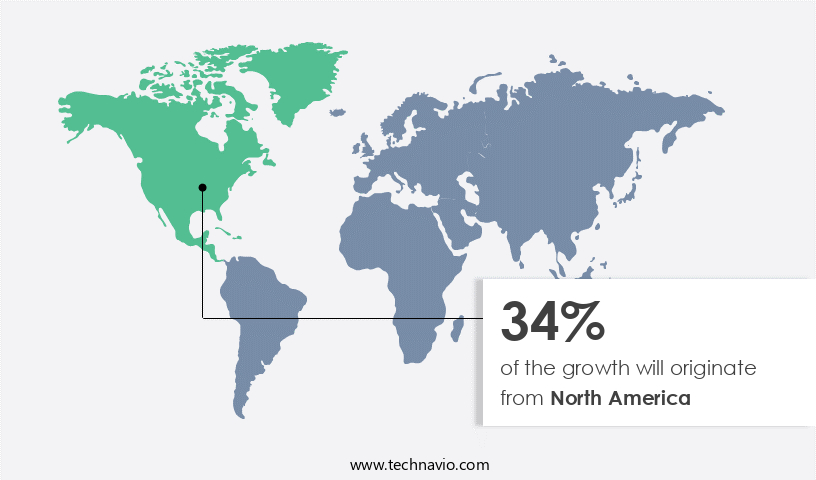
Regional Analysis
North America is estimated to contribute 34% to the growth of the global market during the forecast period. Technavio's analysts have elaborately explained the regional trends and drivers that shape the market during the forecast period.

Request Free Sample
Synthetic biology, a revolutionary field that combines engineering principles with biology, is experiencing significant growth in the US and Canada. Techniques such as phage display, cell-free systems, protein engineering, high-throughput screening, and gene regulation are at the forefront of this innovation. Quality control and ethical considerations are paramount in this industry, ensuring the responsible application of these advanced technologies. Intellectual property and data analytics play crucial roles in the market, with companies leveraging synthetic biology platforms to reduce costs and improve process optimization. Personalized medicine, mRNA technology, and next-generation sequencing are key areas of application, driving market expansion.
Metabolic engineering, predictive modeling, and downstream processing are essential components of the synthetic biology value chain, enhancing drug discovery and bioprocess development. The environmental impact of synthetic biology is a topic of ongoing discussion, with companies focusing on sustainability and eco-friendly practices. Transcription factors, enzyme engineering, and gene expression are critical elements in gene synthesis and genome editing, contributing to the advancement of this sector. Systems biology and automated workflow streamline research and development, enabling faster innovation. Prominent players in the US and Canadian market include Amyris Inc., Integrated DNA Technologies Inc., Genomatica Inc., GenScript Biotech Corp., and New England Biolabs Inc.
The market's growth is fueled by increased investments, rising research and development funding, and the increasing demand for bio-based products. These factors position synthetic biology as a significant contributor to the US and Canadian economies.
Market Dynamics
Our researchers analyzed the data with 2024 as the base year, along with the key drivers, trends, and challenges. A holistic analysis of drivers will help companies refine their marketing strategies to gain a competitive advantage.
In the dynamic and innovative realm of synthetic biology, companies are harnessing the power of genetic engineering and biotechnology to design and manufacture new biological parts, devices, and systems. This market encompasses various applications, including industrial production, healthcare, agriculture, and energy. Synthetic biology is revolutionizing industries with its potential to produce sustainable biofuels, engineer microbes for pharmaceutical production, and create novel organisms for environmental remediation. The market is fueled by advancements in gene editing technologies like CRISPR-Cas9, synthetic gene design, and automated DNA assembly. Synthetic biology also leverages systems biology, metabolic engineering, and gene synthesis. As research and development continue to progress, the market is poised to deliver groundbreaking solutions, transforming industries and improving the world.
What are the key market drivers leading to the rise in the adoption of Synthetic Biology Industry?
- The expanding utilization of synthetic biology in various applications is the primary catalyst fueling market growth through increasing adoption.
- Synthetic biology, an interdisciplinary field that merges science and engineering, is experiencing significant growth due to its wide-ranging applications in various industries. This field's primary function is to design and construct new biological parts, devices, and systems, enabling the production of efficient biochemicals, therapeutics, medicines, biofuels, and bio-based alternatives. Synthetic biology's potential is immense, particularly in the food and beverage sector, where it is used to create fundamental food components. The use of advanced techniques such as phage display, protein engineering, gene regulation, and gene expression, along with high-throughput screening and quality control methods, are essential in synthetic biology.
- Intellectual property considerations are also crucial in this field, ensuring the protection of innovations and advancements. However, ethical considerations are a significant challenge, necessitating ongoing discussions and regulations. As the market continues to evolve, it offers immense opportunities for innovation and growth. Its potential applications are vast, from health and wellness to energy production, making it an exciting and dynamic field for businesses and researchers alike. The future of synthetic biology is promising, with continuous advancements and discoveries expected to revolutionize industries and improve our daily lives.
What are the market trends shaping the Synthetic Biology Industry?
- Synthetic biology is an emerging field with a rapidly evolving regulatory framework, making it a significant market trend for professionals. Compliance with regulatory standards is essential for the successful development and commercialization of synthetic biology products.
- Synthetic biology, a revolutionary technology, has witnessed significant adoption by various industries in recent years. This technology, which encompasses platforms such as DNA sequencing, metabolic engineering, yeast display, and mRNA technology, among others, is transforming sectors like healthcare and agriculture. The integration of data analytics and predictive modeling in synthetic biology is driving cost reduction and enabling personalized medicine. However, the use of synthetic biology comes with challenges, including biosafety and biosecurity concerns.
- Governments worldwide are addressing these issues by establishing clear guidelines, policies, and regulations to mitigate potential risks. These efforts aim to ensure the safe and ethical application of synthetic biology, ultimately fostering innovation and progress in this field.
What challenges does the Synthetic Biology Industry face during its growth?
- The growth of the industry is significantly impacted by technical challenges, which represent a pivotal hurdle that must be addressed by professionals in the field.
- Synthetic biology, an emerging field that involves designing and constructing new biological parts, devices, and systems, faces unique challenges due to the intricate nature of biological systems. Unlike other engineered systems, such as automobiles and computers, biological systems exhibit unpredictable complex behavior. This complexity makes downstream processing and automated workflows in synthetic biology more challenging. At the molecular and cellular level, researchers and scientists encounter significant difficulties due to the infinite complexity of living organisms. The transition from the cellular level to the system level, for instance, in producing engineered tissues, adds to the complexity. Moreover, even when reliable biological parts are available, scientists lack the necessary knowledge to use them effectively.
- Advancements in technologies like directed evolution, next-generation sequencing (NGS), RNA interference (RNAi), genome editing, synthetic DNA, and gene synthesis are driving innovation in synthetic biology. However, public perception and ethical concerns related to these technologies pose challenges to the market's growth. To address these challenges, companies in the synthetic biology industry are investing in research and development to create more robust and harmonious biological systems. Recent research focuses on immersive and thematic approaches to strike a balance between scientific advancements and societal acceptance. By emphasizing the potential benefits of synthetic biology, these efforts aim to foster a positive public perception and accelerate market growth.
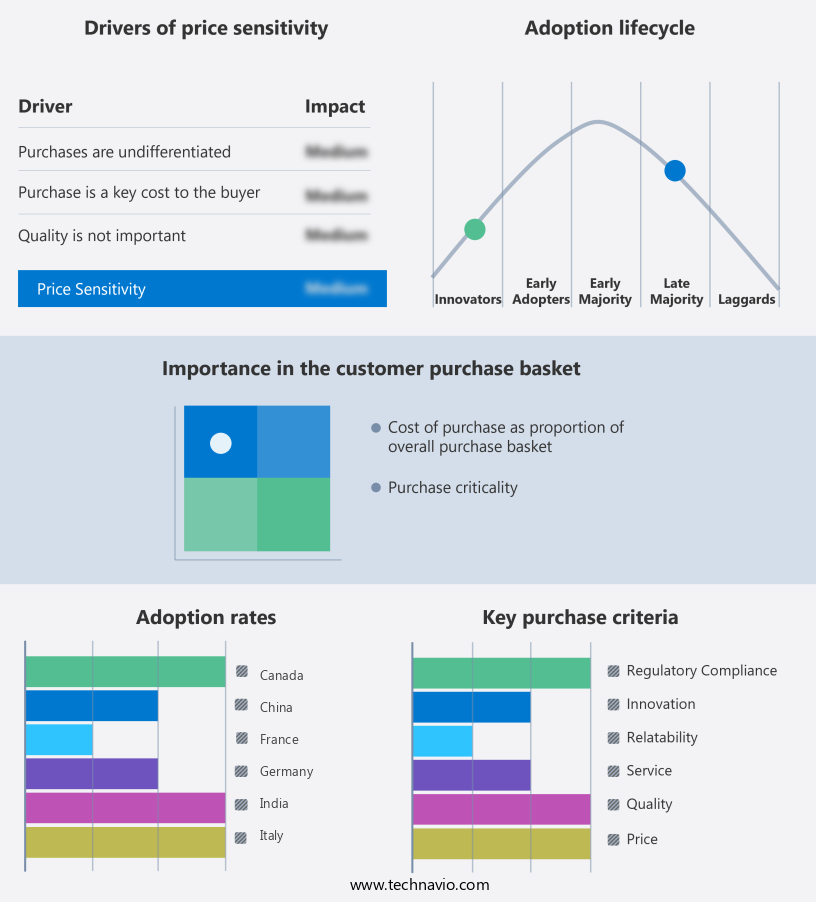
Exclusive Customer Landscape
The synthetic biology market forecasting report includes the adoption lifecycle of the market, covering from the innovator's stage to the laggard's stage. It focuses on adoption rates in different regions based on penetration. Furthermore, the synthetic biology market report also includes key purchase criteria and drivers of price sensitivity to help companies evaluate and develop their market growth analysis strategies.

Customer Landscape
Key Companies & Market Insights
Companies are implementing various strategies, such as strategic alliances, synthetic biology market forecast, partnerships, mergers and acquisitions, geographical expansion, and product/service launches, to enhance their presence in the industry.
Agilent Technologies Inc. - Synthetic biology innovations include advanced DNA synthesis platforms, such as SurePrint Oligo Libraries, enabling high-throughput DNA production.
The industry research and growth report includes detailed analyses of the competitive landscape of the market and information about key companies, including:
- Agilent Technologies Inc.
- Amyris Inc.
- Arzeda Corporation
- Bolt Threads
- Codexis Inc
- Conagen Inc.
- Creative Biogene
- DNA Script
- Ecovative Design LLC
- Genomatica Inc.
- Ginkgo Bioworks Holdings Inc.
- Huue, Inc.
- Integrated DNA Technologies Inc.
- Joyn Bio LLC
- LanzaTech Global Inc.
- Mammoth Biosciences, Inc.
- Merck KGaA
- Novozymes AS
- Thermo Fisher Scientific Inc.
- Twist Bioscience Corp.
Qualitative and quantitative analysis of companies has been conducted to help clients understand the wider business environment as well as the strengths and weaknesses of key industry players. Data is qualitatively analyzed to categorize companies as pure play, category-focused, industry-focused, and diversified; it is quantitatively analyzed to categorize companies as dominant, leading, strong, tentative, and weak.
Recent Development and News in Synthetic Biology Market
- In January 2024, Genome Sciences International, a leading player in the market, announced the launch of its revolutionary new product, "GSI BioDesigner," a user-friendly software platform designed to streamline the design and construction of synthetic biological systems (Genome Sciences International Press Release).
- In March 2024, Synthetic Biologics, Inc. and Merck KGaA, Darmstadt, Germany, a leading science and technology company, entered into a strategic collaboration to develop and commercialize therapeutic candidates using Synthetic Biologics' synthetic biology platform (Merck KGaA Press Release).
- In April 2025, Intrexon Corporation, a pioneer in synthetic biology, raised USD 150 million in a Series E funding round, bringing its total funding to over USD 1 billion, to accelerate the development and commercialization of its synthetic biology technologies (Intrexon Corporation SEC Filing).
- In May 2025, the European Commission approved the use of Synbio Technologies' synthetic biology-derived biofuels, marking a significant milestone in the commercialization of synthetic biology for the production of renewable energy sources (European Commission Press Release).
Research Analyst Overview
- Synthetic biology, an interdisciplinary field that combines engineering and biology, is experiencing significant growth with diverse applications in various industries. Restriction enzymes play a crucial role in DNA assembly, enabling the creation of genetic circuits and pathway engineering in chassis organisms for agricultural, therapeutic, and environmental applications. Open-source biology facilitates collaboration and innovation, driving advancements in synthetic biology. Orthogonal translation and artificial cells expand the possibilities of biomolecular computing. Metabolic flux analysis and quantitative PCR (qPCR) are essential tools for understanding and optimizing synthetic circuits in medical applications.
- The patent landscape for synthetic biology applications continues to evolve, with key technologies such as Gibson assembly and Golden Gate assembly shaping the field. Synthetic organelles and diagnostic applications further broaden the scope of this dynamic and innovative industry.
Dive into Technavio's robust research methodology, blending expert interviews, extensive data synthesis, and validated models for unparalleled Synthetic Biology Market insights. See full methodology.
Market Scope
|
Report Coverage
|
Details
|
Page number
|
209
|
Base year
|
2024
|
Historic period
|
2019-2023 |
Forecast period
|
2025-2029
|
Growth momentum & CAGR
|
Accelerate at a CAGR of 25.7%
|
Market growth 2025-2029
|
USD 44011.1 million
|
Market structure
|
Fragmented
|
YoY growth 2024-2025(%)
|
24.4
|
Key countries
|
US, Canada, Germany, UK, Japan, Italy, China, France, South Korea, India, UAE, and Rest of World(ROW)
|
Competitive landscape
|
Leading Companies, Market Positioning of Companies, Competitive Strategies, and Industry Risks
|
Request Free Sample
What are the Key Data Covered in this Synthetic Biology Market Research and Growth Report?
- CAGR of the Synthetic Biology industry during the forecast period
- Detailed information on factors that will drive the growth and forecasting between 2025 and 2029
- Precise estimation of the size of the market and its contribution of the industry in focus to the parent market
- Accurate predictions about upcoming growth and trends and changes in consumer behaviour
- Growth of the market across North America, Europe, Asia, and Rest of World (ROW)
- Thorough analysis of the market's competitive landscape and detailed information about companies
- Comprehensive analysis of factors that will challenge the synthetic biology market growth of industry companies
We can help! Our analysts can customize this synthetic biology market research report to meet your requirements.
Get in touch
1 Executive Summary
- 1.1 Market overview
- Executive Summary - Chart on Market Overview
- Executive Summary - Data Table on Market Overview
- Executive Summary - Chart on Global Market Characteristics
- Executive Summary - Chart on Market by Geography
- Executive Summary - Chart on Market Segmentation by Application
- Executive Summary - Chart on Market Segmentation by Product
- Executive Summary - Chart on Incremental Growth
- Executive Summary - Data Table on Incremental Growth
- Executive Summary - Chart on Company Market Positioning
2 Technavio Analysis
- 2.1 Analysis of price sensitivity, lifecycle, customer purchase basket, adoption rates, and purchase criteria
- Analysis of price sensitivity, lifecycle, customer purchase basket, adoption rates, and purchase criteria
- 2.2 Criticality of inputs and Factors of differentiation
- Overview on criticality of inputs and factors of differentiation
- 2.3 Factors of disruption
- Overview on factors of disruption
- 2.4 Impact of drivers and challenges
- Impact of drivers and challenges in 2024 and 2029
3 Market Landscape
- 3.1 Market ecosystem
- Parent Market
- Data Table on - Parent Market
- 3.2 Market characteristics
- Market characteristics analysis
4 Market Sizing
- 4.1 Market definition
- Offerings of companies included in the market definition
- 4.2 Market segment analysis
- 4.4 Market outlook: Forecast for 2024-2029
- Chart on Global - Market size and forecast 2024-2029 ($ million)
- Data Table on Global - Market size and forecast 2024-2029 ($ million)
- Chart on Global Market: Year-over-year growth 2024-2029 (%)
- Data Table on Global Market: Year-over-year growth 2024-2029 (%)
5 Historic Market Size
- 5.1 Global Synthetic Biology Market 2019 - 2023
- Historic Market Size - Data Table on Global Synthetic Biology Market 2019 - 2023 ($ million)
- 5.2 Application segment analysis 2019 - 2023
- Historic Market Size - Application Segment 2019 - 2023 ($ million)
- 5.3 Product segment analysis 2019 - 2023
- Historic Market Size - Product Segment 2019 - 2023 ($ million)
- 5.4 Geography segment analysis 2019 - 2023
- Historic Market Size - Geography Segment 2019 - 2023 ($ million)
- 5.5 Country segment analysis 2019 - 2023
- Historic Market Size - Country Segment 2019 - 2023 ($ million)
6 Qualitative Analysis
- 6.1 AI Impact on Global Synthetic Biology Market
7 Five Forces Analysis
- 7.1 Five forces summary
- Five forces analysis - Comparison between 2024 and 2029
- 7.2 Bargaining power of buyers
- Bargaining power of buyers - Impact of key factors 2024 and 2029
- 7.3 Bargaining power of suppliers
- Bargaining power of suppliers - Impact of key factors in 2024 and 2029
- 7.4 Threat of new entrants
- Threat of new entrants - Impact of key factors in 2024 and 2029
- 7.5 Threat of substitutes
- Threat of substitutes - Impact of key factors in 2024 and 2029
- 7.6 Threat of rivalry
- Threat of rivalry - Impact of key factors in 2024 and 2029
- 7.7 Market condition
- Chart on Market condition - Five forces 2024 and 2029
8 Market Segmentation by Application
- 8.1 Market segments
- Chart on Application - Market share (2024-2029) (%)
- Data Table on Application - Market share (2024-2029) (%)
- 8.2 Comparison by Application
- Chart on Comparison by Application
- Data Table on Comparison by Application
- 8.3 Healthcare - Market size and forecast (2024-2029)
- Chart on Healthcare - Market size and forecast (2024-2029) ($ million)
- Data Table on Healthcare - Market size and forecast (2024-2029) ($ million)
- Chart on Healthcare - Year-over-year growth (2024-2029) (%)
- Data Table on Healthcare - Year-over-year growth (2024-2029) (%)
- 8.4 Industrial - Market size and forecast (2024-2029)
- Chart on Industrial - Market size and forecast (2024-2029) ($ million)
- Data Table on Industrial - Market size and forecast (2024-2029) ($ million)
- Chart on Industrial - Year-over-year growth (2024-2029) (%)
- Data Table on Industrial - Year-over-year growth (2024-2029) (%)
- 8.5 Food and agriculture - Market size and forecast (2024-2029)
- Chart on Food and agriculture - Market size and forecast (2024-2029) ($ million)
- Data Table on Food and agriculture - Market size and forecast (2024-2029) ($ million)
- Chart on Food and agriculture - Year-over-year growth (2024-2029) (%)
- Data Table on Food and agriculture - Year-over-year growth (2024-2029) (%)
- 8.6 Environmental Applications - Market size and forecast (2024-2029)
- Chart on Environmental Applications - Market size and forecast (2024-2029) ($ million)
- Data Table on Environmental Applications - Market size and forecast (2024-2029) ($ million)
- Chart on Environmental Applications - Year-over-year growth (2024-2029) (%)
- Data Table on Environmental Applications - Year-over-year growth (2024-2029) (%)
- 8.7 Consumer Care - Market size and forecast (2024-2029)
- Chart on Consumer Care - Market size and forecast (2024-2029) ($ million)
- Data Table on Consumer Care - Market size and forecast (2024-2029) ($ million)
- Chart on Consumer Care - Year-over-year growth (2024-2029) (%)
- Data Table on Consumer Care - Year-over-year growth (2024-2029) (%)
- 8.8 Energy/BiofuelsOthers - Market size and forecast (2024-2029)
- Chart on Energy/BiofuelsOthers - Market size and forecast (2024-2029) ($ million)
- Data Table on Energy/BiofuelsOthers - Market size and forecast (2024-2029) ($ million)
- Chart on Energy/BiofuelsOthers - Year-over-year growth (2024-2029) (%)
- Data Table on Energy/BiofuelsOthers - Year-over-year growth (2024-2029) (%)
- 8.9 Market opportunity by Application
- Market opportunity by Application ($ million)
- Data Table on Market opportunity by Application ($ million)
9 Market Segmentation by Product
- 9.1 Market segments
- Chart on Product - Market share (2024-2029) (%)
- Data Table on Product - Market share (2024-2029) (%)
- Market opportunity by Product ($ million)
- Data Table on Market opportunity by Product ($ million)
- 9.2 Comparison by Product
- Chart on Comparison by Product
- Data Table on Comparison by Product
- 9.3 Oligonucleotides - Market size and forecast (2024-2029)
- Chart on Oligonucleotides - Market size and forecast (2024-2029) ($ million)
- Data Table on Oligonucleotides - Market size and forecast (2024-2029) ($ million)
- Chart on Oligonucleotides - Year-over-year growth (2024-2029) (%)
- Data Table on Oligonucleotides - Year-over-year growth (2024-2029) (%)
- 9.4 Enzymes - Market size and forecast (2024-2029)
- Chart on Enzymes - Market size and forecast (2024-2029) ($ million)
- Data Table on Enzymes - Market size and forecast (2024-2029) ($ million)
- Chart on Enzymes - Year-over-year growth (2024-2029) (%)
- Data Table on Enzymes - Year-over-year growth (2024-2029) (%)
- 9.5 Cloning technology kits - Market size and forecast (2024-2029)
- Chart on Cloning technology kits - Market size and forecast (2024-2029) ($ million)
- Data Table on Cloning technology kits - Market size and forecast (2024-2029) ($ million)
- Chart on Cloning technology kits - Year-over-year growth (2024-2029) (%)
- Data Table on Cloning technology kits - Year-over-year growth (2024-2029) (%)
- 9.6 Xeno-nucleic acids - Market size and forecast (2024-2029)
- Chart on Xeno-nucleic acids - Market size and forecast (2024-2029) ($ million)
- Data Table on Xeno-nucleic acids - Market size and forecast (2024-2029) ($ million)
- Chart on Xeno-nucleic acids - Year-over-year growth (2024-2029) (%)
- Data Table on Xeno-nucleic acids - Year-over-year growth (2024-2029) (%)
- 9.7 Chassis organisms - Market size and forecast (2024-2029)
- Chart on Chassis organisms - Market size and forecast (2024-2029) ($ million)
- Data Table on Chassis organisms - Market size and forecast (2024-2029) ($ million)
- Chart on Chassis organisms - Year-over-year growth (2024-2029) (%)
- Data Table on Chassis organisms - Year-over-year growth (2024-2029) (%)
- 9.8 Synthetic Cells - Market size and forecast (2024-2029)
- Chart on Synthetic Cells - Market size and forecast (2024-2029) ($ million)
- Data Table on Synthetic Cells - Market size and forecast (2024-2029) ($ million)
- Chart on Synthetic Cells - Year-over-year growth (2024-2029) (%)
- Data Table on Synthetic Cells - Year-over-year growth (2024-2029) (%)
- 9.9 Synthetic DNA/Synthetic Genes - Market size and forecast (2024-2029)
- Chart on Synthetic DNA/Synthetic Genes - Market size and forecast (2024-2029) ($ million)
- Data Table on Synthetic DNA/Synthetic Genes - Market size and forecast (2024-2029) ($ million)
- Chart on Synthetic DNA/Synthetic Genes - Year-over-year growth (2024-2029) (%)
- Data Table on Synthetic DNA/Synthetic Genes - Year-over-year growth (2024-2029) (%)
10 Market Segmentation by Technology
- 10.1 Market segments
- Chart on Technology - Market share (2024-2029) (%)
- Data Table on Technology - Market share (2024-2029) (%)
- Chart on Microfluidics - Market size and forecast (2024-2029) ($ million)
- Data Table on Microfluidics - Market size and forecast (2024-2029) ($ million)
- Chart on Microfluidics - Year-over-year growth (2024-2029) (%)
- Data Table on Microfluidics - Year-over-year growth (2024-2029) (%)
- 10.2 Comparison by Technology
- Chart on Comparison by Technology
- Data Table on Comparison by Technology
- Chart on Nanotechnology - Market size and forecast (2024-2029) ($ million)
- Data Table on Nanotechnology - Market size and forecast (2024-2029) ($ million)
- Chart on Nanotechnology - Year-over-year growth (2024-2029) (%)
- Data Table on Nanotechnology - Year-over-year growth (2024-2029) (%)
- 10.3 Gene Synthesis - Market size and forecast (2024-2029)
- Chart on Gene Synthesis - Market size and forecast (2024-2029) ($ million)
- Data Table on Gene Synthesis - Market size and forecast (2024-2029) ($ million)
- Chart on Gene Synthesis - Year-over-year growth (2024-2029) (%)
- Data Table on Gene Synthesis - Year-over-year growth (2024-2029) (%)
- Market opportunity by Technology ($ million)
- Data Table on Market opportunity by Technology ($ million)
- 10.4 Genome Engineering - Market size and forecast (2024-2029)
- Chart on Genome Engineering - Market size and forecast (2024-2029) ($ million)
- Data Table on Genome Engineering - Market size and forecast (2024-2029) ($ million)
- Chart on Genome Engineering - Year-over-year growth (2024-2029) (%)
- Data Table on Genome Engineering - Year-over-year growth (2024-2029) (%)
- 10.5 Sequencing - Market size and forecast (2024-2029)
- Chart on Sequencing - Market size and forecast (2024-2029) ($ million)
- Data Table on Sequencing - Market size and forecast (2024-2029) ($ million)
- Chart on Sequencing - Year-over-year growth (2024-2029) (%)
- Data Table on Sequencing - Year-over-year growth (2024-2029) (%)
- 10.6 Bioinformatics - Market size and forecast (2024-2029)
- Chart on Bioinformatics - Market size and forecast (2024-2029) ($ million)
- Data Table on Bioinformatics - Market size and forecast (2024-2029) ($ million)
- Chart on Bioinformatics - Year-over-year growth (2024-2029) (%)
- Data Table on Bioinformatics - Year-over-year growth (2024-2029) (%)
- 10.7 Cloning - Market size and forecast (2024-2029)
- Chart on Cloning - Market size and forecast (2024-2029) ($ million)
- Data Table on Cloning - Market size and forecast (2024-2029) ($ million)
- Chart on Cloning - Year-over-year growth (2024-2029) (%)
- Data Table on Cloning - Year-over-year growth (2024-2029) (%)
- 10.8 Site-Directed Mutagenesis - Market size and forecast (2024-2029)
- Chart on Site-Directed Mutagenesis - Market size and forecast (2024-2029) ($ million)
- Data Table on Site-Directed Mutagenesis - Market size and forecast (2024-2029) ($ million)
- Chart on Site-Directed Mutagenesis - Year-over-year growth (2024-2029) (%)
- Data Table on Site-Directed Mutagenesis - Year-over-year growth (2024-2029) (%)
- 10.9 Measurement & Modeling - Market size and forecast (2024-2029)
- Chart on Measurement & Modeling - Market size and forecast (2024-2029) ($ million)
- Data Table on Measurement & Modeling - Market size and forecast (2024-2029) ($ million)
- Chart on Measurement & Modeling - Year-over-year growth (2024-2029) (%)
- Data Table on Measurement & Modeling - Year-over-year growth (2024-2029) (%)
11 Market Segmentation by End-user
- 11.1 Market segments
- Chart on End-user - Market share (2024-2029) (%)
- Data Table on End-user - Market share (2024-2029) (%)
- 11.2 Comparison by End-user
- Chart on Comparison by End-user
- Data Table on Comparison by End-user
- 11.3 Biotechnology and Pharmaceutical Companies - Market size and forecast (2024-2029)
- Chart on Biotechnology and Pharmaceutical Companies - Market size and forecast (2024-2029) ($ million)
- Data Table on Biotechnology and Pharmaceutical Companies - Market size and forecast (2024-2029) ($ million)
- Chart on Biotechnology and Pharmaceutical Companies - Year-over-year growth (2024-2029) (%)
- Data Table on Biotechnology and Pharmaceutical Companies - Year-over-year growth (2024-2029) (%)
- 11.4 Academic and Research Institutes - Market size and forecast (2024-2029)
- Chart on Academic and Research Institutes - Market size and forecast (2024-2029) ($ million)
- Data Table on Academic and Research Institutes - Market size and forecast (2024-2029) ($ million)
- Chart on Academic and Research Institutes - Year-over-year growth (2024-2029) (%)
- Data Table on Academic and Research Institutes - Year-over-year growth (2024-2029) (%)
- 11.5 Others - Market size and forecast (2024-2029)
- Chart on Others - Market size and forecast (2024-2029) ($ million)
- Data Table on Others - Market size and forecast (2024-2029) ($ million)
- Chart on Others - Year-over-year growth (2024-2029) (%)
- Data Table on Others - Year-over-year growth (2024-2029) (%)
- 11.6 Market opportunity by End-user
- Market opportunity by End-user ($ million)
- Data Table on Market opportunity by End-user ($ million)
12 Customer Landscape
- 12.1 Customer landscape overview
- Analysis of price sensitivity, lifecycle, customer purchase basket, adoption rates, and purchase criteria
13 Geographic Landscape
- 13.1 Geographic segmentation
- Chart on Market share by geography 2024-2029 (%)
- Data Table on Market share by geography 2024-2029 (%)
- 13.2 Geographic comparison
- Chart on Geographic comparison
- Data Table on Geographic comparison
- 13.3 North America - Market size and forecast 2024-2029
- Chart on North America - Market size and forecast 2024-2029 ($ million)
- Data Table on North America - Market size and forecast 2024-2029 ($ million)
- Chart on North America - Year-over-year growth 2024-2029 (%)
- Data Table on North America - Year-over-year growth 2024-2029 (%)
- 13.4 Europe - Market size and forecast 2024-2029
- Chart on Europe - Market size and forecast 2024-2029 ($ million)
- Data Table on Europe - Market size and forecast 2024-2029 ($ million)
- Chart on Europe - Year-over-year growth 2024-2029 (%)
- Data Table on Europe - Year-over-year growth 2024-2029 (%)
- 13.5 Asia - Market size and forecast 2024-2029
- Chart on Asia - Market size and forecast 2024-2029 ($ million)
- Data Table on Asia - Market size and forecast 2024-2029 ($ million)
- Chart on Asia - Year-over-year growth 2024-2029 (%)
- Data Table on Asia - Year-over-year growth 2024-2029 (%)
- 13.6 Rest of World (ROW) - Market size and forecast 2024-2029
- Chart on Rest of World (ROW) - Market size and forecast 2024-2029 ($ million)
- Data Table on Rest of World (ROW) - Market size and forecast 2024-2029 ($ million)
- Chart on Rest of World (ROW) - Year-over-year growth 2024-2029 (%)
- Data Table on Rest of World (ROW) - Year-over-year growth 2024-2029 (%)
- 13.7 US - Market size and forecast 2024-2029
- Chart on US - Market size and forecast 2024-2029 ($ million)
- Data Table on US - Market size and forecast 2024-2029 ($ million)
- Chart on US - Year-over-year growth 2024-2029 (%)
- Data Table on US - Year-over-year growth 2024-2029 (%)
- 13.8 Canada - Market size and forecast 2024-2029
- Chart on Canada - Market size and forecast 2024-2029 ($ million)
- Data Table on Canada - Market size and forecast 2024-2029 ($ million)
- Chart on Canada - Year-over-year growth 2024-2029 (%)
- Data Table on Canada - Year-over-year growth 2024-2029 (%)
- 13.9 UK - Market size and forecast 2024-2029
- Chart on UK - Market size and forecast 2024-2029 ($ million)
- Data Table on UK - Market size and forecast 2024-2029 ($ million)
- Chart on UK - Year-over-year growth 2024-2029 (%)
- Data Table on UK - Year-over-year growth 2024-2029 (%)
- 13.10 Germany - Market size and forecast 2024-2029
- Chart on Germany - Market size and forecast 2024-2029 ($ million)
- Data Table on Germany - Market size and forecast 2024-2029 ($ million)
- Chart on Germany - Year-over-year growth 2024-2029 (%)
- Data Table on Germany - Year-over-year growth 2024-2029 (%)
- 13.11 China - Market size and forecast 2024-2029
- Chart on China - Market size and forecast 2024-2029 ($ million)
- Data Table on China - Market size and forecast 2024-2029 ($ million)
- Chart on China - Year-over-year growth 2024-2029 (%)
- Data Table on China - Year-over-year growth 2024-2029 (%)
- 13.12 France - Market size and forecast 2024-2029
- Chart on France - Market size and forecast 2024-2029 ($ million)
- Data Table on France - Market size and forecast 2024-2029 ($ million)
- Chart on France - Year-over-year growth 2024-2029 (%)
- Data Table on France - Year-over-year growth 2024-2029 (%)
- 13.13 Japan - Market size and forecast 2024-2029
- Chart on Japan - Market size and forecast 2024-2029 ($ million)
- Data Table on Japan - Market size and forecast 2024-2029 ($ million)
- Chart on Japan - Year-over-year growth 2024-2029 (%)
- Data Table on Japan - Year-over-year growth 2024-2029 (%)
- 13.14 Italy - Market size and forecast 2024-2029
- Chart on Italy - Market size and forecast 2024-2029 ($ million)
- Data Table on Italy - Market size and forecast 2024-2029 ($ million)
- Chart on Italy - Year-over-year growth 2024-2029 (%)
- Data Table on Italy - Year-over-year growth 2024-2029 (%)
- 13.15 India - Market size and forecast 2024-2029
- Chart on India - Market size and forecast 2024-2029 ($ million)
- Data Table on India - Market size and forecast 2024-2029 ($ million)
- Chart on India - Year-over-year growth 2024-2029 (%)
- Data Table on India - Year-over-year growth 2024-2029 (%)
- 13.16 South Korea - Market size and forecast 2024-2029
- Chart on South Korea - Market size and forecast 2024-2029 ($ million)
- Data Table on South Korea - Market size and forecast 2024-2029 ($ million)
- Chart on South Korea - Year-over-year growth 2024-2029 (%)
- Data Table on South Korea - Year-over-year growth 2024-2029 (%)
- 13.17 Market opportunity by geography
- Market opportunity by geography ($ million)
- Data Tables on Market opportunity by geography ($ million)
- 13.18 UAE - Market size and forecast (2024-2029)
- Chart on UAE - Market size and forecast (2024-2029) ($ million)
- Data Table on UAE - Market size and forecast (2024-2029) ($ million)
- Chart on UAE - Year-over-year growth (2024-2029) (%)
- Data Table on UAE - Year-over-year growth (2024-2029) (%)
- 13.19 Rest of World(ROW) - Market size and forecast (2024-2029)
- Chart on Rest of World(ROW) - Market size and forecast (2024-2029) ($ million)
- Data Table on Rest of World(ROW) - Market size and forecast (2024-2029) ($ million)
- Chart on Rest of World(ROW) - Year-over-year growth (2024-2029) (%)
- Data Table on Rest of World(ROW) - Year-over-year growth (2024-2029) (%)
14 Drivers, Challenges, and Opportunity/Restraints
- 14.3 Impact of drivers and challenges
- Impact of drivers and challenges in 2024 and 2029
- 14.4 Market opportunities/restraints
15 Competitive Landscape
- 15.2 Competitive Landscape
- Overview on criticality of inputs and factors of differentiation
- 15.3 Landscape disruption
- Overview on factors of disruption
- 15.4 Industry risks
- Impact of key risks on business
16 Competitive Analysis
- 16.2 Company ranking index
- 16.3 Market positioning of companies
- Matrix on companies position and classification
- 16.4 Agilent Technologies Inc.
- Agilent Technologies Inc. - Overview
- Agilent Technologies Inc. - Business segments
- Agilent Technologies Inc. - Key news
- Agilent Technologies Inc. - Key offerings
- Agilent Technologies Inc. - Segment focus
- SWOT
- 16.5 Amyris Inc.
- Amyris Inc. - Overview
- Amyris Inc. - Product / Service
- Amyris Inc. - Key offerings
- SWOT
- 16.6 Arzeda Corporation
- Arzeda Corporation - Overview
- Arzeda Corporation - Product / Service
- Arzeda Corporation - Key offerings
- SWOT
- 16.7 Codexis Inc
- Codexis Inc - Overview
- Codexis Inc - Business segments
- Codexis Inc - Key offerings
- Codexis Inc - Segment focus
- SWOT
- 16.8 Conagen Inc.
- Conagen Inc. - Overview
- Conagen Inc. - Product / Service
- Conagen Inc. - Key offerings
- SWOT
- 16.9 DNA Script
- DNA Script - Overview
- DNA Script - Product / Service
- DNA Script - Key offerings
- SWOT
- 16.10 Genomatica Inc.
- Genomatica Inc. - Overview
- Genomatica Inc. - Product / Service
- Genomatica Inc. - Key offerings
- SWOT
- 16.11 Ginkgo Bioworks Holdings Inc.
- Ginkgo Bioworks Holdings Inc. - Overview
- Ginkgo Bioworks Holdings Inc. - Product / Service
- Ginkgo Bioworks Holdings Inc. - Key offerings
- SWOT
- 16.12 Integrated DNA Technologies Inc.
- Integrated DNA Technologies Inc. - Overview
- Integrated DNA Technologies Inc. - Product / Service
- Integrated DNA Technologies Inc. - Key offerings
- SWOT
- 16.13 Joyn Bio LLC
- Joyn Bio LLC - Overview
- Joyn Bio LLC - Product / Service
- Joyn Bio LLC - Key offerings
- SWOT
- 16.14 Mammoth Biosciences, Inc.
- Mammoth Biosciences, Inc. - Overview
- Mammoth Biosciences, Inc. - Product / Service
- Mammoth Biosciences, Inc. - Key offerings
- SWOT
- 16.15 Merck KGaA
- Merck KGaA - Overview
- Merck KGaA - Business segments
- Merck KGaA - Key news
- Merck KGaA - Key offerings
- Merck KGaA - Segment focus
- SWOT
- 16.16 Novozymes AS
- Novozymes AS - Overview
- Novozymes AS - Product / Service
- Novozymes AS - Key offerings
- SWOT
- 16.17 Thermo Fisher Scientific Inc.
- Thermo Fisher Scientific Inc. - Overview
- Thermo Fisher Scientific Inc. - Business segments
- Thermo Fisher Scientific Inc. - Key news
- Thermo Fisher Scientific Inc. - Key offerings
- Thermo Fisher Scientific Inc. - Segment focus
- SWOT
- 16.18 Twist Bioscience Corp.
- Twist Bioscience Corp. - Overview
- Twist Bioscience Corp. - Product / Service
- Twist Bioscience Corp. - Key offerings
- SWOT
17 Appendix
- 17.2 Inclusions and exclusions checklist
- Inclusions checklist
- Exclusions checklist
- 17.3 Currency conversion rates for US$
- Currency conversion rates for US$
- 17.4 Research methodology
- 17.7 Validation techniques employed for market sizing
- Validation techniques employed for market sizing
- 17.9 360 degree market analysis
- 360 degree market analysis
- 17.10 List of abbreviations