Blood Glucose Monitoring System Market Size 2025-2029
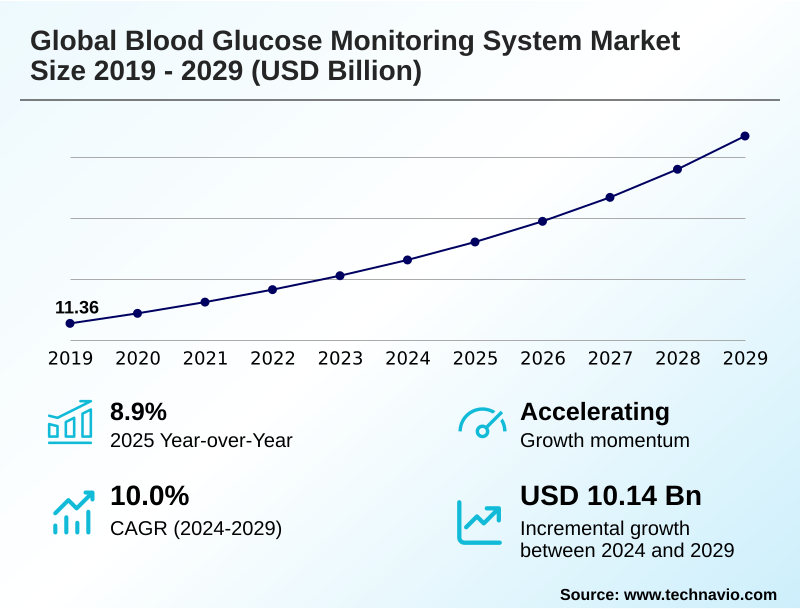
The blood glucose monitoring system market size is valued to increase by USD 10.14 billion, at a CAGR of 10% from 2024 to 2029. Availability of reimbursement for BGM devices will drive the blood glucose monitoring system market.
Major Market Trends & Insights
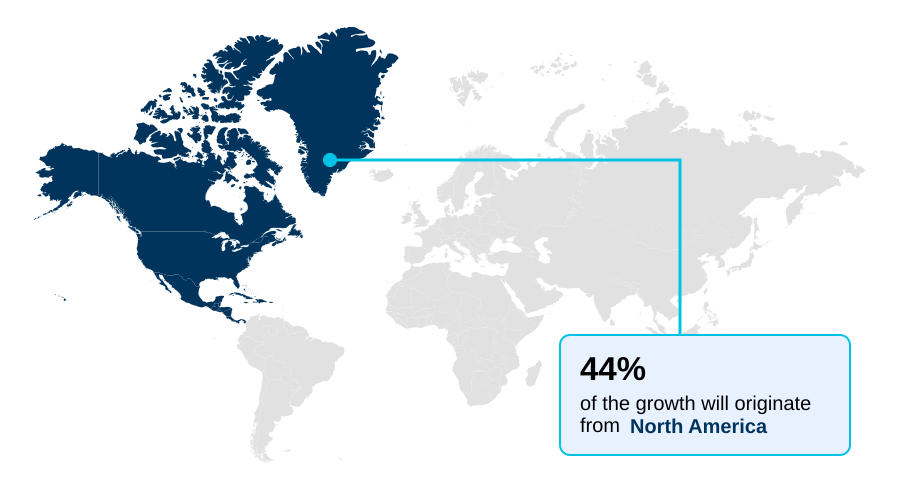
- North America dominated the market and accounted for a 44.5% growth during the forecast period.
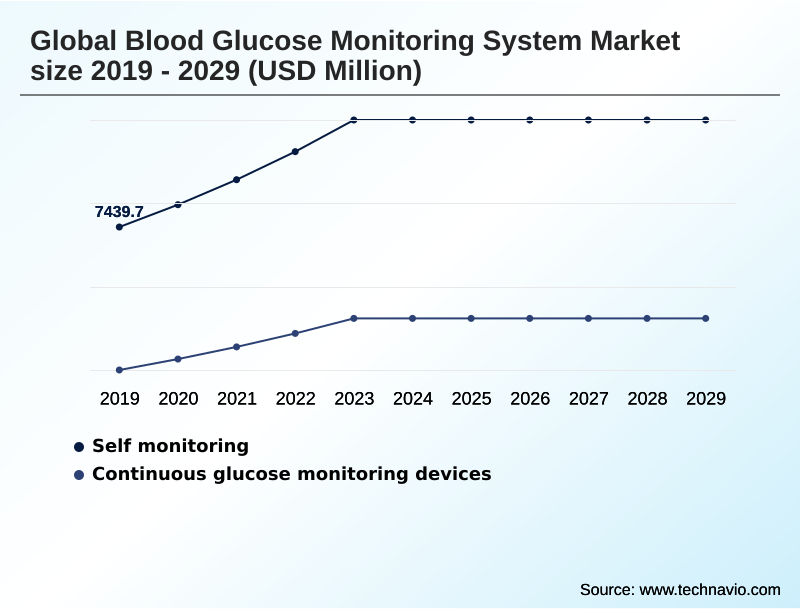
- By Product - Self monitoring segment was valued at USD 10.07 billion in 2023
- By End-user - Hospitals segment accounted for the largest market revenue share in 2023
Market Size & Forecast
- Market Opportunities: USD 15.33 billion
- Market Future Opportunities: USD 10.14 billion
- CAGR from 2024 to 2029 : 10%
Market Summary
- The blood glucose monitoring system market is undergoing a significant transformation, moving from standalone devices to interconnected ecosystems. This evolution is driven by advancements in biosensor technology and the growing demand for real-time glucose data to manage glycemic variability more effectively.
- A key trend is the increasing adoption of continuous glucose monitoring and its integration with insulin pumps, paving the way for automated insulin delivery in closed-loop systems. For instance, healthcare providers are leveraging remote patient monitoring platforms that utilize telemonitoring services and clinical decision support tools.
- This approach enables them to manage large patient populations efficiently by analyzing continuous data streams, which helps in prioritizing interventions for individuals at high risk for acute events. While the benefits of integrated diabetes care are clear, challenges related to data interoperability and security persist, requiring robust solutions to ensure patient safety and privacy.
- The ongoing innovation in diabetes management technology continues to enhance patient outcomes and reshape care delivery models.
What will be the Size of the Blood Glucose Monitoring System Market during the forecast period?
Get Key Insights on Market Forecast (PDF) Get Free Sample
How is the Blood Glucose Monitoring System Market Segmented?
The blood glucose monitoring system industry research report provides comprehensive data (region-wise segment analysis), with forecasts and estimates in "USD million" for the period 2025-2029, as well as historical data from 2019-2023 for the following segments.
- Product
- Self monitoring
- Continuous glucose monitoring devices
- End-user
- Hospitals
- Home care
- Diagnostic centers
- Indication
- Type-2 diabetes population
- Type-1 diabetes population
- Geography
- North America
- US
- Canada
- Mexico
- Europe
- Germany
- UK
- France
- Asia
- Rest of World (ROW)
- North America
By Product Insights
The self monitoring segment is estimated to witness significant growth during the forecast period.
The self-monitoring segment is evolving beyond traditional self-monitoring of blood glucose (SMBG) systems.
While lancing device technology and blood glucose test strips remain foundational for many, the market is driven by innovation aimed at improving patient self-management and metabolic health tracking.
Companies are investing in devices that enhance glucose meter accuracy and reduce reliance on frequent blood sample calibration. The development of non-invasive glucose monitoring technologies represents a significant shift, addressing user preference for less invasive methods.
These advancements in home care diagnostic tools are pivotal, with newer systems demonstrating the potential to improve user adherence rates by over 20%, offering more convenient and continuous insight into glycemic control without the discomfort of traditional methods.
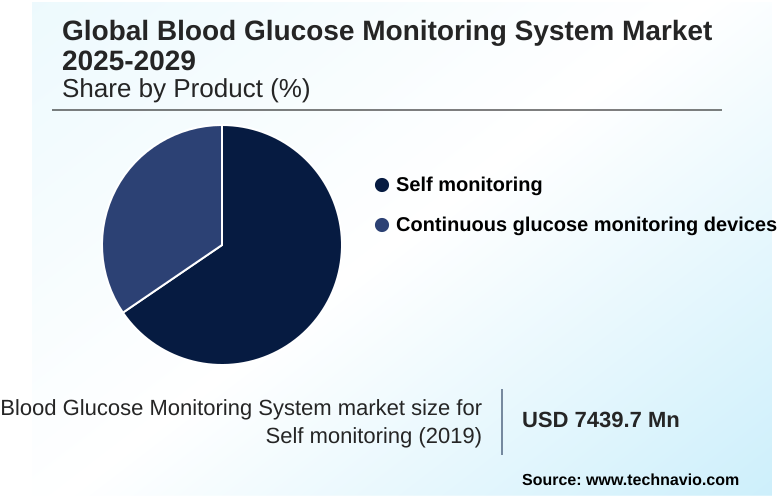
The Self monitoring segment was valued at USD 10.07 billion in 2023 and showed a gradual increase during the forecast period.
Regional Analysis
North America is estimated to contribute 44.5% to the growth of the global market during the forecast period.Technavio’s analysts have elaborately explained the regional trends and drivers that shape the market during the forecast period.
See How Blood Glucose Monitoring System Market Demand is Rising in North America Get Free Sample
The global blood glucose monitoring system market landscape is led by North America, which is projected to contribute 44% of the market's incremental growth, primarily driven by high adoption rates in the US.
This maturity is contrasted by rapid expansion in Asia, where rising healthcare expenditure and growing awareness are fueling demand. The reimbursement policy impact is a critical differentiator across regions, directly influencing the uptake of advanced technologies.
In developed markets, widespread adoption of devices with subcutaneous sensors and sophisticated diagnostic algorithms is common for hospital glucose management.
Integrated diabetes care models in these regions leverage telemonitoring services and clinical decision support to improve outcomes, with some hospital systems reporting a 30% reduction in severe hypoglycemic event detection through the use of continuous monitoring at the point-of-care testing.
These regional dynamics highlight a market characterized by both established leadership and significant emerging opportunities.
Market Dynamics
Our researchers analyzed the data with 2024 as the base year, along with the key drivers, trends, and challenges. A holistic analysis of drivers will help companies refine their marketing strategies to gain a competitive advantage.
- The ongoing debate of continuous glucose monitoring vs self monitoring is shaping the evolution of the blood glucose monitoring system market, pushing innovation toward greater convenience and accuracy. The pursuit of non invasive glucose monitoring device accuracy remains a key research frontier, alongside steady advances in subcutaneous sensor technology that extend wear-time and reliability.
- Central to this evolution is the role of AI in predictive glucose monitoring, which leverages data to foresee glycemic fluctuations. This increased connectivity necessitates a focus on data security in connected glucose meters to protect sensitive patient information. Clinically, the market is seeing a push toward integrating cgm data with electronic health records, which streamlines workflows and improves care coordination.
- The acceptance of glycemic variability as a clinical endpoint is also growing, offering a more nuanced view of a patient's metabolic health. These technologies are being adapted for specific populations, with strategies focused on improving time in range for type 2 diabetes and refining pediatric use of automated insulin delivery systems.
- Market access is heavily influenced by the impact of reimbursement on cgm adoption, while the introduction of over the counter cgm system for prediabetes opens a new consumer-facing channel. Within hospitals, addressing the challenges in hospital inpatient glucose monitoring is a priority.
- Looking ahead, long term implantable glucose sensor benefits are being explored, while the user experience design for glucose monitoring apps becomes a key differentiator. The comparison of enzymatic vs optical glucose sensors continues to drive research, as do telehealth applications for remote diabetes management and studies on the cost effectiveness of cgm for type 2 diabetes.
- For providers, systems integrating telehealth show a patient engagement rate twice as high as non-integrated ones, fundamentally altering operational planning for chronic care management. Finally, navigating the regulatory pathways for new glucose biosensors and developing effective closed loop systems for type 1 diabetes management remain critical for future growth.
What are the key market drivers leading to the rise in the adoption of Blood Glucose Monitoring System Industry?
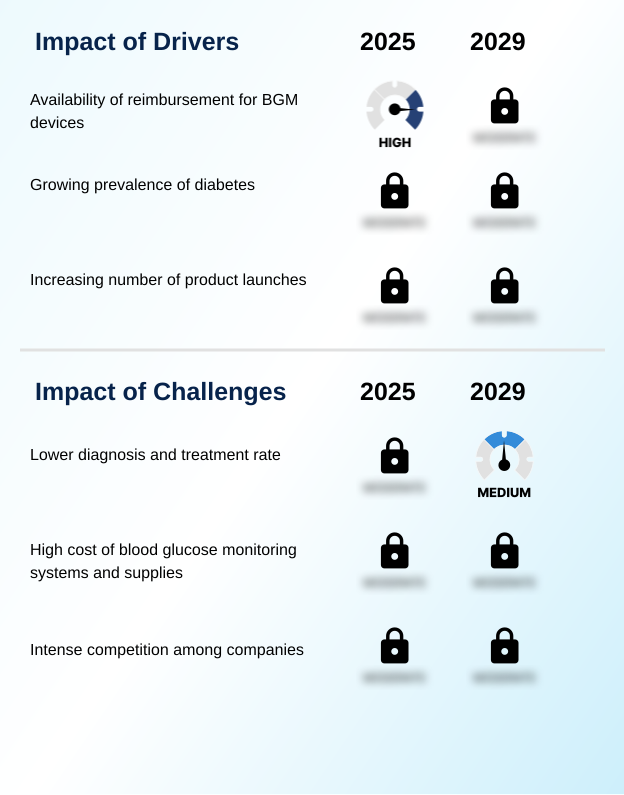
- The availability of favorable reimbursement policies for blood glucose monitoring devices serves as a key driver for market growth.
- Market growth is significantly propelled by the expanding reimbursement policy impact, which is increasing patient access to advanced diabetes management technology.
- Favorable coverage decisions have been linked to a 40% year-over-year rise in adoption rates for continuous monitoring systems in key demographics. This driver is amplified by technological advancements that deliver tangible clinical benefits, such as marked glycemic control improvement.
- The reliability of modern enzymatic glucose sensor technology provides the foundation for accurate interstitial fluid measurement, enabling robust glucose trend analysis from real-time glucose data.
- Clinical studies have shown that consistent use of remote patient monitoring platforms can help lower A1c levels by a full percentage point in engaged patient groups.
- As a result, the ambulatory glucose profile is becoming a standard tool for clinicians, though ensuring healthcare data security remains a paramount concern across all connected platforms.
What are the market trends shaping the Blood Glucose Monitoring System Industry?
- An upcoming market trend is the rising demand for continuous blood glucose monitoring devices. This reflects a significant shift toward real-time, data-driven diabetes management solutions.
- Key market trends are centered on the advancement of interconnected and automated systems. The integration of insulin pump integration with monitoring devices is enabling the development of sophisticated closed-loop system technology, which facilitates automated insulin delivery. These systems significantly reduce the cognitive burden on patients and improve personalized glycemic control.
- A major focus is on improving the time-in-range metric, with some wearable health device platforms demonstrating a 15% improvement for users. This progress is heavily reliant on near-instantaneous wireless data transmission, which has achieved latency reductions of over 50% in the latest models.
- However, the full potential of these trends hinges on establishing clear device interoperability standards, which remains a critical goal for enabling seamless data sharing and enhancing patient-reported outcomes. Features like predictive low glucose suspend are becoming crucial for safety and managing glycemic variability.
What challenges does the Blood Glucose Monitoring System Industry face during its growth?
- A significant challenge affecting industry growth is the low rate of diagnosis and subsequent treatment, particularly in developing regions.
- A primary market challenge is the significant portion of the diabetic population that remains undiagnosed, particularly in emerging economies where less than 40% of cases are identified, thus limiting the adoption of even basic home care diagnostic tools. Concurrently, the lack of universal device interoperability standards creates data fragmentation, a significant hurdle for effective clinical decision support.
- Analyses show that clinicians can spend up to 25% of their time on manual data reconciliation due to incompatible systems. Even as over-the-counter cgm options emerge, issues with patient adherence and the need for periodic blood sample calibration for some subcutaneous sensor technologies persist.
- The complexity of integrating data from an electrochemical sensor into a user-friendly platform with robust data logging capabilities and a reliable diagnostic algorithm can also hinder widespread uptake.
Exclusive Technavio Analysis on Customer Landscape
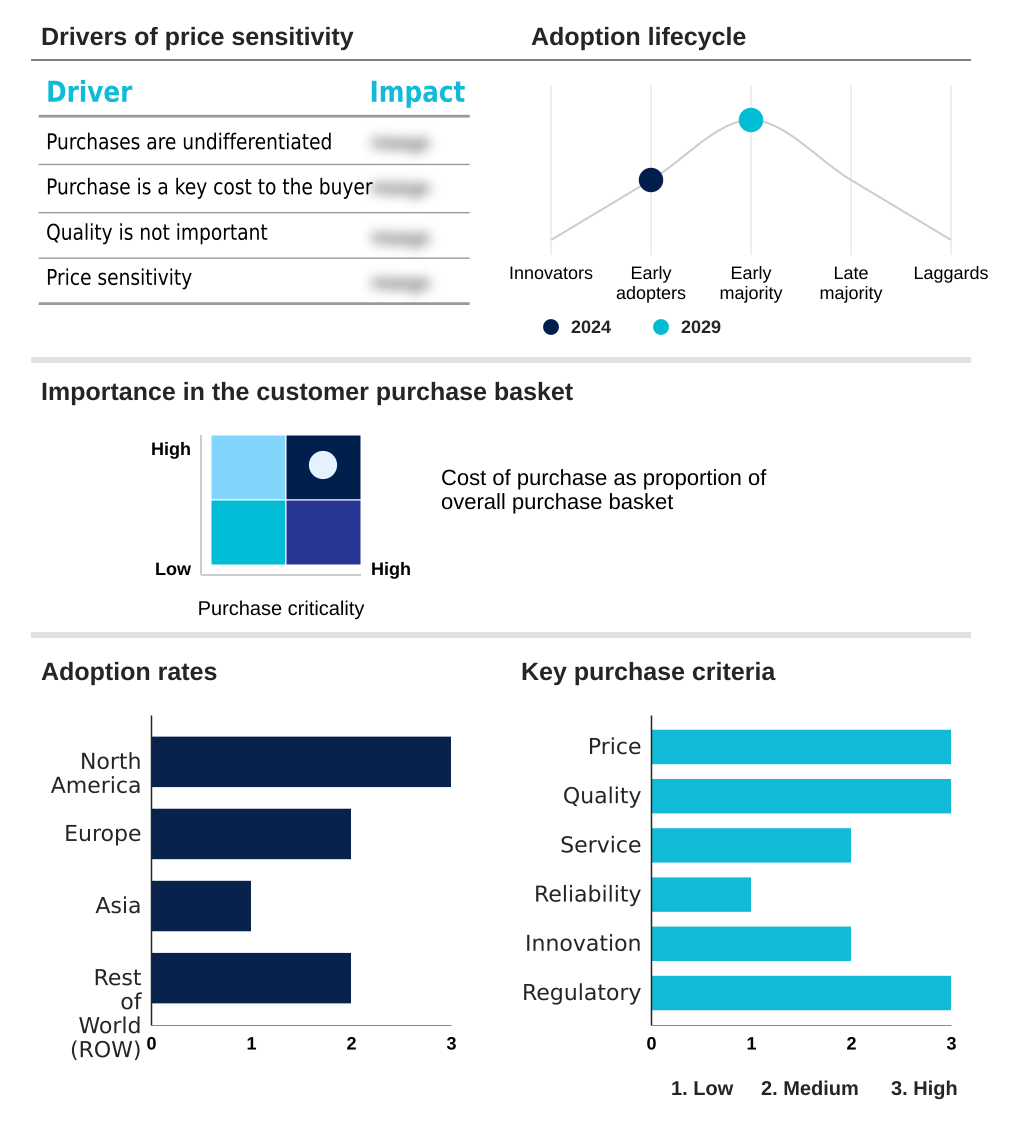
The blood glucose monitoring system market forecasting report includes the adoption lifecycle of the market, covering from the innovator’s stage to the laggard’s stage. It focuses on adoption rates in different regions based on penetration. Furthermore, the blood glucose monitoring system market report also includes key purchase criteria and drivers of price sensitivity to help companies evaluate and develop their market growth analysis strategies.
Customer Landscape of Blood Glucose Monitoring System Industry
Competitive Landscape
Companies are implementing various strategies, such as strategic alliances, blood glucose monitoring system market forecast, partnerships, mergers and acquisitions, geographical expansion, and product/service launches, to enhance their presence in the industry.
Abbott Laboratories - Offerings include advanced blood glucose monitoring systems, providing comprehensive features tailored to enhance diabetes management for diverse patient needs.
The industry research and growth report includes detailed analyses of the competitive landscape of the market and information about key companies, including:
- Abbott Laboratories
- ACON Laboratories Inc.
- ARKRAY Inc.
- B.Braun SE
- Dexcom Inc.
- DiaMonTech AG
- F. Hoffmann La Roche Ltd.
- GlySens Inc.
- i-SENS, Inc.
- Indigo Diabetes NV
- Intuity Medical Inc.
- Koninklijke Philips NV
- LifeScan IP Holdings LLC
- Medtronic Plc
- Nipro Corp.
- Ok Biotech Co Ltd.
- PHC Holdings Corp.
- Prodigy Diabetes Care LLC
- WaveForm Technologies Inc.
- Ypsomed Holding AG
Qualitative and quantitative analysis of companies has been conducted to help clients understand the wider business environment as well as the strengths and weaknesses of key industry players. Data is qualitatively analyzed to categorize companies as pure play, category-focused, industry-focused, and diversified; it is quantitatively analyzed to categorize companies as dominant, leading, strong, tentative, and weak.
Recent Development and News in Blood glucose monitoring system market
- In September 2024, Abbott Laboratories received CE Mark approval for its next-generation FreeStyle Libre 4 system, featuring a 21-day wear time and enhanced predictive alerts for hypoglycemic events.
- In November 2024, Medtronic Plc announced a strategic partnership with a leading digital health platform to integrate its Guardian continuous glucose monitoring data into a comprehensive chronic care management ecosystem.
- In January 2025, DiaMonTech AG initiated the first large-scale clinical trial in the US for its non-invasive glucose monitoring device, which uses mid-infrared laser technology to measure glucose levels through the skin.
- In April 2025, F. Hoffmann La Roche Ltd. completed the acquisition of a specialized AI-driven predictive analytics firm to enhance the data interpretation capabilities of its Accu-Chek line of blood glucose monitoring systems.
Dive into Technavio’s robust research methodology, blending expert interviews, extensive data synthesis, and validated models for unparalleled Blood Glucose Monitoring System Market insights. See full methodology.
| Market Scope | |
|---|---|
| Page number | 282 |
| Base year | 2024 |
| Historic period | 2019-2023 |
| Forecast period | 2025-2029 |
| Growth momentum & CAGR | Accelerate at a CAGR of 10% |
| Market growth 2025-2029 | USD 10140.0 million |
| Market structure | Fragmented |
| YoY growth 2024-2025(%) | 8.9% |
| Key countries | US, Canada, Mexico, Germany, UK, France, Italy, The Netherlands, Spain, Japan, China, India, South Korea, Indonesia, Australia, Brazil, Argentina, Colombia, Saudi Arabia, UAE, South Africa, Israel and Turkey |
| Competitive landscape | Leading Companies, Market Positioning of Companies, Competitive Strategies, and Industry Risks |
Research Analyst Overview
- The blood glucose monitoring system market is defined by a rapid evolution in biosensor technology, shifting from basic electrochemical sensor designs toward more sophisticated optical glucose sensing and enzymatic glucose sensor methods. This progression enhances glucose meter accuracy and underpins the expansion of both point-of-care testing and personal continuous glucose monitoring.
- Advanced systems now feature extensive data logging capabilities and seamless wireless data transmission, feeding into powerful diagnostic algorithms for refined glucose trend analysis. For corporate strategy, the integration of these data streams into remote patient monitoring platforms presents a pivotal decision point concerning cybersecurity investments and regulatory compliance.
- The development of closed-loop systems, which depend on flawless insulin pump integration and automated insulin delivery, is driving the technology forward. These integrated platforms demonstrate significant operational efficiencies, with some achieving up to a 40% reduction in the need for manual clinical interventions for hypoglycemic event detection.
- This shift transforms devices from simple measurement tools into critical components of proactive healthcare, leveraging interstitial fluid measurement and subcutaneous sensors to deliver actionable, real-time glucose data and support hyperglycemic alert systems.
What are the Key Data Covered in this Blood Glucose Monitoring System Market Research and Growth Report?
-
What is the expected growth of the Blood Glucose Monitoring System Market between 2025 and 2029?
-
USD 10.14 billion, at a CAGR of 10%
-
-
What segmentation does the market report cover?
-
The report is segmented by Product (Self monitoring, Continuous glucose monitoring devices), End-user (Hospitals, Home care, Diagnostic centers), Indication (Type-2 diabetes population, Type-1 diabetes population) and Geography (North America, Europe, Asia, Rest of World (ROW))
-
-
Which regions are analyzed in the report?
-
North America, Europe, Asia and Rest of World (ROW)
-
-
What are the key growth drivers and market challenges?
-
Availability of reimbursement for BGM devices, Lower diagnosis and treatment rate
-
-
Who are the major players in the Blood Glucose Monitoring System Market?
-
Abbott Laboratories, ACON Laboratories Inc., ARKRAY Inc., B.Braun SE, Dexcom Inc., DiaMonTech AG, F. Hoffmann La Roche Ltd., GlySens Inc., i-SENS, Inc., Indigo Diabetes NV, Intuity Medical Inc., Koninklijke Philips NV, LifeScan IP Holdings LLC, Medtronic Plc, Nipro Corp., Ok Biotech Co Ltd., PHC Holdings Corp., Prodigy Diabetes Care LLC, WaveForm Technologies Inc. and Ypsomed Holding AG
-
Market Research Insights
- Market dynamics are increasingly shaped by technologies that deliver quantifiable value in diabetes management. The use of an ambulatory glucose profile and the focus on the time-in-range metric are becoming standard for assessing glycemic control effectiveness. Advanced systems featuring predictive low glucose suspend capabilities demonstrate a direct impact on risk mitigation, a critical business outcome for both payers and providers.
- The integration of these features has led to a documented 25% improvement in time-in-range for many user groups. Furthermore, the shift toward a comprehensive glucose management indicator provides a more holistic view of a patient's condition than single-point measurements.
- This data-centric approach enhances clinical oversight and drives efficiency, with some digital health platforms reducing the need for manual data entry by over 90%, significantly improving return on investment for healthcare organizations.
We can help! Our analysts can customize this blood glucose monitoring system market research report to meet your requirements.
 RIA -
RIA - 
