Blow Molded Plastic Bottles Market Size 2026-2030
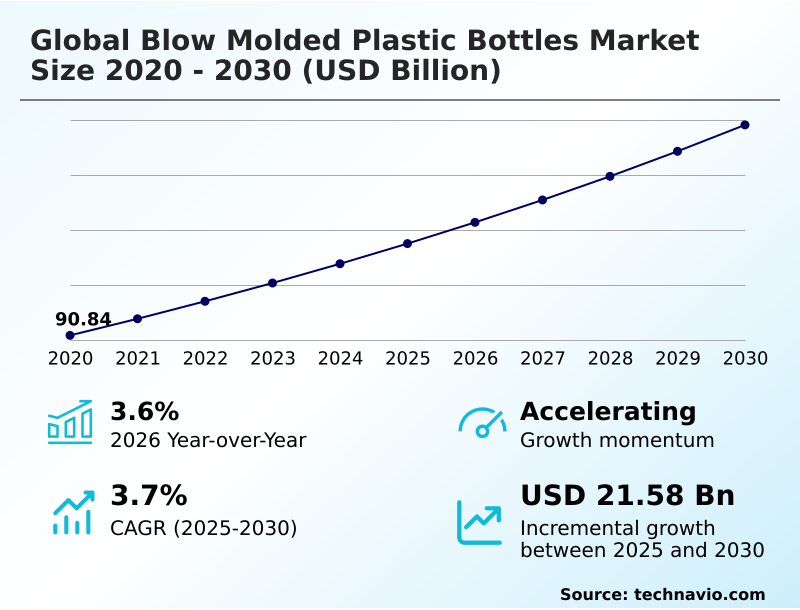
The blow molded plastic bottles market size is valued to increase by USD 21.58 billion, at a CAGR of 3.7% from 2025 to 2030. Surging demand from pharmaceutical and healthcare sectors will drive the blow molded plastic bottles market.
Major Market Trends & Insights
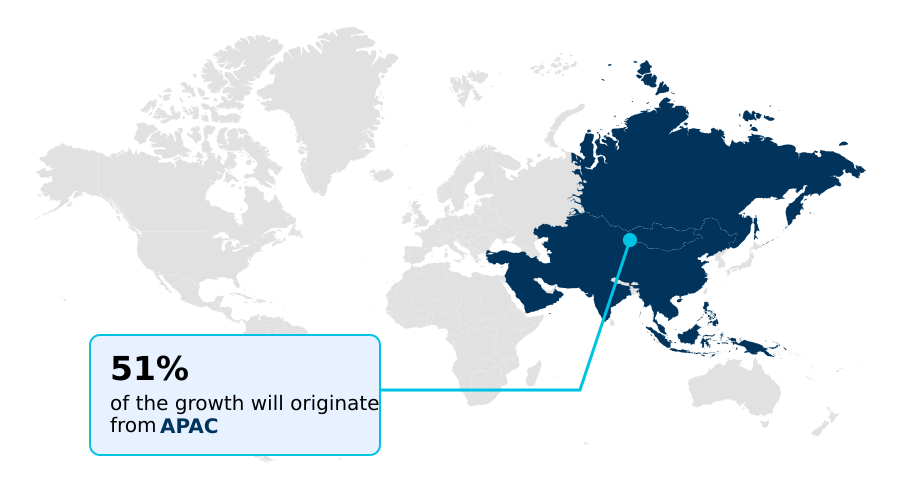
- APAC dominated the market and accounted for a 51.4% growth during the forecast period.
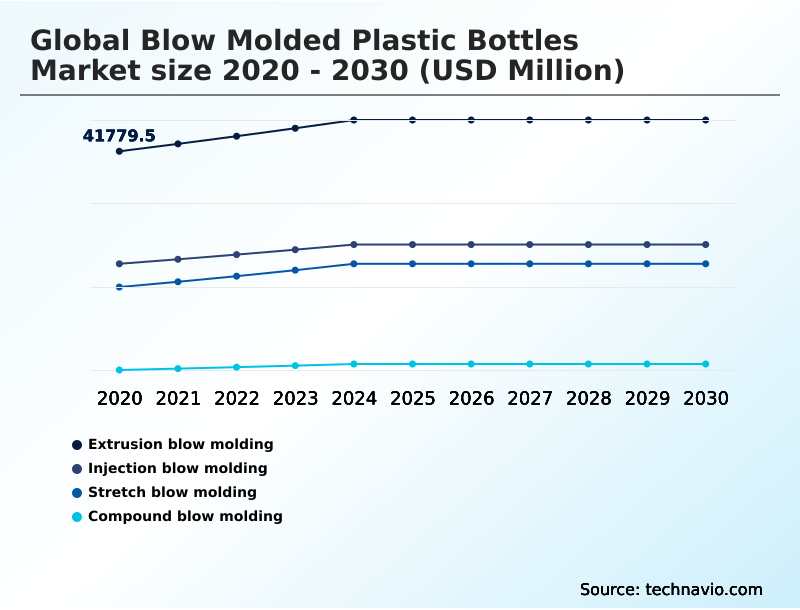
- By Technology - Extrusion blow molding segment was valued at USD 46.89 billion in 2024
- By End-user - Food and beverage segment accounted for the largest market revenue share in 2024
Market Size & Forecast
- Market Opportunities: USD 38.27 billion
- Market Future Opportunities: USD 21.58 billion
- CAGR from 2025 to 2030 : 3.7%
Market Summary
- The blow molded plastic bottles market is defined by its critical role in global supply chains, providing durable and lightweight packaging for diverse industries. Key end-users include the food and beverage, pharmaceutical, and household chemical sectors. The market's momentum is driven by continuous innovation in polymer science, enabling the creation of containers with superior barrier properties and impact strength.
- Technologies such as extrusion blow molding, injection blow molding, and stretch blow molding are constantly evolving to improve efficiency and accommodate a wider range of materials, including post-consumer recycled (pcr) resins. A significant trend is lightweighting, where container geometry is optimized to reduce plastic usage without sacrificing top-load strength, a critical factor in packaging supply chain optimization.
- For example, a beverage distributor can significantly lower freight costs by adopting bottles that are 10% lighter, enhancing overall operational excellence. However, the industry faces challenges from volatile raw material prices and stringent regulations promoting a circular economy for plastics. Success depends on balancing cost, performance, and sustainability, from preform design to final product.
- The focus on ergonomic design and custom color matching further highlights the need for sophisticated manufacturing capabilities to meet consumer expectations for both function and aesthetic appeal.
What will be the Size of the Blow Molded Plastic Bottles Market during the forecast period?
Get Key Insights on Market Forecast (PDF) Get Free Sample
How is the Blow Molded Plastic Bottles Market Segmented?
The blow molded plastic bottles industry research report provides comprehensive data (region-wise segment analysis), with forecasts and estimates in "USD million" for the period 2026-2030, as well as historical data from 2020-2024 for the following segments.
- Technology
- Extrusion blow molding
- Injection blow molding
- Stretch blow molding
- Compound blow molding
- End-user
- Food and beverage
- Personal care
- Household
- Others
- Type
- PET
- PE
- Others
- Geography
- APAC
- China
- India
- Japan
- Europe
- Germany
- UK
- France
- North America
- US
- Canada
- Mexico
- Middle East and Africa
- Turkey
- Saudi Arabia
- UAE
- South America
- Brazil
- Argentina
- Colombia
- Rest of World (ROW)
- APAC
By Technology Insights
The extrusion blow molding segment is estimated to witness significant growth during the forecast period.
Extrusion blow molding is a foundational manufacturing method, crucial for producing containers with integral handles and complex shapes common in household chemical and dairy applications.
This process uses parison programming to create a hollow tube that is inflated within a mold. The technology's adaptability to various polymers, especially high-density polyethylene (HDPE), makes it a versatile choice.
Modern advancements in resin flow control systems have significantly enhanced material distribution optimization, improving scrap material reduction and resource efficiency. For instance, precise automated adjustments have lowered material waste by up to 15% in high-volume production lines.
This focus on operational excellence and the ability to process post-consumer recycled (pcr) resins ensure its continued relevance in a market prioritizing sustainable packaging solutions and lightweight bottle manufacturing.
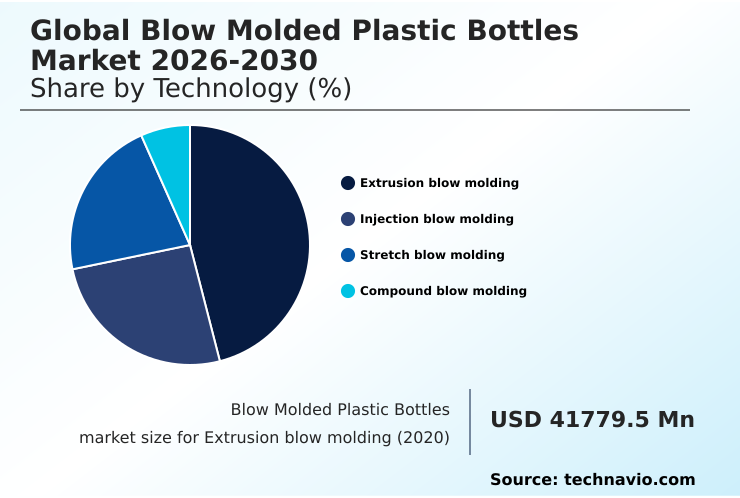
The Extrusion blow molding segment was valued at USD 46.89 billion in 2024 and showed a gradual increase during the forecast period.
Regional Analysis
APAC is estimated to contribute 51.4% to the growth of the global market during the forecast period.Technavio’s analysts have elaborately explained the regional trends and drivers that shape the market during the forecast period.
See How Blow Molded Plastic Bottles Market Demand is Rising in APAC Get Free Sample
The geographic landscape is characterized by varied regional dynamics.
APAC is the primary growth engine, contributing over 51% of the market's incremental growth, driven by massive consumption in the food and beverage and personal care sectors, which demand cost-effective HDPE milk jugs and PET water bottles.
This region's expansion, with a growth rate approaching 4.7%, contrasts with mature markets like Europe, which grows at a more modest 2.7%.
In North America, the focus is on technological innovation in injection blow molding and preform design to enhance material efficiency. This includes the use of finite element analysis for lightweighting, which has helped some producers reduce material use by 10-15%.
The demand for specialized industrial chemical packaging and custom bottle design is also strong in these developed regions.
Market Dynamics
Our researchers analyzed the data with 2025 as the base year, along with the key drivers, trends, and challenges. A holistic analysis of drivers will help companies refine their marketing strategies to gain a competitive advantage.
- Strategic decisions in the blow molded plastic bottles market often begin with evaluating the extrusion vs injection blow molding process, weighing capital costs against the need for neck finish precision. For high-volume applications, the benefits of stretch blow molding for beverages are clear, offering superior strength and clarity.
- A critical boardroom topic is how to increase pcr content in pet bottles to meet sustainability mandates without compromising performance, a goal that intersects with food-grade safety in recycled plastic bottles. This is complicated by the challenges in recycling multilayer plastic bottles, which often require specialized processing.
- Consequently, many firms are investing heavily in lightweighting technology for hdpe containers and enhancing the barrier properties of pet for food packaging. This involves optimizing blow molding machinery for custom shapes and improving bottle top-load strength for stacking, which is vital for supply chain logistics for rigid packaging.
- Navigating the impact of raw material prices on plastic bottles requires a thorough cost analysis of different blow molding techniques and a strategy for reducing energy consumption in blow molding. As the role of blow molded bottles in e-commerce grows, so does the need for robust hdpe bottle design for chemical resistance to prevent leaks.
- Firms must also address regulatory compliance for pharmaceutical plastic bottles and explore advancements in bio-based plastic bottle materials as sustainable alternatives to virgin plastic bottles.
- Optimizing parison control in extrusion molding and adhering to strict quality control standards for cosmetic packaging are non-negotiable for maintaining market leadership, especially when premium brands can see a greater return from investing in custom aesthetics than from minor material cost savings.
What are the key market drivers leading to the rise in the adoption of Blow Molded Plastic Bottles Industry?
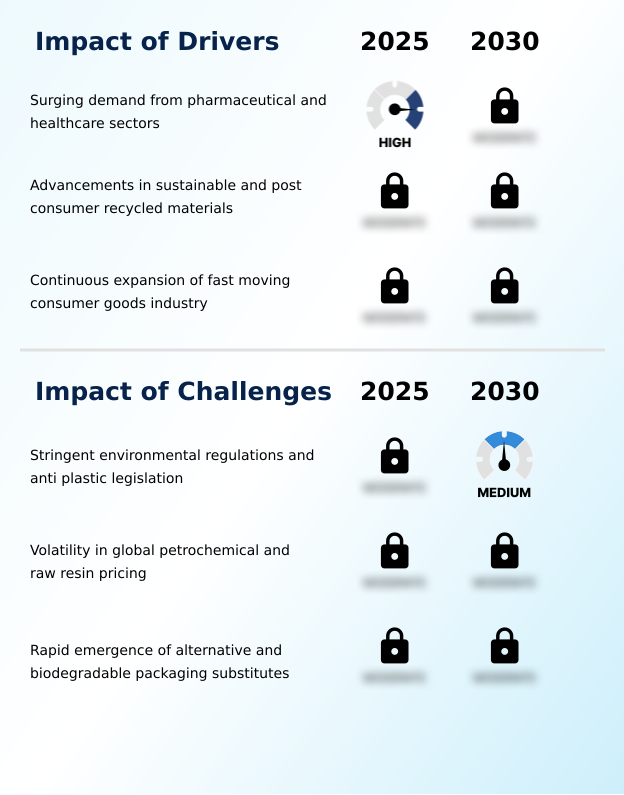
- Surging demand from the pharmaceutical and healthcare sectors for reliable and compliant packaging solutions is a key driver of market growth.
- Market momentum is driven by robust demand from the pharmaceutical and fast-moving consumer goods sectors, which require advanced beverage bottling technology and packaging.
- The expansion of the healthcare industry fuels the need for bottles with tamper-evident seals and child-resistant closures, produced with high neck finish precision.
- A major driver is the industry-wide adoption of the circular economy for plastics, which has led some firms to achieve PCR content verification levels exceeding 50%.
- This shift toward sustainable packaging solutions is supported by innovations in advanced polymer science that allow for the use of recycled PET (rpet) bottles and bio-based polymers without compromising chemical resistance.
- This commitment to closed-loop recycling systems is redefining material procurement strategies.
What are the market trends shaping the Blow Molded Plastic Bottles Industry?
- The integration of smart packaging solutions, including near-field communication and scannable codes, is an emerging trend. It transforms containers into interactive data points for enhanced traceability and consumer engagement.
- Key market trends are redefining rigid plastic packaging, with a strong focus on smart packaging integration and automation. Technologies like biaxial orientation in the stretch blow molding process are being enhanced with automated quality control. Robotic handling systems are performing high-speed inspections, improving surface blemish prevention and ensuring structural integrity.
- AI-driven analytics are optimizing the single-stage process, with some systems reducing defect identification times by 40%. The push for bespoke bottle shapes in cosmetic packaging design is driving innovation in container geometry. This shift toward supply chain transparency and advanced manufacturing is critical for maintaining a competitive edge and meeting the demand for pharmaceutical-grade plastic containers and other high-value applications.
What challenges does the Blow Molded Plastic Bottles Industry face during its growth?
- The implementation of stringent environmental regulations and widespread anti-plastic legislation presents a significant challenge to market expansion.
- Key challenges center on regulatory compliance management and economic pressures. Stringent environmental legislation mandates the use of food-grade recycled plastics and higher recycled content, complicating production. The volatility of petrochemical markets directly impacts raw material procurement, with resin prices fluctuating significantly and affecting the cost of polyethylene terephthalate (pet). This environment necessitates superior packaging supply chain optimization.
- Furthermore, the emergence of alternative packaging like flexible pouches and cartons creates a competitive threat. The technical complexities of the hot-fill process and ensuring aseptic filling standards with new, sustainable materials add another layer of difficulty for manufacturers focused on cycle time reduction and operational excellence, where unexpected material behavior can increase downtime by over 10%.
Exclusive Technavio Analysis on Customer Landscape
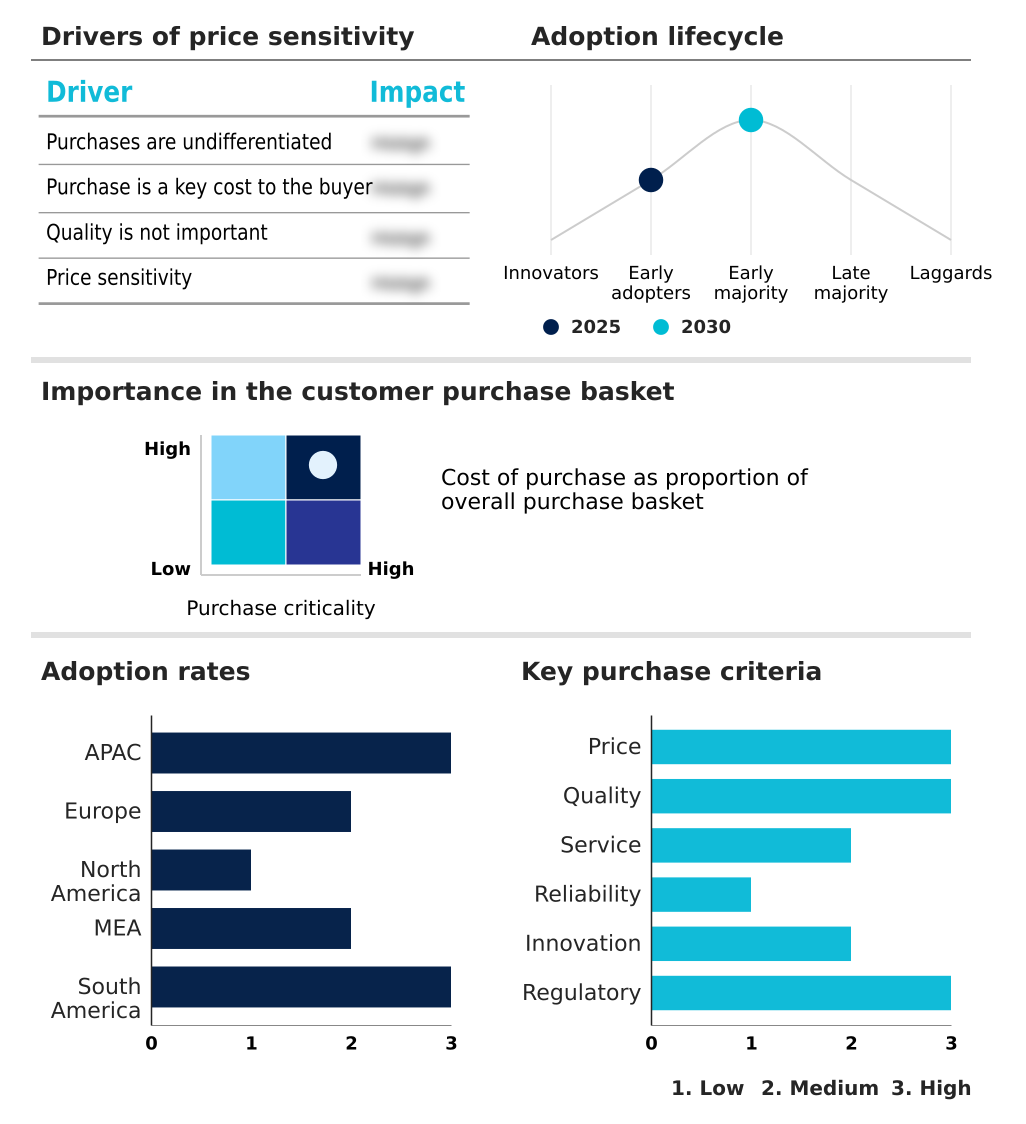
The blow molded plastic bottles market forecasting report includes the adoption lifecycle of the market, covering from the innovator’s stage to the laggard’s stage. It focuses on adoption rates in different regions based on penetration. Furthermore, the blow molded plastic bottles market report also includes key purchase criteria and drivers of price sensitivity to help companies evaluate and develop their market growth analysis strategies.
Customer Landscape of Blow Molded Plastic Bottles Industry
Competitive Landscape
Companies are implementing various strategies, such as strategic alliances, blow molded plastic bottles market forecast, partnerships, mergers and acquisitions, geographical expansion, and product/service launches, to enhance their presence in the industry.
Alpha Plastics Inc. - Offers sustainable extrusion and stretch blow molded plastic bottles and preforms with a heavy focus on lightweighting and post-consumer recycled content.
The industry research and growth report includes detailed analyses of the competitive landscape of the market and information about key companies, including:
- Alpha Plastics Inc.
- ALPLA
- Altium Packaging
- Amcor Plc
- AptarGroup Inc.
- CKS Packaging Inc.
- Comar LLC
- FirmaPak
- Gerresheimer AG
- Graham Packaging Co. LP
- Mauser Packaging Solutions
- Nampak Ltd.
- Parker Plastics
- Plastipak Holdings Inc.
- Pretium Packaging
- RESILUX NV
- Retal Industries LTD.
- Silgan Holdings Inc.
- Sonoco Products Co.
- Visy
Qualitative and quantitative analysis of companies has been conducted to help clients understand the wider business environment as well as the strengths and weaknesses of key industry players. Data is qualitatively analyzed to categorize companies as pure play, category-focused, industry-focused, and diversified; it is quantitatively analyzed to categorize companies as dominant, leading, strong, tentative, and weak.
Recent Development and News in Blow molded plastic bottles market
- In April 2025, Amcor plc finalized its all-stock merger with Berry Global, creating a dominant force in the global consumer and healthcare packaging market.
- In October 2025, Nissei ASB Machine Co. launched a new-generation injection stretch-blow molding system at the K 2025 exhibition, designed to enhance production efficiency for complex bottle designs.
- In October 2025, Biffa announced the full operational integration of its UK-based PET recycling division with PET preform manufacturer Esterform, creating a closed-loop circular packaging business.
- In February 2025, FirmaPak expanded its North American footprint by acquiring Easy Plastic Containers Corporation, a Canadian manufacturer of bottles for the health, food, and industrial sectors.
Dive into Technavio’s robust research methodology, blending expert interviews, extensive data synthesis, and validated models for unparalleled Blow Molded Plastic Bottles Market insights. See full methodology.
| Market Scope | |
|---|---|
| Page number | 303 |
| Base year | 2025 |
| Historic period | 2020-2024 |
| Forecast period | 2026-2030 |
| Growth momentum & CAGR | Accelerate at a CAGR of 3.7% |
| Market growth 2026-2030 | USD 21582.7 million |
| Market structure | Fragmented |
| YoY growth 2025-2026(%) | 3.6% |
| Key countries | China, India, Japan, South Korea, Indonesia, Australia, Germany, UK, France, Italy, Spain, The Netherlands, US, Canada, Mexico, Turkey, Saudi Arabia, UAE, South Africa, Israel, Brazil, Argentina and Colombia |
| Competitive landscape | Leading Companies, Market Positioning of Companies, Competitive Strategies, and Industry Risks |
Research Analyst Overview
- The blow molded plastic bottles market is evolving beyond simple container manufacturing into a highly technical field centered on polymer science and advanced engineering. Boardroom decisions are now intrinsically linked to material distribution optimization, lightweighting, and the integration of post-consumer recycled (pcr) resins to meet stringent environmental regulations.
- Mastering technologies like extrusion blow molding and stretch blow molding is fundamental, but competitive advantage comes from optimizing every stage of production. This includes sophisticated preform design, precise mold temperature control, and achieving superior biaxial orientation for enhanced top-load strength. Firms that leverage advanced resin flow control systems have reported up to a 15% improvement in production consistency.
- The industry is focused on delivering containers with excellent barrier properties, chemical resistance, and impact strength while also ensuring features like child-resistant closures. Achieving high neck finish precision in the injection blow molding process is crucial for high-value sectors.
- Ultimately, success hinges on balancing performance attributes like stress cracking resistance with the aesthetic demands for soft-touch finish and custom color matching, all while managing cycle time reduction and scrap material reduction.
What are the Key Data Covered in this Blow Molded Plastic Bottles Market Research and Growth Report?
-
What is the expected growth of the Blow Molded Plastic Bottles Market between 2026 and 2030?
-
USD 21.58 billion, at a CAGR of 3.7%
-
-
What segmentation does the market report cover?
-
The report is segmented by Technology (Extrusion blow molding, Injection blow molding, Stretch blow molding, and Compound blow molding), End-user (Food and beverage, Personal care, Household, and Others), Type (PET, PE, and Others) and Geography (APAC, Europe, North America, Middle East and Africa, South America)
-
-
Which regions are analyzed in the report?
-
APAC, Europe, North America, Middle East and Africa and South America
-
-
What are the key growth drivers and market challenges?
-
Surging demand from pharmaceutical and healthcare sectors , Stringent environmental regulations and anti plastic legislation
-
-
Who are the major players in the Blow Molded Plastic Bottles Market?
-
Alpha Plastics Inc., ALPLA, Altium Packaging, Amcor Plc, AptarGroup Inc., CKS Packaging Inc., Comar LLC, FirmaPak, Gerresheimer AG, Graham Packaging Co. LP, Mauser Packaging Solutions, Nampak Ltd., Parker Plastics, Plastipak Holdings Inc., Pretium Packaging, RESILUX NV, Retal Industries LTD., Silgan Holdings Inc., Sonoco Products Co. and Visy
-
Market Research Insights
- The market's dynamics are increasingly shaped by the dual imperatives of sustainability and operational excellence. The push for a circular economy for plastics is compelling manufacturers to prioritize pcr content verification and explore bio-based polymers. This shift has led to significant advancements in processing recycled PET (rpet) bottles, with some advanced facilities achieving over 98% material utilization rates.
- Concurrently, automated quality control and robotic handling systems are driving efficiency gains; automated inspection, for instance, has reduced defect rates related to stress cracking resistance by more than 20% compared to manual methods. Finite element analysis is now standard for optimizing preform design, enabling lightweighting initiatives that lower material consumption.
- These technological adoptions are crucial for effective regulatory compliance management and maintaining profitability amid fluctuating raw material procurement costs, ensuring both resource efficiency and market competitiveness.
We can help! Our analysts can customize this blow molded plastic bottles market research report to meet your requirements.
 RIA -
RIA - 
