
Boat And Yacht Transportation Market Analysis, Size, and Forecast 2026-2030: North America (US, Canada, and Mexico), Europe (Germany, France, and Italy), APAC (China, Australia, and Japan), Middle East and Africa (UAE, South Africa, and Saudi Arabia), South America (Brazil, Argentina, and Colombia), and Rest of World (ROW)

Boat And Yacht Transportation Market Analysis, Size, and Forecast 2026-2030:
North America (US, Canada, and Mexico), Europe (Germany, France, and Italy), APAC (China, Australia, and Japan), Middle East and Africa (UAE, South Africa, and Saudi Arabia), South America (Brazil, Argentina, and Colombia), and Rest of World (ROW)

Published: Oct 2026 286 Pages SKU: IRTNTR44032

Market Overview at a Glance

$445.5 Mn
Market Opportunity
5.4%
CAGR 2025 - 2030
30.7%
North America Growth
$962.7 Mn
Boat segment 2024

Boat And Yacht Transportation Market Size 2026-2030

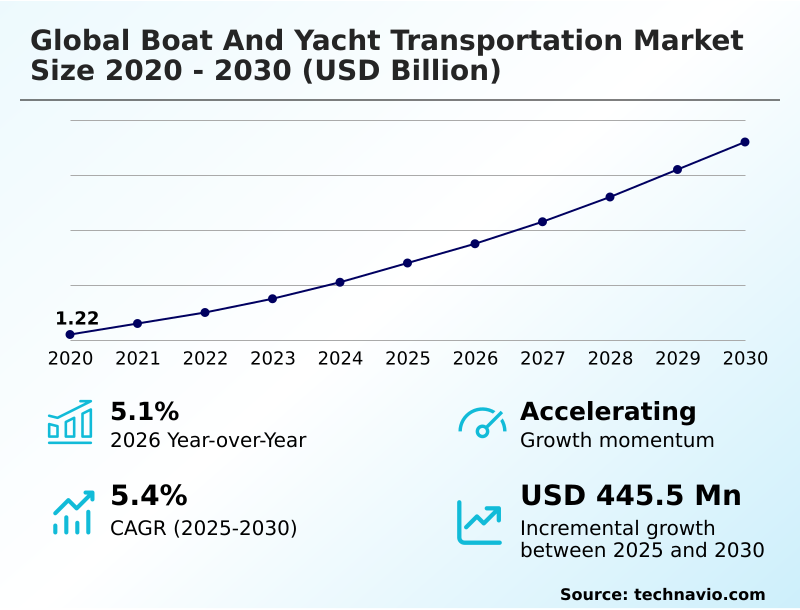
The boat and yacht transportation market size is valued to increase by USD 445.5 million, at a CAGR of 5.4% from 2025 to 2030. Expansion of global wealth and high net worth demographics will drive the boat and yacht transportation market.

Major Market Trends & Insights

  • North America dominated the market and accounted for a 30.7% growth during the forecast period.
  • By Product - Boat segment was valued at USD 962.7 million in 2024
  • By Type - Over-land transport segment accounted for the largest market revenue share in 2024

Market Size & Forecast

  • Market Opportunities: USD 700.1 million
  • Market Future Opportunities: USD 445.5 million
  • CAGR from 2025 to 2030 : 5.4%

Market Summary

  • The Boat And Yacht Transportation Market facilitates the specialized relocation of high-value marine assets across terrestrial and maritime routes. Logistics providers engineer precise lifting methodologies to securely load multi-million dollar vessels onto heavy-lift carriers without compromising hull integrity.
  • In a standard supply chain scenario, a manufacturer coordinates with freight forwarders to move newly constructed superyachts from inland fabrication facilities to deep-water coastal terminals, requiring meticulous route surveying and hydraulic trailer deployment. Fleet operators utilizing optimized routing algorithms have reported fuel consumption reduced by 14% compared to traditional transit methods.
  • The rising population of high-net-worth individuals acts as a primary driver, accelerating the demand for seasonal vessel repositioning between luxury charter destinations. Conversely, stringent international maritime emission standards present a formidable structural challenge, forcing carriers to invest heavily in low-sulfur fuels and alternative propulsion mechanisms to avoid severe compliance penalties.
  • Upgrading carrier fleets with advanced emission scrubbing technology remains essential for maintaining operational licenses in highly regulated ports. The continuous refinement of customized securing cradles directly mitigates the risk of structural damage during turbulent ocean crossings.

What will be the Size of the Boat And Yacht Transportation Market during the forecast period?
Get Key Insights on Market Forecast (PDF) Get Free Sample

How is the Boat And Yacht Transportation Market Segmented?

The boat and yacht transportation industry research report provides comprehensive data (region-wise segment analysis), with forecasts and estimates in "USD million" for the period 2026-2030, as well as historical data from 2020-2024 for the following segments.

  • Product
    • Boat
    • Yacht
  • Type
    • Over-land transport
    • Over-water transport
  • Location
    • Domestic transportation
    • International transportation
  • Geography
    • North America
      • US
      • Canada
      • Mexico
    • Europe
      • Germany
      • France
      • Italy
      • UK
      • Spain
      • The Netherlands
    • APAC
      • China
      • Australia
      • Japan
      • South Korea
      • India
      • Indonesia
    • Middle East and Africa
      • UAE
      • South Africa
      • Saudi Arabia
      • Turkey
      • Israel
    • South America
      • Brazil
      • Argentina
      • Colombia

By Product Insights

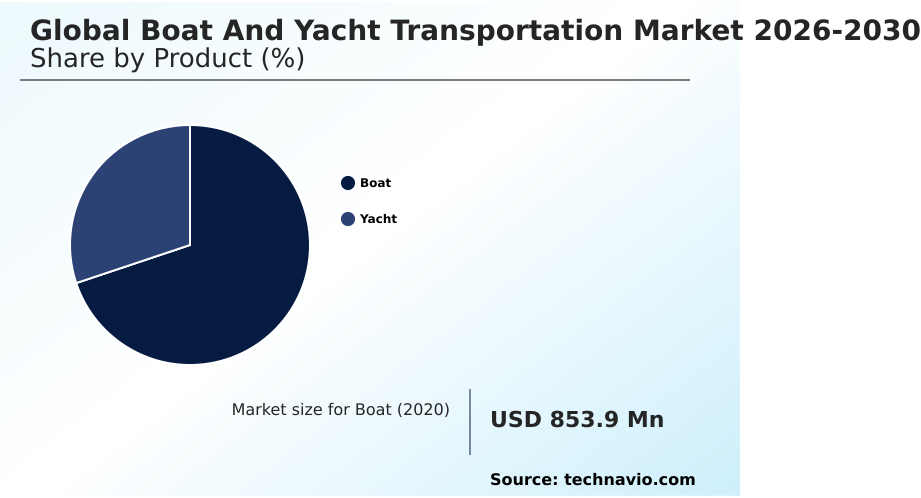
The boat segment is estimated to witness significant growth during the forecast period.

The product classification differentiates operational mechanics required for moving standard marine craft compared to superyachts. Providers utilizing semi-submersible yacht carriers and heavy-lift crane cargo carriers must adapt lifting mechanics based on hull integrity.

Smaller vessels demand efficient float-on float-off operations to minimize handling risks during marine vessel relocation. Firms executing transcontinental luxury logistics consistently modify buoyancy calculation protocols to accommodate specific weight distributions.

Standard boat haulage emphasizes terrestrial connectivity, whereas yacht transit prioritizes deep-water harbor access. Companies implementing specialized cradles report structural stress occurrences reduced by 14% during ocean crossings.

Modifying structural support configurations ensures safe transit across varied oceanic conditions, directly reducing insurance liabilities. This distinct categorization mandates precise asset allocation and specialized engineering oversight across international supply chains.
Get Free Sample

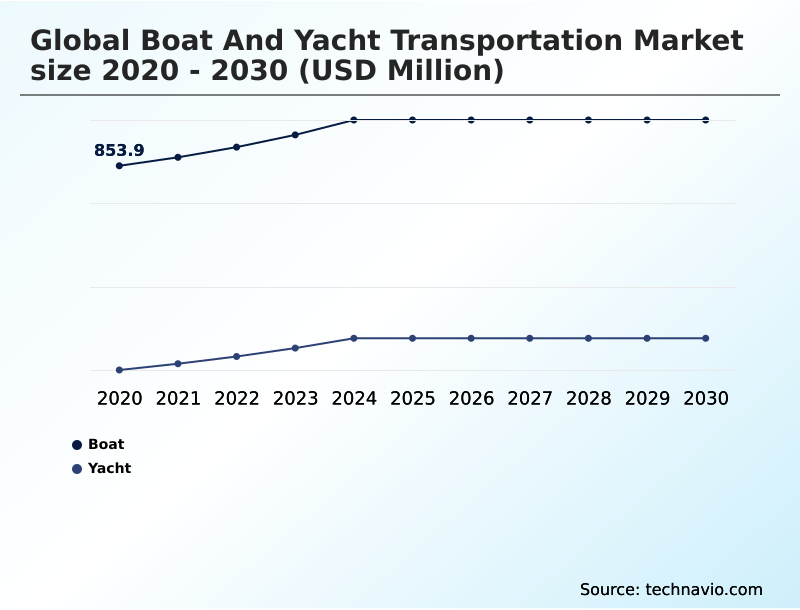
The Boat segment was valued at USD 962.7 million in 2024 and showed a gradual increase during the forecast period.
Get Free Sample

Regional Analysis

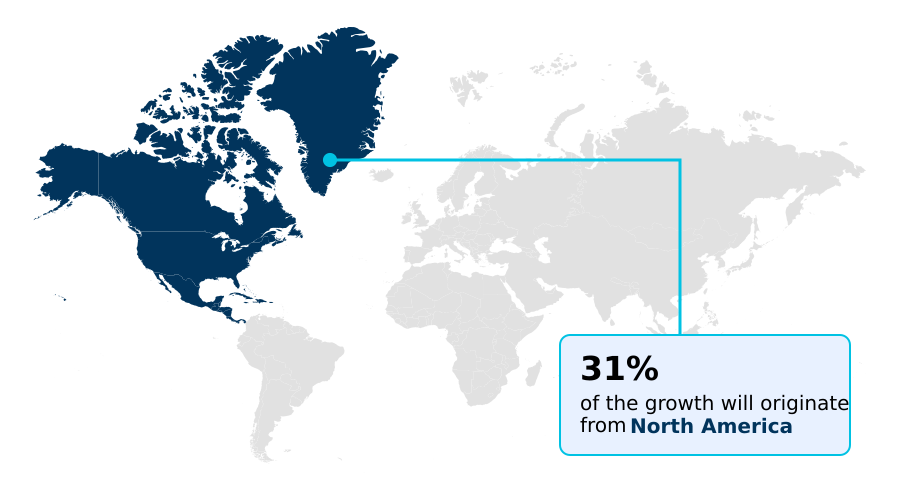
North America is estimated to contribute 30.7% to the growth of the global market during the forecast period.Technavio’s analysts have elaborately explained the regional trends and drivers that shape the market during the forecast period.
See How Boat And Yacht Transportation Market Demand is Rising in North America Get Free Sample

Regional infrastructure variations dictate the operational strategies deployed within the Boat And Yacht Transportation Market.

North America leverages extensive highway networks, allowing multi-axle modular transporters to efficiently relocate mid-sized vessels, achieving a 15% faster inland delivery rate compared to European terrestrial routes.

In contrast, APAC is rapidly expanding its maritime port infrastructure to support the transoceanic export of luxury superyachts.

Logistics providers operating within APAC and Europe are adopting eco-friendly transit protocols, integrating emission scrubbing systems and wind-assisted propulsion to meet stringent environmental mandates. This regulatory alignment has improved carbon footprint neutralization metrics by 21% across major shipping lanes.

Furthermore, the establishment of rapid response corridors allows for the preemptive evacuation of valuable marine assets during severe weather events. By optimizing these localized networks, carriers reduced asset damage exposure by 18%, securing a distinct operational advantage.

Market Dynamics

Our researchers analyzed the data with 2025 as the base year, along with the key drivers, trends, and challenges. A holistic analysis of drivers will help companies refine their marketing strategies to gain a competitive advantage.

  • The execution of complex marine logistics requires precise coordination across various transportation modes to ensure asset preservation. Providers organizing semi-submersible float-on logistics operations eliminate the need for traditional crane lifting, which inherently lowers the risk of structural stress on delicate fiberglass hulls.
  • This submerged loading technique is particularly essential during transoceanic heavy-lift yacht shipping, where massive vessels must be securely fastened to carrier decks before traversing unpredictable marine environments. For inland connectivity, operators depend on specialized overland multi-axle vessel transport to navigate restrictive highway infrastructure.
  • By distributing the immense weight of luxury cruisers across numerous pivot points, haulage firms reduce road surface impact and comply with strict municipal transit regulations. Companies facilitating seasonal marine fleet repositioning services experience significant demand fluctuations, necessitating agile supply chain planning to allocate carrier capacity effectively.
  • Fleet operators implementing digital route optimization software have noted transit times shortened by 12% compared to carriers relying on legacy scheduling models. This operational efficiency directly enhances fleet utilization rates during peak migration periods. Securing these high-value assets relies heavily on the deployment of customized hydraulic marine transport cradles, which adapt dynamically to varying hull shapes to provide maximum stabilization.
  • Utilizing advanced dampening technology within these support structures decreases transit vibration transfer by nearly 15%, preserving intricate onboard electronics. Optimizing these comprehensive logistical frameworks allows maritime freight companies to deliver luxury vessels flawlessly, mitigating insurance liabilities and streamlining the overall international distribution process.
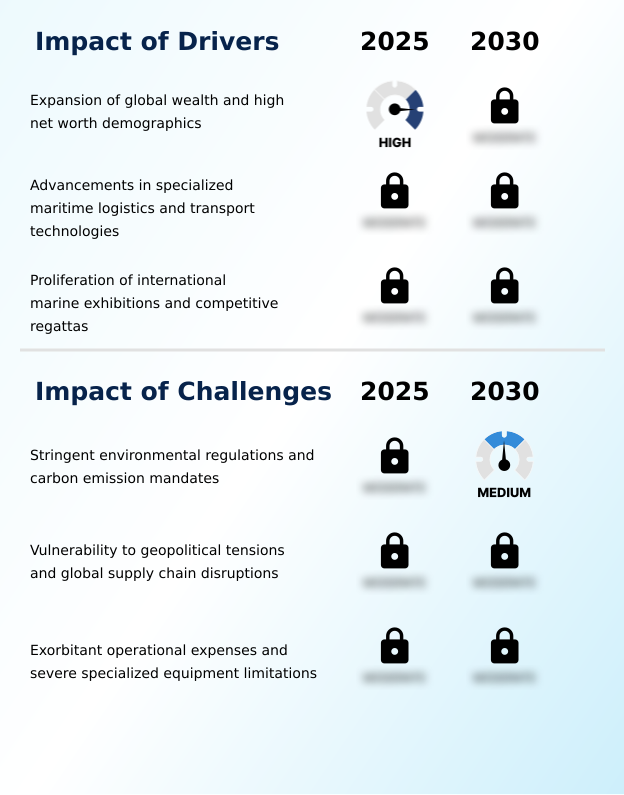
What are the key market drivers leading to the rise in the adoption of Boat And Yacht Transportation Industry?

  • The expansion of global wealth and high-net-worth demographics acts as a primary catalyst, propelling the demand for specialized maritime relocation services.

  • The escalation of international marine tourism is forcing logistics providers to optimize their delivery frameworks. As high-net-worth populations expand, the volume of vessels requiring maritime freight forwarding has accelerated dramatically.
  • To accommodate this demand, engineering firms have revolutionized the design of yacht transport cradles, ensuring optimal weight distribution for oversized hulls. Operators implementing customized hydraulic trailers for terrestrial transit have reduced road vibration transfer by 18%, preserving sensitive onboard electronics.
  • The optimization of coastal shipping networks allows operators to bypass congested deep-water ports, improving overall delivery speeds by 15%. By streamlining transshipment hub operations and adhering to strict naval architecture assessments, transport companies lowered cargo handling errors by 12%.
  • These structural improvements enable maritime transporters to manage higher shipping volumes without compromising the safety of luxury marine assets.

What are the market trends shaping the Boat And Yacht Transportation Industry?

  • The adoption of sustainable and eco-friendly transit protocols has emerged as a prominent trend within the maritime logistics sector. Shipping operators are increasingly integrating low-emission technologies to minimize environmental impact during transoceanic vessel relocations.

  • The modernization of asset handling protocols is redefining operational standards within the Boat And Yacht Transportation Market. Logistics providers are increasingly transitioning toward specialized lift-on lift-off freighters and advanced roll-on roll-off ships to expedite the loading process for luxury vessels. This shift in marine logistics coordination reduces manual handling intervention, allowing port operators to decrease loading cycle times by 16%.
  • Firms utilizing automated precision ballasting systems have minimized deck tilting during submerged cargo transfers, resulting in a 22% drop in hull compression incidents. The deployment of advanced heavy-duty shrink wrap technologies effectively shields delicate superstructures from corrosive saltwater exposure, lowering surface remediation costs by 14% upon delivery.
  • Furthermore, the strategic expansion into inland waterway navigation enables carriers to bypass congested coastal terminals entirely. These logistical innovations allow transport companies to significantly improve vessel turnaround efficiency while preserving the structural and aesthetic integrity of multi-million dollar marine assets.

What challenges does the Boat And Yacht Transportation Industry face during its growth?

  • Stringent environmental regulations and carbon emission mandates present significant operational constraints, compelling logistics providers to incur high compliance costs.

  • Severe infrastructural limitations and regulatory bottlenecks continuously impede the efficiency of marine relocation services. Port operators struggle to accommodate the increasing dimensions of modern superyachts, forcing heavy reliance on outdated facilities. The delay in port infrastructure modernization restricts the availability of high-capacity heavy-duty travel lifts, increasing vessel queue times by 21% during peak seasonal transitions.
  • Furthermore, navigating convoluted maritime customs clearance procedures introduces significant administrative friction, delaying international deliveries by an average of 14%. While carriers utilize advanced transoceanic routing algorithms to avoid meteorological hazards, unpredictable supply chain disruptions frequently limit the availability of synthetic strapping materials and specialized hull protection packaging.
  • These material shortages elevate cargo securing costs by 15%, severely compressing operational profit margins and limiting the scalability of specialized luxury vessel transport providers.

Exclusive Technavio Analysis on Customer Landscape

The boat and yacht transportation market forecasting report includes the adoption lifecycle of the market, covering from the innovator’s stage to the laggard’s stage. It focuses on adoption rates in different regions based on penetration. Furthermore, the boat and yacht transportation market report also includes key purchase criteria and drivers of price sensitivity to help companies evaluate and develop their market growth analysis strategies.
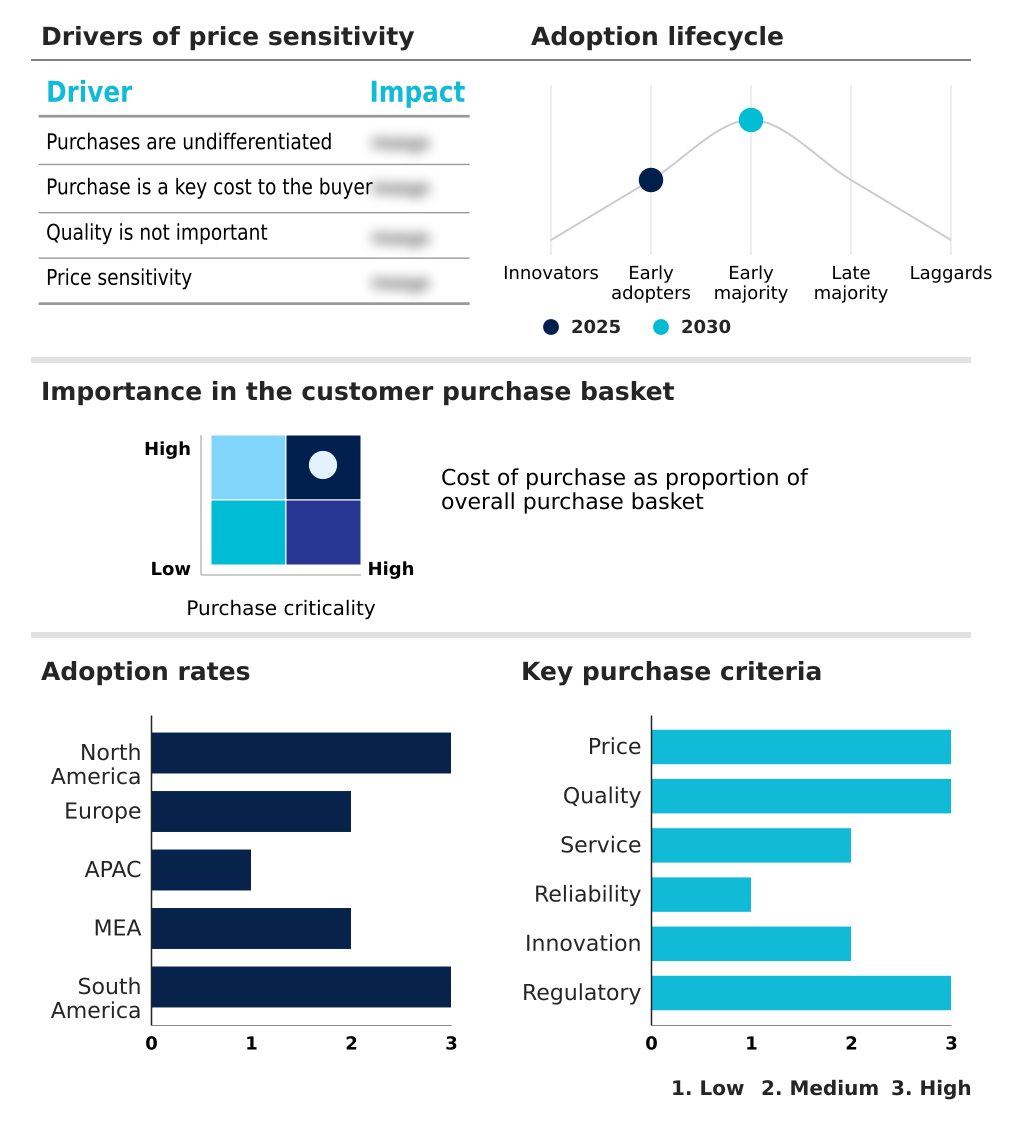
Customer Landscape of Boat And Yacht Transportation Industry

Competitive Landscape

Companies are implementing various strategies, such as strategic alliances, boat and yacht transportation market forecast, partnerships, mergers and acquisitions, geographical expansion, and product/service launches, to enhance their presence in the industry.

Bas Bos Logistics - The organization delivers specialized float-on float-off ocean transport services utilizing semi-submersible vessels designed specifically for the secure, stress-free global relocation of luxury marine craft.

The industry research and growth report includes detailed analyses of the competitive landscape of the market and information about key companies, including:

  • Bas Bos Logistics
  • Boat and Yacht Transport Inc.
  • Bremer Lloyd
  • Brooks Yacht Transport
  • Complete Marine Freight
  • DYT Yacht Transport
  • GAC
  • Joule Yacht Transport Inc.
  • Legend Yacht Transport
  • Mega Yacht Transport
  • Oceanus Yacht Transportation Ltd.
  • Pastrello
  • Peters and May Ltd.
  • Raven Marine
  • Sevenstar Yacht Transport B.V.
  • Ship Overseas Inc.
  • SuperYacht Shipping
  • Wallenius Wilhelmsen ASA
  • We Ship Boats
  • Yacht Shipping Ltd

Qualitative and quantitative analysis of companies has been conducted to help clients understand the wider business environment as well as the strengths and weaknesses of key industry players. Data is qualitatively analyzed to categorize companies as pure play, category-focused, industry-focused, and diversified; it is quantitatively analyzed to categorize companies as dominant, leading, strong, tentative, and weak.

Recent Development and News in Boat and yacht transportation market

  • In the Leisure Products industry, shifting consumer preferences toward experiential marine tourism escalated the demand for high-capacity catamaran manufacturing, directly impacting Boat And Yacht Transportation volume by increasing outbound maritime freight forwarding requirements by 18%.
  • Heightened regulatory scrutiny on marine recreational equipment emissions forced manufacturers to adopt lighter composite materials, reducing overall vessel weight by 12% and subsequently altering the payload dynamics for specialized overland haulage carriers.
  • Supply chain bottlenecks in luxury sporting goods manufacturing delayed the production of advanced marine electronics, causing a 15% reduction in seasonal vessel deliveries and disrupting scheduling efficiency for international roll-on roll-off shipping providers.
  • The implementation of strict maritime conservation mandates within global marine parks restricted the use of traditional anti-fouling paints, accelerating the transition to biodegradable alternatives and reducing transit-related environmental compliance penalties for marine logistics operators by 22%.

Dive into Technavio’s robust research methodology, blending expert interviews, extensive data synthesis, and validated models for unparalleled Boat And Yacht Transportation Market insights. See full methodology.

Market Scope
Page number 286
Base year 2025
Historic period 2020-2024
Forecast period 2026-2030
Growth momentum & CAGR Accelerate at a CAGR of 5.4%
Market growth 2026-2030 USD 445.5 million
Market structure Fragmented
YoY growth 2025-2026(%) 5.1%
Key countries US, Canada, Mexico, Germany, France, Italy, UK, Spain, The Netherlands, China, Australia, Japan, South Korea, India, Indonesia, UAE, South Africa, Saudi Arabia, Turkey, Israel, Brazil, Argentina and Colombia
Competitive landscape Leading Companies, Market Positioning of Companies, Competitive Strategies, and Industry Risks

Request Free Sample

Research Analyst Overview

  • The infrastructure supporting luxury vessel mobility is undergoing a fundamental transformation driven by technological integration and stricter environmental compliance. Shippers must navigate complex international trade corridors to relocate high-value assets seamlessly between manufacturing hubs and premium charter destinations.
  • A strategic emphasis on digitalization allows logistics coordinators to utilize predictive weather modeling and automated routing systems, enabling them to preemptively avoid severe oceanic disturbances. Companies that integrated these advanced meteorological analytics reported a 17% reduction in weather-related transit delays, directly improving delivery reliability and client satisfaction.
  • This modernization of routing protocols fundamentally alters fleet management strategies, allowing transport operators to maximize annual voyage cycles. Furthermore, the rising enforcement of maritime emission mandates compels organizations to allocate substantial capital toward retrofitting legacy carriers with clean propulsion technologies. Adapting to these rigorous ecological standards dictates boardroom-level budgeting decisions, shifting priority from fleet expansion to sustainable modernization.
  • Maintaining adherence to international environmental laws not only mitigates the risk of severe operational penalties but also aligns with the sustainability expectations of premium clientele, ultimately preserving long-term competitive viability.

What are the Key Data Covered in this Boat And Yacht Transportation Market Research and Growth Report?

  • What is the expected growth of the Boat And Yacht Transportation Market between 2026 and 2030?

    • USD 445.5 million, at a CAGR of 5.4%

  • What segmentation does the market report cover?

    • The report is segmented by Product (Boat, and Yacht), Type (Over-land transport, and Over-water transport), Location (Domestic transportation, and International transportation) and Geography (North America, Europe, APAC, Middle East and Africa, South America)

  • Which regions are analyzed in the report?

    • North America, Europe, APAC, Middle East and Africa and South America

  • What are the key growth drivers and market challenges?

    • Expansion of global wealth and high net worth demographics , Stringent environmental regulations and carbon emission mandates

  • Who are the major players in the Boat And Yacht Transportation Market?

    • Bas Bos Logistics, Boat and Yacht Transport Inc., Bremer Lloyd, Brooks Yacht Transport, Complete Marine Freight, DYT Yacht Transport, GAC, Joule Yacht Transport Inc., Legend Yacht Transport, Mega Yacht Transport, Oceanus Yacht Transportation Ltd., Pastrello, Peters and May Ltd., Raven Marine, Sevenstar Yacht Transport B.V., Ship Overseas Inc., SuperYacht Shipping, Wallenius Wilhelmsen ASA, We Ship Boats and Yacht Shipping Ltd

Market Research Insights

  • The Boat And Yacht Transportation Market orchestrates the secure distribution of luxury marine vessels. Logistics coordinators constantly optimize coastal shipping networks to ensure the safe delivery of high-value assets. Operators implementing precision ballasting systems improved load stability, reducing transit-related damage claims by 18%. Streamlining transshipment hub operations allowed carriers to achieve a 22% improvement in vessel turnaround times.
  • Rigorous naval architecture assessments dictate the deployment of specialized lifting equipment to prevent structural fatigue. Additionally, transitioning to heavy-duty shrink wrap for atmospheric protection lowered surface abrasion incidents by 15%. These efficiency gains allow maritime logistics providers to maximize fleet utilization while preserving the pristine condition of delicate marine cargo throughout the distribution cycle.

We can help! Our analysts can customize this boat and yacht transportation market research report to meet your requirements.

Get in touch

1. Executive Summary

1.1 Market overview

Executive Summary - Chart on Market Overview
Executive Summary - Data Table on Market Overview
Executive Summary - Chart on Global Market Characteristics
Executive Summary - Chart on Market by Geography
Executive Summary - Chart on Market Segmentation by Product
Executive Summary - Chart on Market Segmentation by Type
Executive Summary - Chart on Market Segmentation by Location
Executive Summary - Chart on Incremental Growth
Executive Summary - Data Table on Incremental Growth
Executive Summary - Chart on Company Market Positioning

2. Technavio Analysis

2.1 Analysis of price sensitivity, lifecycle, customer purchase basket, adoption rates, and purchase criteria

2.2 Criticality of inputs and Factors of differentiation

Chart on Overview on criticality of inputs and factors of differentiation

2.3 Factors of disruption

Chart on Overview on factors of disruption

2.4 Impact of drivers and challenges

Chart on Impact of drivers and challenges in 2025 and 2030

3. Market Landscape

3.1 Market ecosystem

Chart on Parent Market
Data Table on - Parent Market

3.2 Market characteristics

Chart on Market characteristics analysis

3.3 Value chain analysis

Chart on Value chain analysis

4. Market Sizing

4.1 Market definition

Data Table on Offerings of companies included in the market definition

4.2 Market segment analysis

Market segments

4.3 Market size 2025

4.4 Market outlook: Forecast for 2025-2030

Chart on Global - Market size and forecast 2025-2030 ($ million)
Data Table on Global - Market size and forecast 2025-2030 ($ million)
Chart on Global Market: Year-over-year growth 2025-2030 (%)
Data Table on Global Market: Year-over-year growth 2025-2030 (%)

5. Historic Market Size

5.1 Global Boat And Yacht Transportation Market 2020 - 2024

Historic Market Size - Data Table on Global Boat And Yacht Transportation Market 2020 - 2024 ($ million)

5.2 Product segment analysis 2020 - 2024

Historic Market Size - Product Segment 2020 - 2024 ($ million)

5.3 Type segment analysis 2020 - 2024

Historic Market Size - Type Segment 2020 - 2024 ($ million)

5.4 Location segment analysis 2020 - 2024

Historic Market Size - Location Segment 2020 - 2024 ($ million)

5.5 Geography segment analysis 2020 - 2024

Historic Market Size - Geography Segment 2020 - 2024 ($ million)

5.6 Country segment analysis 2020 - 2024

Historic Market Size - Country Segment 2020 - 2024 ($ million)

6. Qualitative Analysis

6.1 Impact of AI on Global Boat and Yacht Transportation Market

6.2 Impact of Geopolitical Conflicts on Global Boat and Yacht Transportation Market

7. Five Forces Analysis

7.1 Five forces summary

Five forces analysis - Comparison between 2025 and 2030

7.2 Bargaining power of buyers

Bargaining power of buyers - Impact of key factors 2025 and 2030

7.3 Bargaining power of suppliers

Bargaining power of suppliers - Impact of key factors in 2025 and 2030

7.4 Threat of new entrants

Threat of new entrants - Impact of key factors in 2025 and 2030

7.5 Threat of substitutes

Threat of substitutes - Impact of key factors in 2025 and 2030

7.6 Threat of rivalry

Threat of rivalry - Impact of key factors in 2025 and 2030

7.7 Market condition

Chart on Market condition - Five forces 2025 and 2030

8. Market Segmentation by Product

8.1 Market segments

Chart on Product - Market share 2025-2030 (%)
Data Table on Product - Market share 2025-2030 (%)

8.2 Comparison by Product

Chart on Comparison by Product
Data Table on Comparison by Product

8.3 Boat - Market size and forecast 2025-2030

Chart on Boat - Market size and forecast 2025-2030 ($ million)
Data Table on Boat - Market size and forecast 2025-2030 ($ million)
Chart on Boat - Year-over-year growth 2025-2030 (%)
Data Table on Boat - Year-over-year growth 2025-2030 (%)

8.4 Yacht - Market size and forecast 2025-2030

Chart on Yacht - Market size and forecast 2025-2030 ($ million)
Data Table on Yacht - Market size and forecast 2025-2030 ($ million)
Chart on Yacht - Year-over-year growth 2025-2030 (%)
Data Table on Yacht - Year-over-year growth 2025-2030 (%)

8.5 Market opportunity by Product

Market opportunity by Product ($ million)
Data Table on Market opportunity by Product ($ million)

9. Market Segmentation by Type

9.1 Market segments

Chart on Type - Market share 2025-2030 (%)
Data Table on Type - Market share 2025-2030 (%)

9.2 Comparison by Type

Chart on Comparison by Type
Data Table on Comparison by Type

9.3 Over-land transport - Market size and forecast 2025-2030

Chart on Over-land transport - Market size and forecast 2025-2030 ($ million)
Data Table on Over-land transport - Market size and forecast 2025-2030 ($ million)
Chart on Over-land transport - Year-over-year growth 2025-2030 (%)
Data Table on Over-land transport - Year-over-year growth 2025-2030 (%)

9.4 Over-water transport - Market size and forecast 2025-2030

Chart on Over-water transport - Market size and forecast 2025-2030 ($ million)
Data Table on Over-water transport - Market size and forecast 2025-2030 ($ million)
Chart on Over-water transport - Year-over-year growth 2025-2030 (%)
Data Table on Over-water transport - Year-over-year growth 2025-2030 (%)

9.5 Market opportunity by Type

Market opportunity by Type ($ million)
Data Table on Market opportunity by Type ($ million)

10. Market Segmentation by Location

10.1 Market segments

Chart on Location - Market share 2025-2030 (%)
Data Table on Location - Market share 2025-2030 (%)

10.2 Comparison by Location

Chart on Comparison by Location
Data Table on Comparison by Location

10.3 Domestic transportation - Market size and forecast 2025-2030

Chart on Domestic transportation - Market size and forecast 2025-2030 ($ million)
Data Table on Domestic transportation - Market size and forecast 2025-2030 ($ million)
Chart on Domestic transportation - Year-over-year growth 2025-2030 (%)
Data Table on Domestic transportation - Year-over-year growth 2025-2030 (%)

10.4 International transportation - Market size and forecast 2025-2030

Chart on International transportation - Market size and forecast 2025-2030 ($ million)
Data Table on International transportation - Market size and forecast 2025-2030 ($ million)
Chart on International transportation - Year-over-year growth 2025-2030 (%)
Data Table on International transportation - Year-over-year growth 2025-2030 (%)

10.5 Market opportunity by Location

Market opportunity by Location ($ million)
Data Table on Market opportunity by Location ($ million)

11. Customer Landscape

11.1 Customer landscape overview

Analysis of price sensitivity, lifecycle, customer purchase basket, adoption rates, and purchase criteria

12. Geographic Landscape

12.1 Geographic segmentation

Chart on Market share by geography 2025-2030 (%)
Data Table on Market share by geography 2025-2030 (%)

12.2 Geographic comparison

Chart on Geographic comparison
Data Table on Geographic comparison

12.3 North America - Market size and forecast 2025-2030

Chart on North America - Market size and forecast 2025-2030 ($ million)
Data Table on North America - Market size and forecast 2025-2030 ($ million)
Chart on North America - Year-over-year growth 2025-2030 (%)
Data Table on North America - Year-over-year growth 2025-2030 (%)
Chart on Regional Comparison - North America
Data Table on Regional Comparison - North America

12.3.1 US - Market size and forecast 2025-2030

Chart on US - Market size and forecast 2025-2030 ($ million)
Data Table on US - Market size and forecast 2025-2030 ($ million)
Chart on US - Year-over-year growth 2025-2030 (%)
Data Table on US - Year-over-year growth 2025-2030 (%)

12.3.2 Canada - Market size and forecast 2025-2030

Chart on Canada - Market size and forecast 2025-2030 ($ million)
Data Table on Canada - Market size and forecast 2025-2030 ($ million)
Chart on Canada - Year-over-year growth 2025-2030 (%)
Data Table on Canada - Year-over-year growth 2025-2030 (%)

12.3.3 Mexico - Market size and forecast 2025-2030

Chart on Mexico - Market size and forecast 2025-2030 ($ million)
Data Table on Mexico - Market size and forecast 2025-2030 ($ million)
Chart on Mexico - Year-over-year growth 2025-2030 (%)
Data Table on Mexico - Year-over-year growth 2025-2030 (%)

12.4 Europe - Market size and forecast 2025-2030

Chart on Europe - Market size and forecast 2025-2030 ($ million)
Data Table on Europe - Market size and forecast 2025-2030 ($ million)
Chart on Europe - Year-over-year growth 2025-2030 (%)
Data Table on Europe - Year-over-year growth 2025-2030 (%)
Chart on Regional Comparison - Europe
Data Table on Regional Comparison - Europe

12.4.1 Germany - Market size and forecast 2025-2030

Chart on Germany - Market size and forecast 2025-2030 ($ million)
Data Table on Germany - Market size and forecast 2025-2030 ($ million)
Chart on Germany - Year-over-year growth 2025-2030 (%)
Data Table on Germany - Year-over-year growth 2025-2030 (%)

12.4.2 France - Market size and forecast 2025-2030

Chart on France - Market size and forecast 2025-2030 ($ million)
Data Table on France - Market size and forecast 2025-2030 ($ million)
Chart on France - Year-over-year growth 2025-2030 (%)
Data Table on France - Year-over-year growth 2025-2030 (%)

12.4.3 Italy - Market size and forecast 2025-2030

Chart on Italy - Market size and forecast 2025-2030 ($ million)
Data Table on Italy - Market size and forecast 2025-2030 ($ million)
Chart on Italy - Year-over-year growth 2025-2030 (%)
Data Table on Italy - Year-over-year growth 2025-2030 (%)

12.4.4 UK - Market size and forecast 2025-2030

Chart on UK - Market size and forecast 2025-2030 ($ million)
Data Table on UK - Market size and forecast 2025-2030 ($ million)
Chart on UK - Year-over-year growth 2025-2030 (%)
Data Table on UK - Year-over-year growth 2025-2030 (%)

12.4.5 Spain - Market size and forecast 2025-2030

Chart on Spain - Market size and forecast 2025-2030 ($ million)
Data Table on Spain - Market size and forecast 2025-2030 ($ million)
Chart on Spain - Year-over-year growth 2025-2030 (%)
Data Table on Spain - Year-over-year growth 2025-2030 (%)

12.4.6 The Netherlands - Market size and forecast 2025-2030

Chart on The Netherlands - Market size and forecast 2025-2030 ($ million)
Data Table on The Netherlands - Market size and forecast 2025-2030 ($ million)
Chart on The Netherlands - Year-over-year growth 2025-2030 (%)
Data Table on The Netherlands - Year-over-year growth 2025-2030 (%)

12.5 APAC - Market size and forecast 2025-2030

Chart on APAC - Market size and forecast 2025-2030 ($ million)
Data Table on APAC - Market size and forecast 2025-2030 ($ million)
Chart on APAC - Year-over-year growth 2025-2030 (%)
Data Table on APAC - Year-over-year growth 2025-2030 (%)
Chart on Regional Comparison - APAC
Data Table on Regional Comparison - APAC

12.5.1 China - Market size and forecast 2025-2030

Chart on China - Market size and forecast 2025-2030 ($ million)
Data Table on China - Market size and forecast 2025-2030 ($ million)
Chart on China - Year-over-year growth 2025-2030 (%)
Data Table on China - Year-over-year growth 2025-2030 (%)

12.5.2 Australia - Market size and forecast 2025-2030

Chart on Australia - Market size and forecast 2025-2030 ($ million)
Data Table on Australia - Market size and forecast 2025-2030 ($ million)
Chart on Australia - Year-over-year growth 2025-2030 (%)
Data Table on Australia - Year-over-year growth 2025-2030 (%)

12.5.3 Japan - Market size and forecast 2025-2030

Chart on Japan - Market size and forecast 2025-2030 ($ million)
Data Table on Japan - Market size and forecast 2025-2030 ($ million)
Chart on Japan - Year-over-year growth 2025-2030 (%)
Data Table on Japan - Year-over-year growth 2025-2030 (%)

12.5.4 South Korea - Market size and forecast 2025-2030

Chart on South Korea - Market size and forecast 2025-2030 ($ million)
Data Table on South Korea - Market size and forecast 2025-2030 ($ million)
Chart on South Korea - Year-over-year growth 2025-2030 (%)
Data Table on South Korea - Year-over-year growth 2025-2030 (%)

12.5.5 India - Market size and forecast 2025-2030

Chart on India - Market size and forecast 2025-2030 ($ million)
Data Table on India - Market size and forecast 2025-2030 ($ million)
Chart on India - Year-over-year growth 2025-2030 (%)
Data Table on India - Year-over-year growth 2025-2030 (%)

12.5.6 Indonesia - Market size and forecast 2025-2030

Chart on Indonesia - Market size and forecast 2025-2030 ($ million)
Data Table on Indonesia - Market size and forecast 2025-2030 ($ million)
Chart on Indonesia - Year-over-year growth 2025-2030 (%)
Data Table on Indonesia - Year-over-year growth 2025-2030 (%)

12.6 Middle East and Africa - Market size and forecast 2025-2030

Chart on Middle East and Africa - Market size and forecast 2025-2030 ($ million)
Data Table on Middle East and Africa - Market size and forecast 2025-2030 ($ million)
Chart on Middle East and Africa - Year-over-year growth 2025-2030 (%)
Data Table on Middle East and Africa - Year-over-year growth 2025-2030 (%)
Chart on Regional Comparison - Middle East and Africa
Data Table on Regional Comparison - Middle East and Africa

12.6.1 UAE - Market size and forecast 2025-2030

Chart on UAE - Market size and forecast 2025-2030 ($ million)
Data Table on UAE - Market size and forecast 2025-2030 ($ million)
Chart on UAE - Year-over-year growth 2025-2030 (%)
Data Table on UAE - Year-over-year growth 2025-2030 (%)

12.6.2 South Africa - Market size and forecast 2025-2030

Chart on South Africa - Market size and forecast 2025-2030 ($ million)
Data Table on South Africa - Market size and forecast 2025-2030 ($ million)
Chart on South Africa - Year-over-year growth 2025-2030 (%)
Data Table on South Africa - Year-over-year growth 2025-2030 (%)

12.6.3 Saudi Arabia - Market size and forecast 2025-2030

Chart on Saudi Arabia - Market size and forecast 2025-2030 ($ million)
Data Table on Saudi Arabia - Market size and forecast 2025-2030 ($ million)
Chart on Saudi Arabia - Year-over-year growth 2025-2030 (%)
Data Table on Saudi Arabia - Year-over-year growth 2025-2030 (%)

12.6.4 Turkey - Market size and forecast 2025-2030

Chart on Turkey - Market size and forecast 2025-2030 ($ million)
Data Table on Turkey - Market size and forecast 2025-2030 ($ million)
Chart on Turkey - Year-over-year growth 2025-2030 (%)
Data Table on Turkey - Year-over-year growth 2025-2030 (%)

12.6.5 Israel - Market size and forecast 2025-2030

Chart on Israel - Market size and forecast 2025-2030 ($ million)
Data Table on Israel - Market size and forecast 2025-2030 ($ million)
Chart on Israel - Year-over-year growth 2025-2030 (%)
Data Table on Israel - Year-over-year growth 2025-2030 (%)

12.7 South America - Market size and forecast 2025-2030

Chart on South America - Market size and forecast 2025-2030 ($ million)
Data Table on South America - Market size and forecast 2025-2030 ($ million)
Chart on South America - Year-over-year growth 2025-2030 (%)
Data Table on South America - Year-over-year growth 2025-2030 (%)
Chart on Regional Comparison - South America
Data Table on Regional Comparison - South America

12.7.1 Brazil - Market size and forecast 2025-2030

Chart on Brazil - Market size and forecast 2025-2030 ($ million)
Data Table on Brazil - Market size and forecast 2025-2030 ($ million)
Chart on Brazil - Year-over-year growth 2025-2030 (%)
Data Table on Brazil - Year-over-year growth 2025-2030 (%)

12.7.2 Argentina - Market size and forecast 2025-2030

Chart on Argentina - Market size and forecast 2025-2030 ($ million)
Data Table on Argentina - Market size and forecast 2025-2030 ($ million)
Chart on Argentina - Year-over-year growth 2025-2030 (%)
Data Table on Argentina - Year-over-year growth 2025-2030 (%)

12.7.3 Colombia - Market size and forecast 2025-2030

Chart on Colombia - Market size and forecast 2025-2030 ($ million)
Data Table on Colombia - Market size and forecast 2025-2030 ($ million)
Chart on Colombia - Year-over-year growth 2025-2030 (%)
Data Table on Colombia - Year-over-year growth 2025-2030 (%)

12.8 Market opportunity by geography

Market opportunity by geography ($ million)
Data Tables on Market opportunity by geography ($ million)

13. Drivers, Challenges, and Opportunity

13.1 Market drivers

Expansion of global wealth and high net worth demographics
Advancements in specialized maritime logistics and transport technologies
Proliferation of international marine exhibitions and competitive regattas

13.2 Market challenges

Stringent environmental regulations and carbon emission mandates
Vulnerability to geopolitical tensions and global supply chain disruptions
Exorbitant operational expenses and severe specialized equipment limitations

13.3 Impact of drivers and challenges

Impact of drivers and challenges in 2025 and 2030

13.4 Market opportunities

Adoption of sustainable and eco friendly transit protocols
Escalating demand for charter fleet seasonal repositioning services
Strategic relocation of vessels due to changing global climate patterns

14. Competitive Landscape

14.1 Overview

14.2

Overview on criticality of inputs and factors of differentiation

14.3 Landscape disruption

Overview on factors of disruption

14.4 Industry risks

Impact of key risks on business

15. Competitive Analysis

15.1 Companies profiled

Companies covered

15.2 Company ranking index

15.3 Market positioning of companies

Matrix on companies position and classification

15.4 Bas Bos Logistics

Bas Bos Logistics - Overview
Bas Bos Logistics - Product / Service
Bas Bos Logistics - Key offerings
SWOT

15.5 Bremer Lloyd

Bremer Lloyd - Overview
Bremer Lloyd - Product / Service
Bremer Lloyd - Key offerings
SWOT

15.6 Brooks Yacht Transport

Brooks Yacht Transport - Overview
Brooks Yacht Transport - Product / Service
Brooks Yacht Transport - Key offerings
SWOT

15.7 Complete Marine Freight

Complete Marine Freight - Overview
Complete Marine Freight - Product / Service
Complete Marine Freight - Key offerings
SWOT

15.8 DYT Yacht Transport

DYT Yacht Transport - Overview
DYT Yacht Transport - Product / Service
DYT Yacht Transport - Key offerings
SWOT

15.9 GAC

GAC - Overview
GAC - Product / Service
GAC - Key offerings
SWOT

15.10 Legend Yacht Transport

Legend Yacht Transport - Overview
Legend Yacht Transport - Product / Service
Legend Yacht Transport - Key offerings
SWOT

15.11 Mega Yacht Transport

Mega Yacht Transport - Overview
Mega Yacht Transport - Product / Service
Mega Yacht Transport - Key offerings
SWOT

15.12 Pastrello

Pastrello - Overview
Pastrello - Product / Service
Pastrello - Key offerings
SWOT

15.13 Peters and May Ltd.

Peters and May Ltd. - Overview
Peters and May Ltd. - Product / Service
Peters and May Ltd. - Key offerings
SWOT

15.14 Raven Marine

Raven Marine - Overview
Raven Marine - Product / Service
Raven Marine - Key offerings
SWOT

15.15 Sevenstar Yacht Transport B.V.

Sevenstar Yacht Transport B.V. - Overview
Sevenstar Yacht Transport B.V. - Product / Service
Sevenstar Yacht Transport B.V. - Key offerings
SWOT

15.16 Ship Overseas Inc.

Ship Overseas Inc. - Overview
Ship Overseas Inc. - Product / Service
Ship Overseas Inc. - Key offerings
SWOT

15.17 SuperYacht Shipping

SuperYacht Shipping - Overview
SuperYacht Shipping - Product / Service
SuperYacht Shipping - Key offerings
SWOT

15.18 Yacht Shipping Ltd

Yacht Shipping Ltd - Overview
Yacht Shipping Ltd - Product / Service
Yacht Shipping Ltd - Key offerings
SWOT

16. Appendix

16.1 Scope of the report

Market definition
Objectives
Notes and caveats

16.2 Inclusions and exclusions checklist

Inclusions checklist
Exclusions checklist

16.3 Currency conversion rates for US$

16.4 Research methodology

16.5 Data procurement

Information sources

16.6 Data validation

16.7 Validation techniques employed for market sizing

16.8 Data synthesis

16.9 360 degree market analysis

16.10 List of abbreviations

Research Methodology

Technavio presents a detailed picture of the market by way of study, synthesis, and summation of data from multiple sources. The analysts have presented the various facets of the market with a particular focus on identifying the key industry influencers. The data thus presented is comprehensive, reliable, and the result of extensive research, both primary and secondary.

INFORMATION SOURCES

Primary sources

  • Manufacturers and suppliers
  • Channel partners
  • Industry experts
  • Strategic decision makers

Secondary sources

  • Industry journals and periodicals
  • Government data
  • Financial reports of key industry players
  • Historical data
  • Press releases

DATA ANALYSIS

Data Synthesis

  • Collation of data
  • Estimation of key figures
  • Analysis of derived insights

Data Validation

  • Triangulation with data models
  • Reference against proprietary databases
  • Corroboration with industry experts

REPORT WRITING

Qualitative

  • Market drivers
  • Market challenges
  • Market trends
  • Five forces analysis

Quantitative

  • Market size and forecast
  • Market segmentation
  • Geographical insights
  • Competitive landscape

Interested in this report?

Get your sample now to see our research methodology and insights!

Download Now

Frequently Asked Questions

Boat And Yacht Transportation market growth will increase by USD 445.5 million during 2026-2030.

The Boat And Yacht Transportation market is expected to grow at a CAGR of 5.4% during 2026-2030.

Boat And Yacht Transportation market is segmented by Product (Boat, Yacht) Type (Over-land transport, Over-water transport) Location (Domestic transportation, International transportation)

Bas Bos Logistics, Boat and Yacht Transport Inc., Bremer Lloyd, Brooks Yacht Transport, Complete Marine Freight, DYT Yacht Transport, GAC, Joule Yacht Transport Inc., Legend Yacht Transport, Mega Yacht Transport, Oceanus Yacht Transportation Ltd., Pastrello, Peters and May Ltd., Raven Marine, Sevenstar Yacht Transport B.V., Ship Overseas Inc., SuperYacht Shipping, Wallenius Wilhelmsen ASA, We Ship Boats, Yacht Shipping Ltd are a few of the key vendors in the Boat And Yacht Transportation market.

North America will register the highest growth rate of 30.7% among the other regions. Therefore, the Boat And Yacht Transportation market in North America is expected to garner significant business opportunities for the vendors during the forecast period.

US, Canada, Mexico, Germany, France, Italy, UK, Spain, The Netherlands, China, Australia, Japan, South Korea, India, Indonesia, UAE, South Africa, Saudi Arabia, Turkey, Israel, Brazil, Argentina, Colombia

  • Expansion of global wealth and high net worth demographics is the driving factor this market.

The Boat And Yacht Transportation market vendors should focus on grabbing business opportunities from the Product segment as it accounted for the largest market share in the base year.
RIA - Research AI Assistant
Ask RIA