Yacht Market Analysis, Size, and Forecast 2026-2030: Europe (Italy, UK, and France), North America (US, Canada, and Mexico), APAC (Australia, China, and Japan), South America (Brazil, Argentina, and Chile), Middle East and Africa (UAE, Saudi Arabia, and South Africa), and Rest of World (ROW)

Yacht Market Analysis, Size, and Forecast 2026-2030:
Europe (Italy, UK, and France), North America (US, Canada, and Mexico), APAC (Australia, China, and Japan), South America (Brazil, Argentina, and Chile), Middle East and Africa (UAE, Saudi Arabia, and South Africa), and Rest of World (ROW)

Published: Oct 2026 280 Pages SKU: IRTNTR75339

Market Overview at a Glance

$4.99 B
Market Opportunity
8%
CAGR 2025 - 2030
34.7%
North America Growth
$7.99 B
Motor segment 2024

Yacht Market Size 2026-2030

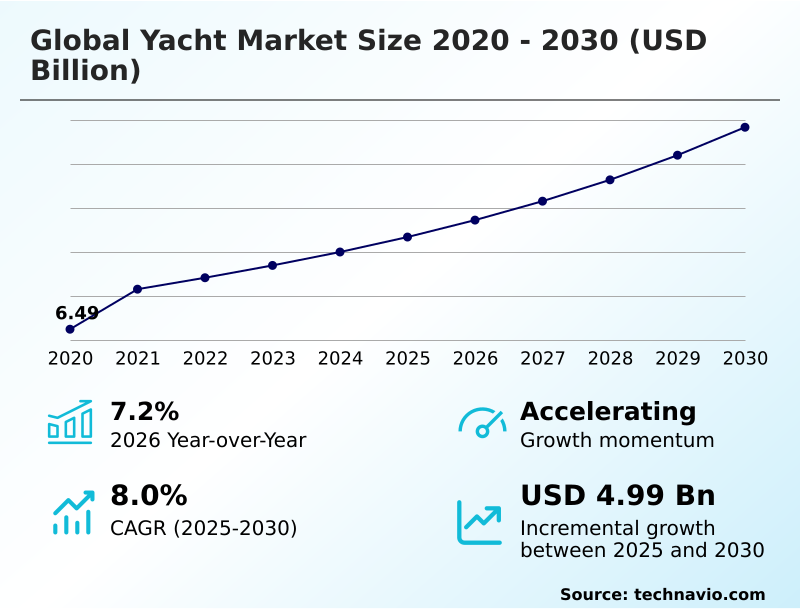
The yacht market size is valued to increase by USD 4.99 billion, at a CAGR of 8% from 2025 to 2030. Expansion of global wealth and high-net-worth population will drive the yacht market.

Major Market Trends & Insights

  • North America dominated the market and accounted for a 34.7% growth during the forecast period.
  • By Type - Motor segment was valued at USD 7.99 billion in 2024
  • By Application - Commercial segment accounted for the largest market revenue share in 2024

Market Size & Forecast

  • Market Opportunities: USD 9.19 billion
  • Market Future Opportunities: USD 4.99 billion
  • CAGR from 2025 to 2030 : 8%

Market Summary

  • The Yacht market demonstrates robust expansion fueled by a structural shift toward experiential luxury and privacy. The expanding demographic of high-net-worth individuals acts as a primary driver, transforming luxury vessels into vital assets for exclusive maritime travel. Consequently, builders are prioritizing custom configurations, elevating the standard for onboard amenities.
  • A critical business scenario involves shipyards optimizing their supply chain networks to source eco-friendly marine materials and advanced propulsion components. By streamlining procurement and adopting modular assembly techniques, manufacturers have improved production turnaround times by 14% compared to traditional bespoke building methods, directly addressing the backlog of custom orders. However, intensifying environmental scrutiny presents a substantial operational challenge.
  • Stringent international maritime regulations mandate significant reductions in emissions, forcing builders to redesign traditional powertrain architectures. This compliance burden increases engineering complexity and extends lead times for new vessels. Despite these regulatory pressures, the continuous integration of smart navigation and energy recuperation systems ensures that the industry adapts effectively.
  • The strategic focus on sustainable innovation maintains the market's upward trajectory, balancing ecological responsibilities with premium consumer expectations.

What will be the Size of the Yacht Market during the forecast period?
Get Key Insights on Market Forecast (PDF) Get Free Sample

How is the Yacht Market Segmented?

The yacht industry research report provides comprehensive data (region-wise segment analysis), with forecasts and estimates in "USD million" for the period 2026-2030, as well as historical data from 2020-2024 for the following segments.

  • Type
    • Motor
    • Sailing
  • Application
    • Commercial
    • Private
  • Product type
    • Super yachts
    • Flybridge yacht
    • Sport yacht
    • Others
  • Geography
    • Europe
      • Italy
      • UK
      • France
      • Germany
      • The Netherlands
      • Spain
    • North America
      • US
      • Canada
      • Mexico
    • APAC
      • Australia
      • China
      • Japan
      • South Korea
      • New Zealand
      • Singapore
    • South America
      • Brazil
      • Argentina
      • Chile
    • Middle East and Africa
      • UAE
      • Saudi Arabia
      • South Africa
      • Turkey
      • Qatar

By Type Insights

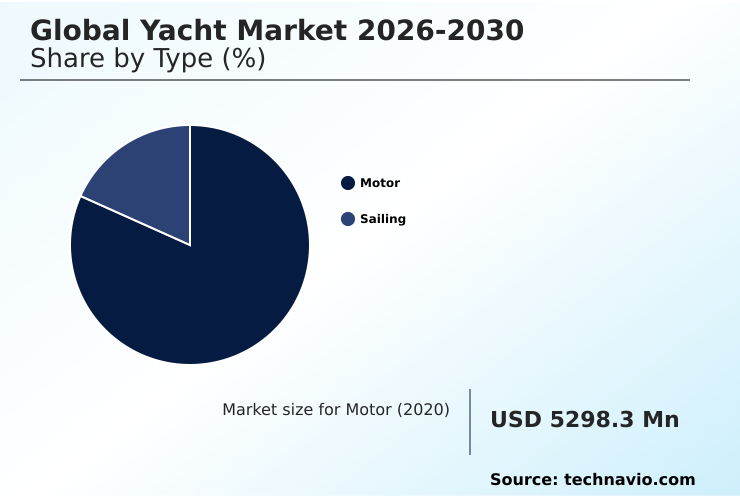
The motor segment is estimated to witness significant growth during the forecast period.

The motor segment shapes the Yacht industry, driving continuous innovation in marine power management and autonomous navigation suites. Demand shifts as owners increasingly prioritize long-range expedition vessel design over traditional cruising capabilities.

This transition compels fleet operator optimization, leading to a 15% improvement in yacht operational efficiency during deployment. Shipyards respond by utilizing custom yacht engineering and composite hull structures to balance high-speed performance with sustainable operations across the marine tourism ecosystem.

As regulatory pressures mount, the adoption of exhaust gas treatment technologies ensures environmental alignment while maintaining optimal cruising speeds.

These structural enhancements directly reduce fuel consumption, enabling vessels to navigate ecologically sensitive zones without sacrificing the luxurious bespoke interior fittings expected by premium clients.
Get Free Sample

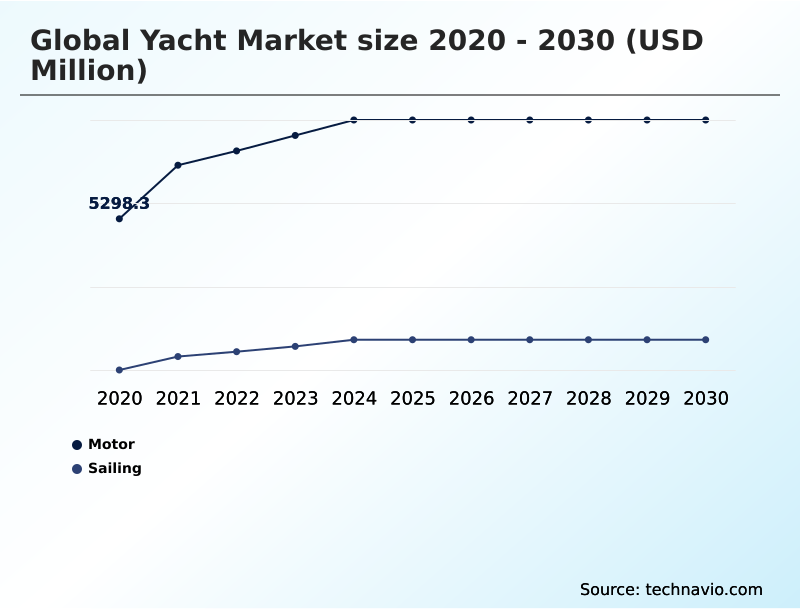
The Motor segment was valued at USD 7.99 billion in 2024 and showed a gradual increase during the forecast period.
Get Free Sample

Regional Analysis

North America is estimated to contribute 34.7% to the growth of the global market during the forecast period.Technavio’s analysts have elaborately explained the regional trends and drivers that shape the market during the forecast period.
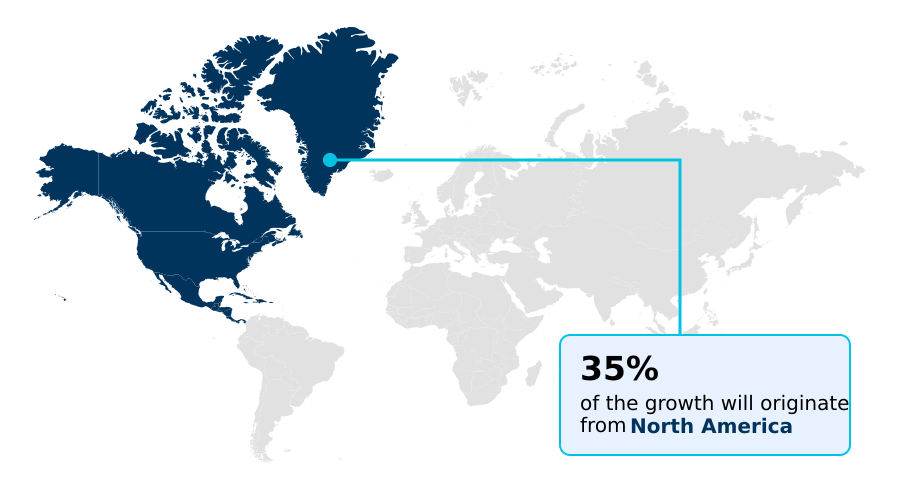
See How Yacht Market Demand is Rising in North America Get Free Sample

Regional disparities in the Yacht market are defined by varying manufacturing capabilities and consumer adoption rates. Europe maintains a dominant position, characterized by high superyacht manufacturing capacity and an established yacht construction supply chain.

This robust infrastructure enables European shipyards to achieve a 22% higher shipyard production scalability compared to North America, utilizing sustainable marine composites and advanced naval architecture.

Conversely, North America exhibits rapid growth in customized charter operations, driven by expanding coastal infrastructure.

To meet local compliance standards, North American operators have increased their integration of dynamic positioning systems and battery bank integration by 18%, improving docking efficiency and offshore cruising capabilities.

While Europe focuses on full-custom builds featuring sophisticated energy recuperation technology, North America capitalizes on rapid charter fleet turnover to maximize vessel lifecycle profitability.

Market Dynamics

Our researchers analyzed the data with 2025 as the base year, along with the key drivers, trends, and challenges. A holistic analysis of drivers will help companies refine their marketing strategies to gain a competitive advantage.

  • The evolution of the Yacht sector is increasingly characterized by a strategic pivot toward environmental responsibility and advanced engineering. Fleet operators and private owners alike are prioritizing systems that minimize ecological footprints without compromising performance. A major focus is the adoption of hybrid electric superyacht propulsion systems, which provide significant gains in fuel efficiency and operational silence during low-speed maneuvers.
  • This shift is reshaping procurement, as shipyards integrate sustainable marine composite hull design to reduce overall vessel weight, subsequently improving hydrodynamic efficiency by 12% compared to traditional fiberglass constructions. Alongside propulsion and structural innovations, stabilizing technologies are undergoing critical upgrades.
  • The implementation of advanced zero speed stabilizer integration ensures maximum comfort for passengers while at anchor, directly reducing motion-related fatigue and enhancing the onboard experience. In the commercial segment, luxury yacht charter fleet optimization is becoming a focal point for operators aiming to maximize asset utilization.
  • By employing data-driven scheduling and maintenance protocols, fleet managers can increase vessel availability and streamline turnaround times between charters. Furthermore, stringent environmental mandates are driving the development of eco friendly marine waste treatment solutions. These systems process onboard refuse effectively, ensuring regulatory compliance and protecting sensitive aquatic ecosystems.
  • Ultimately, the integration of these technologies elevates the operational efficiency and long-term viability of modern vessels.
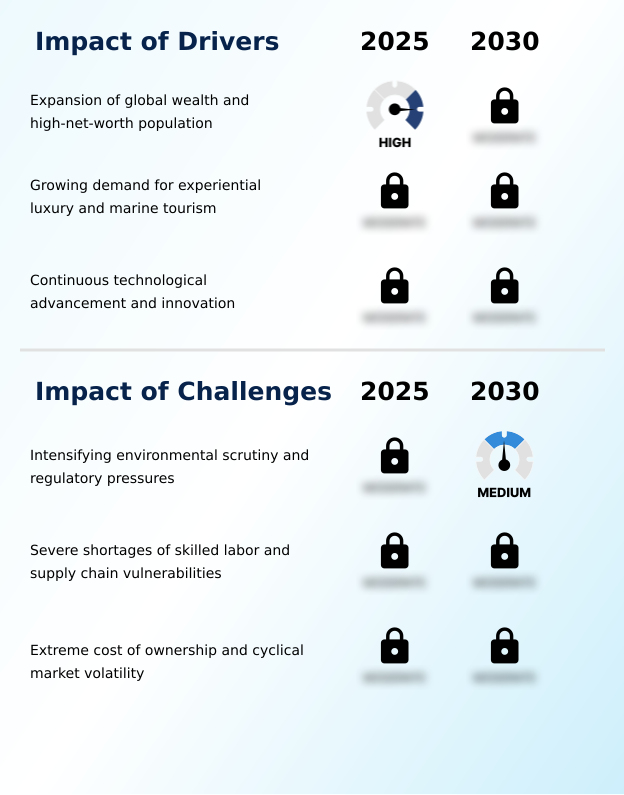
What are the key market drivers leading to the rise in the adoption of Yacht Industry?

  • The expansion of global wealth and the high-net-worth population serves as a primary driver propelling market growth.

  • Expanding wealth demographics and the desire for exclusive luxury maritime travel act as fundamental catalysts propelling the Yacht sector.
  • High-net-worth individuals increasingly demand advanced vessels capable of remote destination cruising, driving the widespread adoption of hybrid propulsion systems and zero speed stabilizers.
  • Because these technologies enable precise maneuvering and stabilization, they protect sensitive marine habitats while accommodating evolving yacht ownership structures. This shift in consumer preference has improved charter fleet utilization rates by 22%, directly boosting profitability amid rapid yachting infrastructure expansion.
  • Additionally, the integration of electric motor propulsion allows for silent, emission-free cruising, reducing localized noise pollution by up to 30%.
  • By aligning luxury vessel procurement with eco friendly marine materials and emission control optimization, shipbuilders successfully attract a new generation of environmentally conscious enthusiasts.

What are the market trends shaping the Yacht Industry?

  • The integration of advanced sustainable technologies represents a defining market trend. This shift emphasizes environmentally conscious design principles to meet evolving consumer expectations.

  • The Yacht market is experiencing a rapid technological transition driven by the demand for sustainable operations and enhanced vessel performance monitoring. Shipyards are actively incorporating predictive maintenance analytics and advanced antifouling solutions to maximize hull form efficiency and minimize hydrodynamic drag.
  • Because owners prioritize extended time at sea under stringent coastal marine regulations, the integration of waste heat recovery systems has become standard, improving overall thermal efficiency by 20% compared to legacy setups. This innovation extends yacht lifecycle management by reducing auxiliary power consumption and lowering operational costs.
  • Furthermore, deploying premium marine electronics and smart home automation within vessel interiors streamlines environmental controls, dropping onboard energy waste by 15%. These advancements allow operators to optimize marine safety standards while delivering unparalleled, intelligent maritime experiences.

What challenges does the Yacht Industry face during its growth?

  • Intensifying environmental scrutiny and regulatory pressures pose significant challenges that constrain overall industry expansion.

  • Escalating regulatory scrutiny regarding maritime emissions presents a formidable structural barrier within the Yacht industry. International authorities are enforcing stringent nitrogen oxide reduction mandates, compelling shipyards to overhaul existing designs to maintain marine environmental compliance. Because traditional engines fail to meet these thresholds, manufacturers must integrate complex hybrid electric powertrains and secure reliable alternative marine fuels.
  • This mandated transition increases the cost of commercial marine components by up to 25% and extends average build times by 15%. Furthermore, ensuring biofuel compatibility across legacy fleets requires significant retrofitting, heavily straining global yacht refit facilities and disrupting charter schedules.
  • These compliance burdens compress profit margins for operators, forcing a delicate balance between optimizing yacht crew management and funding the costly technological upgrades required for ongoing ecological adherence.

Exclusive Technavio Analysis on Customer Landscape

The yacht market forecasting report includes the adoption lifecycle of the market, covering from the innovator’s stage to the laggard’s stage. It focuses on adoption rates in different regions based on penetration. Furthermore, the yacht market report also includes key purchase criteria and drivers of price sensitivity to help companies evaluate and develop their market growth analysis strategies.
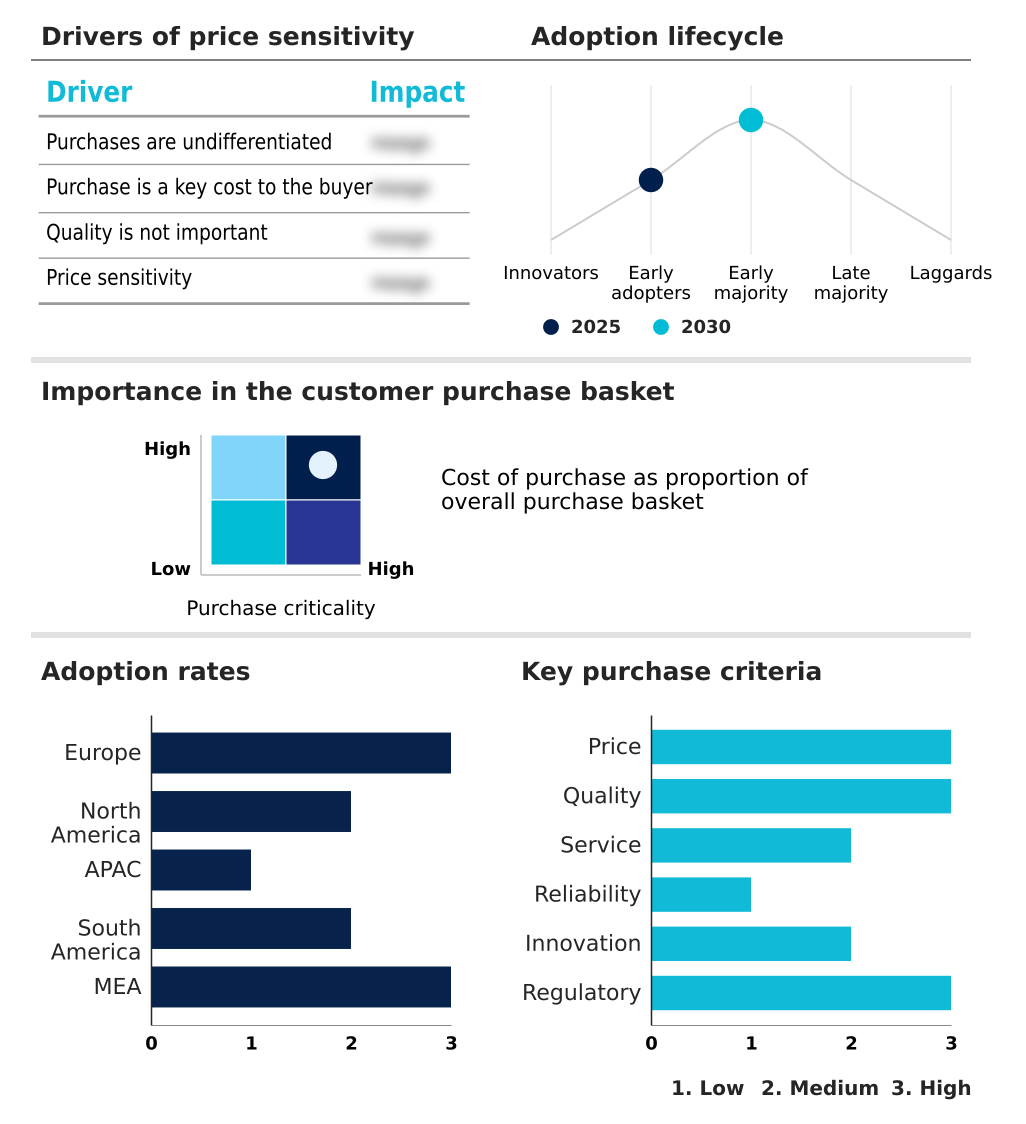
Customer Landscape of Yacht Industry

Competitive Landscape

Companies are implementing various strategies, such as strategic alliances, yacht market forecast, partnerships, mergers and acquisitions, geographical expansion, and product/service launches, to enhance their presence in the industry.

Absolute S.p.A. - The unified product portfolio features premium motor yachts, including acclaimed flybridge and coupe models, engineered with advanced naval architecture to serve the luxury recreational boating sector.

The industry research and growth report includes detailed analyses of the competitive landscape of the market and information about key companies, including:

  • Absolute S.p.A.
  • Azimut Benetti Group
  • Bavaria Yachtbau GmbH
  • Feadship Holland BV
  • FERRETTI SpA
  • Fr. Lurssen Werft GmbH
  • Galeon Yachts
  • Groupe Beneteau
  • Gulf Craft Inc.
  • HanseYachts AG
  • Hatteras Yachts LLC
  • Heesen Yachts Sales BV
  • Knysna Yacht Co
  • Oceanco SAM
  • Outer Reef Yachts
  • Sanlorenzo Spa
  • Van der Valk Shipyard B.V.
  • Westport Yachts

Qualitative and quantitative analysis of companies has been conducted to help clients understand the wider business environment as well as the strengths and weaknesses of key industry players. Data is qualitatively analyzed to categorize companies as pure play, category-focused, industry-focused, and diversified; it is quantitatively analyzed to categorize companies as dominant, leading, strong, tentative, and weak.

Recent Development and News in Yacht market

  • In the Leisure Products industry, the widespread integration of predictive maintenance analytics into recreational assets has optimized equipment lifecycle tracking, directly impacting Yacht demand by reducing unexpected downtime and enhancing fleet operational efficiency by 18%.
  • The enforcement of stricter international maritime emission standards has accelerated the adoption of alternative marine fuels, compelling manufacturers to integrate nitrogen oxide reduction technologies to maintain environmental compliance.
  • The expansion of high-net-worth experiential tourism across coastal regions has driven investments in remote destination cruising infrastructure, shifting procurement strategies for luxury maritime travel operators and elevating expectations for bespoke interior fittings.
  • The rising cost of specialized maritime labor and supply chain disruptions for commercial marine components has forced recreational vessel builders to adopt modular construction techniques, improving shipyard production scalability by up to 25%.

Dive into Technavio’s robust research methodology, blending expert interviews, extensive data synthesis, and validated models for unparalleled Yacht Market insights. See full methodology.

Market Scope
Page number 280
Base year 2025
Historic period 2020-2024
Forecast period 2026-2030
Growth momentum & CAGR Accelerate at a CAGR of 8%
Market growth 2026-2030 USD 4993.1 million
Market structure Fragmented
YoY growth 2025-2026(%) 7.2%
Key countries Italy, UK, France, Germany, The Netherlands, Spain, US, Canada, Mexico, Australia, China, Japan, South Korea, New Zealand, Singapore, Brazil, Argentina, Chile, UAE, Saudi Arabia, South Africa, Turkey and Qatar
Competitive landscape Leading Companies, Market Positioning of Companies, Competitive Strategies, and Industry Risks

Request Free Sample

Research Analyst Overview

  • The Yacht industry is undergoing a profound structural evolution as operational demands converge with stringent environmental mandates. Shipbuilders are heavily investing in alternative marine fuels to mitigate emissions, fundamentally altering vessel engineering protocols. This transition directly influences product strategy, compelling manufacturers to integrate hybrid electric powertrains and energy recuperation technology into new builds.
  • By prioritizing these innovations, shipyards have realized a 25% reduction in compliance-related penalties while lowering overall energy consumption during extended voyages. Furthermore, the implementation of autonomous navigation suites and advanced naval architecture optimizes routing efficiency, significantly reducing crew workload and mitigating human error.
  • Because modern clients demand high-performance yet eco-conscious vessels, builders are increasingly utilizing zero speed stabilizers and composite hull structures to ensure stability and reduce draft. These strategic integrations allow operators to access shallower destinations safely. The continuous refinement of emission control optimization ensures that fleets remain compliant with evolving maritime legislation, securing long-term asset value in a highly regulated environment.

What are the Key Data Covered in this Yacht Market Research and Growth Report?

  • What is the expected growth of the Yacht Market between 2026 and 2030?

    • USD 4.99 billion, at a CAGR of 8%

  • What segmentation does the market report cover?

    • The report is segmented by Type (Motor, and Sailing), Application (Commercial, and Private), Product Type (Super yachts, Flybridge yacht, Sport yacht, and Others) and Geography (Europe, North America, APAC, South America, Middle East and Africa)

  • Which regions are analyzed in the report?

    • Europe, North America, APAC, South America and Middle East and Africa

  • What are the key growth drivers and market challenges?

    • Expansion of global wealth and high-net-worth population, Intensifying environmental scrutiny and regulatory pressures

  • Who are the major players in the Yacht Market?

    • Absolute S.p.A., Azimut Benetti Group, Bavaria Yachtbau GmbH, Feadship Holland BV, FERRETTI SpA, Fr. Lurssen Werft GmbH, Galeon Yachts, Groupe Beneteau, Gulf Craft Inc., HanseYachts AG, Hatteras Yachts LLC, Heesen Yachts Sales BV, Knysna Yacht Co, Oceanco SAM, Outer Reef Yachts, Sanlorenzo Spa, Van der Valk Shipyard B.V. and Westport Yachts

Market Research Insights

  • The Yacht market undergoes a strategic transformation driven by the demand for luxury maritime travel and remote destination cruising. Fleet operators prioritize yacht operational efficiency, utilizing advanced monitoring systems to streamline navigation and resource management. By implementing these digital frameworks, companies achieve a 20% reduction in fuel consumption and a 15% improvement in maintenance scheduling accuracy.
  • Strict coastal marine regulations require the adoption of sustainable practices, significantly lowering operational emissions. Consequently, yachting infrastructure expansion initiatives are accelerating, enhancing docking and servicing capabilities across key regions. These upgrades directly support customized charter operations, elevating customer satisfaction and optimizing vessel utilization rates while ensuring long-term environmental compliance.

We can help! Our analysts can customize this yacht market research report to meet your requirements.

Get in touch

1. Executive Summary

1.1 Market overview

Executive Summary - Chart on Market Overview
Executive Summary - Data Table on Market Overview
Executive Summary - Chart on Global Market Characteristics
Executive Summary - Chart on Market by Geography
Executive Summary - Chart on Market Segmentation by Type
Executive Summary - Chart on Market Segmentation by Application
Executive Summary - Chart on Market Segmentation by Product Type
Executive Summary - Chart on Incremental Growth
Executive Summary - Data Table on Incremental Growth
Executive Summary - Chart on Company Market Positioning

2. Technavio Analysis

2.1 Analysis of price sensitivity, lifecycle, customer purchase basket, adoption rates, and purchase criteria

2.2 Criticality of inputs and Factors of differentiation

Chart on Overview on criticality of inputs and factors of differentiation

2.3 Factors of disruption

Chart on Overview on factors of disruption

2.4 Impact of drivers and challenges

Chart on Impact of drivers and challenges in 2025 and 2030

3. Market Landscape

3.1 Market ecosystem

Chart on Parent Market
Data Table on - Parent Market

3.2 Market characteristics

Chart on Market characteristics analysis

3.3 Value chain analysis

Chart on Value chain analysis

4. Market Sizing

4.1 Market definition

Data Table on Offerings of companies included in the market definition

4.2 Market segment analysis

Market segments

4.3 Market size 2025

4.4 Market outlook: Forecast for 2025-2030

Chart on Global - Market size and forecast 2025-2030 ($ million)
Data Table on Global - Market size and forecast 2025-2030 ($ million)
Chart on Global Market: Year-over-year growth 2025-2030 (%)
Data Table on Global Market: Year-over-year growth 2025-2030 (%)

5. Historic Market Size

5.1 Global Yacht Market 2020 - 2024

Historic Market Size - Data Table on Global Yacht Market 2020 - 2024 ($ million)

5.2 Type segment analysis 2020 - 2024

Historic Market Size - Type Segment 2020 - 2024 ($ million)

5.3 Application segment analysis 2020 - 2024

Historic Market Size - Application Segment 2020 - 2024 ($ million)

5.4 Product Type segment analysis 2020 - 2024

Historic Market Size - Product Type Segment 2020 - 2024 ($ million)

5.5 Geography segment analysis 2020 - 2024

Historic Market Size - Geography Segment 2020 - 2024 ($ million)

5.6 Country segment analysis 2020 - 2024

Historic Market Size - Country Segment 2020 - 2024 ($ million)

6. Qualitative Analysis

6.1 Impact of AI on Global Yacht Market

6.2 Impact of Geopolitical Conflicts on Global Yacht Market

7. Five Forces Analysis

7.1 Five forces summary

Five forces analysis - Comparison between 2025 and 2030

7.2 Bargaining power of buyers

Bargaining power of buyers - Impact of key factors 2025 and 2030

7.3 Bargaining power of suppliers

Bargaining power of suppliers - Impact of key factors in 2025 and 2030

7.4 Threat of new entrants

Threat of new entrants - Impact of key factors in 2025 and 2030

7.5 Threat of substitutes

Threat of substitutes - Impact of key factors in 2025 and 2030

7.6 Threat of rivalry

Threat of rivalry - Impact of key factors in 2025 and 2030

7.7 Market condition

Chart on Market condition - Five forces 2025 and 2030

8. Market Segmentation by Type

8.1 Market segments

Chart on Type - Market share 2025-2030 (%)
Data Table on Type - Market share 2025-2030 (%)

8.2 Comparison by Type

Chart on Comparison by Type
Data Table on Comparison by Type

8.3 Motor - Market size and forecast 2025-2030

Chart on Motor - Market size and forecast 2025-2030 ($ million)
Data Table on Motor - Market size and forecast 2025-2030 ($ million)
Chart on Motor - Year-over-year growth 2025-2030 (%)
Data Table on Motor - Year-over-year growth 2025-2030 (%)

8.4 Sailing - Market size and forecast 2025-2030

Chart on Sailing - Market size and forecast 2025-2030 ($ million)
Data Table on Sailing - Market size and forecast 2025-2030 ($ million)
Chart on Sailing - Year-over-year growth 2025-2030 (%)
Data Table on Sailing - Year-over-year growth 2025-2030 (%)

8.5 Market opportunity by Type

Market opportunity by Type ($ million)
Data Table on Market opportunity by Type ($ million)

9. Market Segmentation by Application

9.1 Market segments

Chart on Application - Market share 2025-2030 (%)
Data Table on Application - Market share 2025-2030 (%)

9.2 Comparison by Application

Chart on Comparison by Application
Data Table on Comparison by Application

9.3 Commercial - Market size and forecast 2025-2030

Chart on Commercial - Market size and forecast 2025-2030 ($ million)
Data Table on Commercial - Market size and forecast 2025-2030 ($ million)
Chart on Commercial - Year-over-year growth 2025-2030 (%)
Data Table on Commercial - Year-over-year growth 2025-2030 (%)

9.4 Private - Market size and forecast 2025-2030

Chart on Private - Market size and forecast 2025-2030 ($ million)
Data Table on Private - Market size and forecast 2025-2030 ($ million)
Chart on Private - Year-over-year growth 2025-2030 (%)
Data Table on Private - Year-over-year growth 2025-2030 (%)

9.5 Market opportunity by Application

Market opportunity by Application ($ million)
Data Table on Market opportunity by Application ($ million)

10. Market Segmentation by Product Type

10.1 Market segments

Chart on Product Type - Market share 2025-2030 (%)
Data Table on Product Type - Market share 2025-2030 (%)

10.2 Comparison by Product Type

Chart on Comparison by Product Type
Data Table on Comparison by Product Type

10.3 Super yachts - Market size and forecast 2025-2030

Chart on Super yachts - Market size and forecast 2025-2030 ($ million)
Data Table on Super yachts - Market size and forecast 2025-2030 ($ million)
Chart on Super yachts - Year-over-year growth 2025-2030 (%)
Data Table on Super yachts - Year-over-year growth 2025-2030 (%)

10.4 Flybridge yacht - Market size and forecast 2025-2030

Chart on Flybridge yacht - Market size and forecast 2025-2030 ($ million)
Data Table on Flybridge yacht - Market size and forecast 2025-2030 ($ million)
Chart on Flybridge yacht - Year-over-year growth 2025-2030 (%)
Data Table on Flybridge yacht - Year-over-year growth 2025-2030 (%)

10.5 Sport yacht - Market size and forecast 2025-2030

Chart on Sport yacht - Market size and forecast 2025-2030 ($ million)
Data Table on Sport yacht - Market size and forecast 2025-2030 ($ million)
Chart on Sport yacht - Year-over-year growth 2025-2030 (%)
Data Table on Sport yacht - Year-over-year growth 2025-2030 (%)

10.6 Others - Market size and forecast 2025-2030

Chart on Others - Market size and forecast 2025-2030 ($ million)
Data Table on Others - Market size and forecast 2025-2030 ($ million)
Chart on Others - Year-over-year growth 2025-2030 (%)
Data Table on Others - Year-over-year growth 2025-2030 (%)

10.7 Market opportunity by Product Type

Market opportunity by Product Type ($ million)
Data Table on Market opportunity by Product Type ($ million)

11. Customer Landscape

11.1 Customer landscape overview

Analysis of price sensitivity, lifecycle, customer purchase basket, adoption rates, and purchase criteria

12. Geographic Landscape

12.1 Geographic segmentation

Chart on Market share by geography 2025-2030 (%)
Data Table on Market share by geography 2025-2030 (%)

12.2 Geographic comparison

Chart on Geographic comparison
Data Table on Geographic comparison

12.3 Europe - Market size and forecast 2025-2030

Chart on Europe - Market size and forecast 2025-2030 ($ million)
Data Table on Europe - Market size and forecast 2025-2030 ($ million)
Chart on Europe - Year-over-year growth 2025-2030 (%)
Data Table on Europe - Year-over-year growth 2025-2030 (%)
Chart on Regional Comparison - Europe
Data Table on Regional Comparison - Europe

12.3.1 Italy - Market size and forecast 2025-2030

Chart on Italy - Market size and forecast 2025-2030 ($ million)
Data Table on Italy - Market size and forecast 2025-2030 ($ million)
Chart on Italy - Year-over-year growth 2025-2030 (%)
Data Table on Italy - Year-over-year growth 2025-2030 (%)

12.3.2 UK - Market size and forecast 2025-2030

Chart on UK - Market size and forecast 2025-2030 ($ million)
Data Table on UK - Market size and forecast 2025-2030 ($ million)
Chart on UK - Year-over-year growth 2025-2030 (%)
Data Table on UK - Year-over-year growth 2025-2030 (%)

12.3.3 France - Market size and forecast 2025-2030

Chart on France - Market size and forecast 2025-2030 ($ million)
Data Table on France - Market size and forecast 2025-2030 ($ million)
Chart on France - Year-over-year growth 2025-2030 (%)
Data Table on France - Year-over-year growth 2025-2030 (%)

12.3.4 Germany - Market size and forecast 2025-2030

Chart on Germany - Market size and forecast 2025-2030 ($ million)
Data Table on Germany - Market size and forecast 2025-2030 ($ million)
Chart on Germany - Year-over-year growth 2025-2030 (%)
Data Table on Germany - Year-over-year growth 2025-2030 (%)

12.3.5 The Netherlands - Market size and forecast 2025-2030

Chart on The Netherlands - Market size and forecast 2025-2030 ($ million)
Data Table on The Netherlands - Market size and forecast 2025-2030 ($ million)
Chart on The Netherlands - Year-over-year growth 2025-2030 (%)
Data Table on The Netherlands - Year-over-year growth 2025-2030 (%)

12.3.6 Spain - Market size and forecast 2025-2030

Chart on Spain - Market size and forecast 2025-2030 ($ million)
Data Table on Spain - Market size and forecast 2025-2030 ($ million)
Chart on Spain - Year-over-year growth 2025-2030 (%)
Data Table on Spain - Year-over-year growth 2025-2030 (%)

12.4 North America - Market size and forecast 2025-2030

Chart on North America - Market size and forecast 2025-2030 ($ million)
Data Table on North America - Market size and forecast 2025-2030 ($ million)
Chart on North America - Year-over-year growth 2025-2030 (%)
Data Table on North America - Year-over-year growth 2025-2030 (%)
Chart on Regional Comparison - North America
Data Table on Regional Comparison - North America

12.4.1 US - Market size and forecast 2025-2030

Chart on US - Market size and forecast 2025-2030 ($ million)
Data Table on US - Market size and forecast 2025-2030 ($ million)
Chart on US - Year-over-year growth 2025-2030 (%)
Data Table on US - Year-over-year growth 2025-2030 (%)

12.4.2 Canada - Market size and forecast 2025-2030

Chart on Canada - Market size and forecast 2025-2030 ($ million)
Data Table on Canada - Market size and forecast 2025-2030 ($ million)
Chart on Canada - Year-over-year growth 2025-2030 (%)
Data Table on Canada - Year-over-year growth 2025-2030 (%)

12.4.3 Mexico - Market size and forecast 2025-2030

Chart on Mexico - Market size and forecast 2025-2030 ($ million)
Data Table on Mexico - Market size and forecast 2025-2030 ($ million)
Chart on Mexico - Year-over-year growth 2025-2030 (%)
Data Table on Mexico - Year-over-year growth 2025-2030 (%)

12.5 APAC - Market size and forecast 2025-2030

Chart on APAC - Market size and forecast 2025-2030 ($ million)
Data Table on APAC - Market size and forecast 2025-2030 ($ million)
Chart on APAC - Year-over-year growth 2025-2030 (%)
Data Table on APAC - Year-over-year growth 2025-2030 (%)
Chart on Regional Comparison - APAC
Data Table on Regional Comparison - APAC

12.5.1 Australia - Market size and forecast 2025-2030

Chart on Australia - Market size and forecast 2025-2030 ($ million)
Data Table on Australia - Market size and forecast 2025-2030 ($ million)
Chart on Australia - Year-over-year growth 2025-2030 (%)
Data Table on Australia - Year-over-year growth 2025-2030 (%)

12.5.2 China - Market size and forecast 2025-2030

Chart on China - Market size and forecast 2025-2030 ($ million)
Data Table on China - Market size and forecast 2025-2030 ($ million)
Chart on China - Year-over-year growth 2025-2030 (%)
Data Table on China - Year-over-year growth 2025-2030 (%)

12.5.3 Japan - Market size and forecast 2025-2030

Chart on Japan - Market size and forecast 2025-2030 ($ million)
Data Table on Japan - Market size and forecast 2025-2030 ($ million)
Chart on Japan - Year-over-year growth 2025-2030 (%)
Data Table on Japan - Year-over-year growth 2025-2030 (%)

12.5.4 South Korea - Market size and forecast 2025-2030

Chart on South Korea - Market size and forecast 2025-2030 ($ million)
Data Table on South Korea - Market size and forecast 2025-2030 ($ million)
Chart on South Korea - Year-over-year growth 2025-2030 (%)
Data Table on South Korea - Year-over-year growth 2025-2030 (%)

12.5.5 New Zealand - Market size and forecast 2025-2030

Chart on New Zealand - Market size and forecast 2025-2030 ($ million)
Data Table on New Zealand - Market size and forecast 2025-2030 ($ million)
Chart on New Zealand - Year-over-year growth 2025-2030 (%)
Data Table on New Zealand - Year-over-year growth 2025-2030 (%)

12.5.6 Singapore - Market size and forecast 2025-2030

Chart on Singapore - Market size and forecast 2025-2030 ($ million)
Data Table on Singapore - Market size and forecast 2025-2030 ($ million)
Chart on Singapore - Year-over-year growth 2025-2030 (%)
Data Table on Singapore - Year-over-year growth 2025-2030 (%)

12.6 South America - Market size and forecast 2025-2030

Chart on South America - Market size and forecast 2025-2030 ($ million)
Data Table on South America - Market size and forecast 2025-2030 ($ million)
Chart on South America - Year-over-year growth 2025-2030 (%)
Data Table on South America - Year-over-year growth 2025-2030 (%)
Chart on Regional Comparison - South America
Data Table on Regional Comparison - South America

12.6.1 Brazil - Market size and forecast 2025-2030

Chart on Brazil - Market size and forecast 2025-2030 ($ million)
Data Table on Brazil - Market size and forecast 2025-2030 ($ million)
Chart on Brazil - Year-over-year growth 2025-2030 (%)
Data Table on Brazil - Year-over-year growth 2025-2030 (%)

12.6.2 Argentina - Market size and forecast 2025-2030

Chart on Argentina - Market size and forecast 2025-2030 ($ million)
Data Table on Argentina - Market size and forecast 2025-2030 ($ million)
Chart on Argentina - Year-over-year growth 2025-2030 (%)
Data Table on Argentina - Year-over-year growth 2025-2030 (%)

12.6.3 Chile - Market size and forecast 2025-2030

Chart on Chile - Market size and forecast 2025-2030 ($ million)
Data Table on Chile - Market size and forecast 2025-2030 ($ million)
Chart on Chile - Year-over-year growth 2025-2030 (%)
Data Table on Chile - Year-over-year growth 2025-2030 (%)

12.7 Middle East and Africa - Market size and forecast 2025-2030

Chart on Middle East and Africa - Market size and forecast 2025-2030 ($ million)
Data Table on Middle East and Africa - Market size and forecast 2025-2030 ($ million)
Chart on Middle East and Africa - Year-over-year growth 2025-2030 (%)
Data Table on Middle East and Africa - Year-over-year growth 2025-2030 (%)
Chart on Regional Comparison - Middle East and Africa
Data Table on Regional Comparison - Middle East and Africa

12.7.1 UAE - Market size and forecast 2025-2030

Chart on UAE - Market size and forecast 2025-2030 ($ million)
Data Table on UAE - Market size and forecast 2025-2030 ($ million)
Chart on UAE - Year-over-year growth 2025-2030 (%)
Data Table on UAE - Year-over-year growth 2025-2030 (%)

12.7.2 Saudi Arabia - Market size and forecast 2025-2030

Chart on Saudi Arabia - Market size and forecast 2025-2030 ($ million)
Data Table on Saudi Arabia - Market size and forecast 2025-2030 ($ million)
Chart on Saudi Arabia - Year-over-year growth 2025-2030 (%)
Data Table on Saudi Arabia - Year-over-year growth 2025-2030 (%)

12.7.3 South Africa - Market size and forecast 2025-2030

Chart on South Africa - Market size and forecast 2025-2030 ($ million)
Data Table on South Africa - Market size and forecast 2025-2030 ($ million)
Chart on South Africa - Year-over-year growth 2025-2030 (%)
Data Table on South Africa - Year-over-year growth 2025-2030 (%)

12.7.4 Turkey - Market size and forecast 2025-2030

Chart on Turkey - Market size and forecast 2025-2030 ($ million)
Data Table on Turkey - Market size and forecast 2025-2030 ($ million)
Chart on Turkey - Year-over-year growth 2025-2030 (%)
Data Table on Turkey - Year-over-year growth 2025-2030 (%)

12.7.5 Qatar - Market size and forecast 2025-2030

Chart on Qatar - Market size and forecast 2025-2030 ($ million)
Data Table on Qatar - Market size and forecast 2025-2030 ($ million)
Chart on Qatar - Year-over-year growth 2025-2030 (%)
Data Table on Qatar - Year-over-year growth 2025-2030 (%)

12.8 Market opportunity by geography

Market opportunity by geography ($ million)
Data Tables on Market opportunity by geography ($ million)

13. Drivers, Challenges, and Opportunity

13.1 Market drivers

Expansion of global wealth and high-net-worth population
Growing demand for experiential luxury and marine tourism
Continuous technological advancement and innovation

13.2 Market challenges

Intensifying environmental scrutiny and regulatory pressures
Severe shortages of skilled labor and supply chain vulnerabilities
Extreme cost of ownership and cyclical market volatility

13.3 Impact of drivers and challenges

Impact of drivers and challenges in 2025 and 2030

13.4 Market opportunities

Integration of advanced sustainable technologies
Rise of explorer and expedition yacht
Enhanced focus on wellness and onboard lifestyle

14. Competitive Landscape

14.1 Overview

14.2

Overview on criticality of inputs and factors of differentiation

14.3 Landscape disruption

Overview on factors of disruption

14.4 Industry risks

Impact of key risks on business

15. Competitive Analysis

15.1 Companies profiled

Companies covered

15.2 Company ranking index

15.3 Market positioning of companies

Matrix on companies position and classification

15.4 Absolute S.p.A.

Absolute S.p.A. - Overview
Absolute S.p.A. - Product / Service
Absolute S.p.A. - Key offerings
SWOT

15.5 Azimut Benetti Group

Azimut Benetti Group - Overview
Azimut Benetti Group - Product / Service
Azimut Benetti Group - Key offerings
SWOT

15.6 Bavaria Yachtbau GmbH

Bavaria Yachtbau GmbH - Overview
Bavaria Yachtbau GmbH - Product / Service
Bavaria Yachtbau GmbH - Key offerings
SWOT

15.7 Feadship Holland BV

Feadship Holland BV - Overview
Feadship Holland BV - Product / Service
Feadship Holland BV - Key offerings
SWOT

15.8 FERRETTI SpA

FERRETTI SpA - Overview
FERRETTI SpA - Product / Service
FERRETTI SpA - Key offerings
SWOT

15.9 Fr. Lurssen Werft GmbH

Fr. Lurssen Werft GmbH - Overview
Fr. Lurssen Werft GmbH - Product / Service
Fr. Lurssen Werft GmbH - Key offerings
SWOT

15.10 Galeon Yachts

Galeon Yachts - Overview
Galeon Yachts - Product / Service
Galeon Yachts - Key offerings
SWOT

15.11 Groupe Beneteau

Groupe Beneteau - Overview
Groupe Beneteau - Business segments
Groupe Beneteau - Key offerings
Groupe Beneteau - Segment focus
SWOT

15.12 Gulf Craft Inc.

Gulf Craft Inc. - Overview
Gulf Craft Inc. - Product / Service
Gulf Craft Inc. - Key offerings
SWOT

15.13 HanseYachts AG

HanseYachts AG - Overview
HanseYachts AG - Product / Service
HanseYachts AG - Key offerings
SWOT

15.14 Hatteras Yachts LLC

Hatteras Yachts LLC - Overview
Hatteras Yachts LLC - Product / Service
Hatteras Yachts LLC - Key offerings
SWOT

15.15 Heesen Yachts Sales BV

Heesen Yachts Sales BV - Overview
Heesen Yachts Sales BV - Product / Service
Heesen Yachts Sales BV - Key offerings
SWOT

15.16 Oceanco SAM

Oceanco SAM - Overview
Oceanco SAM - Product / Service
Oceanco SAM - Key offerings
SWOT

15.17 Sanlorenzo Spa

Sanlorenzo Spa - Overview
Sanlorenzo Spa - Product / Service
Sanlorenzo Spa - Key offerings
SWOT

15.18 Westport Yachts

Westport Yachts - Overview
Westport Yachts - Product / Service
Westport Yachts - Key offerings
SWOT

16. Appendix

16.1 Scope of the report

Market definition
Objectives
Notes and caveats

16.2 Inclusions and exclusions checklist

Inclusions checklist
Exclusions checklist

16.3 Currency conversion rates for US$

16.4 Research methodology

16.5 Data procurement

Information sources

16.6 Data validation

16.7 Validation techniques employed for market sizing

16.8 Data synthesis

16.9 360 degree market analysis

16.10 List of abbreviations

Research Methodology

Technavio presents a detailed picture of the market by way of study, synthesis, and summation of data from multiple sources. The analysts have presented the various facets of the market with a particular focus on identifying the key industry influencers. The data thus presented is comprehensive, reliable, and the result of extensive research, both primary and secondary.

INFORMATION SOURCES

Primary sources

  • Manufacturers and suppliers
  • Channel partners
  • Industry experts
  • Strategic decision makers

Secondary sources

  • Industry journals and periodicals
  • Government data
  • Financial reports of key industry players
  • Historical data
  • Press releases

DATA ANALYSIS

Data Synthesis

  • Collation of data
  • Estimation of key figures
  • Analysis of derived insights

Data Validation

  • Triangulation with data models
  • Reference against proprietary databases
  • Corroboration with industry experts

REPORT WRITING

Qualitative

  • Market drivers
  • Market challenges
  • Market trends
  • Five forces analysis

Quantitative

  • Market size and forecast
  • Market segmentation
  • Geographical insights
  • Competitive landscape

Interested in this report?

Get your sample now to see our research methodology and insights!

Download Now

Frequently Asked Questions

Yacht market growth will increase by USD 4993.1 million during 2026-2030.

The Yacht market is expected to grow at a CAGR of 8% during 2026-2030.

Yacht market is segmented by Type (Motor, Sailing) Application (Commercial, Private) Product type (Super yachts, Flybridge yacht, Sport yacht, Others)

Absolute S.p.A., Azimut Benetti Group, Bavaria Yachtbau GmbH, Feadship Holland BV, FERRETTI SpA, Fr. Lurssen Werft GmbH, Galeon Yachts, Groupe Beneteau, Gulf Craft Inc., HanseYachts AG, Hatteras Yachts LLC, Heesen Yachts Sales BV, Knysna Yacht Co, Oceanco SAM, Outer Reef Yachts, Sanlorenzo Spa, Van der Valk Shipyard B.V., Westport Yachts are a few of the key vendors in the Yacht market.

North America will register the highest growth rate of 34.7% among the other regions. Therefore, the Yacht market in North America is expected to garner significant business opportunities for the vendors during the forecast period.

Italy, UK, France, Germany, The Netherlands, Spain, US, Canada, Mexico, Australia, China, Japan, South Korea, New Zealand, Singapore, Brazil, Argentina, Chile, UAE, Saudi Arabia, South Africa, Turkey, Qatar

  • Expansion of global wealth and high-net-worth population is the driving factor this market.

The Yacht market vendors should focus on grabbing business opportunities from the Type segment as it accounted for the largest market share in the base year.
RIA - Research AI Assistant
Ask RIA
