
Boom Truck Market Analysis, Size, and Forecast 2026-2030: APAC (China, Japan, and India), North America (US, Canada, and Mexico), Europe (Germany, UK, and France), South America (Brazil, Argentina, and Chile), Middle East and Africa (Saudi Arabia, UAE, and South Africa), and Rest of World (ROW)

Boom Truck Market Analysis, Size, and Forecast 2026-2030:
APAC (China, Japan, and India), North America (US, Canada, and Mexico), Europe (Germany, UK, and France), South America (Brazil, Argentina, and Chile), Middle East and Africa (Saudi Arabia, UAE, and South Africa), and Rest of World (ROW)

Published: Oct 2026 296 Pages SKU: IRTNTR74510

Market Overview at a Glance

$509.5 Mn
Market Opportunity
4.5%
CAGR 2025 - 2030
47.6%
APAC Growth
$725.5 Mn
Construction segment 2024

Boom Truck Market Size 2026-2030

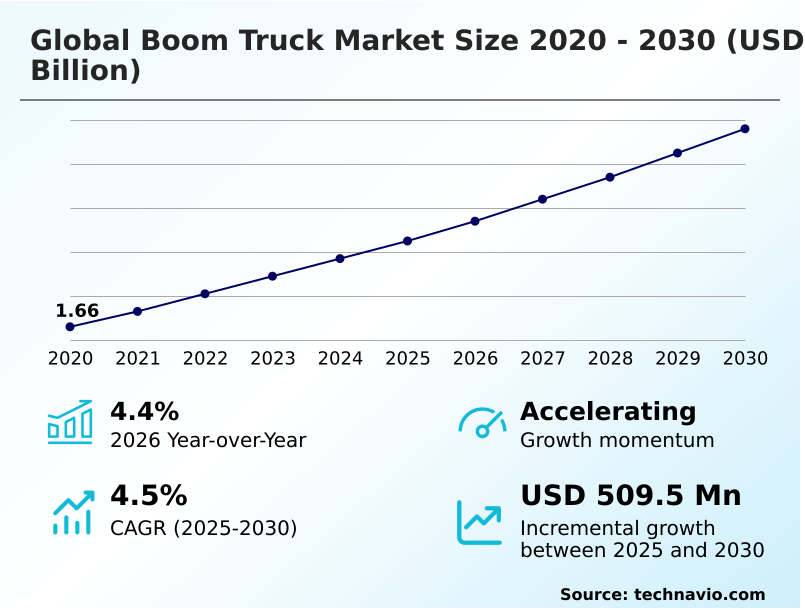
The boom truck market size is valued to increase by USD 509.5 million, at a CAGR of 4.5% from 2025 to 2030. Expanding telecommunications and grid modernization spending will drive the boom truck market.

Major Market Trends & Insights

  • APAC dominated the market and accounted for a 47.6% growth during the forecast period.
  • By End-user - Construction segment was valued at USD 725.5 million in 2024
  • By Type - Telescopic boom trucks segment accounted for the largest market revenue share in 2024

Market Size & Forecast

  • Market Opportunities: USD 897.9 million
  • Market Future Opportunities: USD 509.5 million
  • CAGR from 2025 to 2030 : 4.5%

Market Summary

  • The Boom Truck Market experiences sustained expansion driven by the critical need for versatile mobile lifting solutions across diverse industrial sectors. Operations managers increasingly rely on these vehicles to optimize supply chain logistics, specifically during municipal infrastructure repairs where minimizing road closures is paramount.
  • Expanding telecommunications upgrades propels product adoption, as contractors require agile machinery for tower maintenance and electrical power distribution improvements. Consequently, modern fleet configurations have reduced average equipment setup time by 30% compared to traditional stationary cranes. However, complex highway weight regulations limit market potential.
  • Navigating varying regional axle weight limits necessitates meticulous route planning and specialized permits, which inflates logistical expenditures and delays project timelines. Despite these regulatory hurdles, continuous advancements in electronic load management and structural weight reduction sustain operational viability. Manufacturers prioritize intelligent safety mechanisms to enhance operator precision.
  • This continuous technological evolution ensures that versatile lifting machinery remains integral to modern infrastructure development and commercial construction initiatives.

What will be the Size of the Boom Truck Market during the forecast period?
Get Key Insights on Market Forecast (PDF) Get Free Sample

How is the Boom Truck Market Segmented?

The boom truck industry research report provides comprehensive data (region-wise segment analysis), with forecasts and estimates in "USD million" for the period 2026-2030, as well as historical data from 2020-2024 for the following segments.

  • End-user
    • Construction
    • Telecom
    • Transportation and logistics
    • Others
  • Type
    • Telescopic boom trucks
    • Articulated boom trucks
    • Fixed boom trucks
    • Specialized boom trucks
  • Capacity
    • More than 10-20 metrics tons
    • Less than 10 metrics tons
    • More than 20 metrics tons
  • Geography
    • APAC
      • China
      • Japan
      • India
      • South Korea
      • Australia
      • Indonesia
    • North America
      • US
      • Canada
      • Mexico
    • Europe
      • Germany
      • UK
      • France
      • Italy
      • Spain
      • The Netherlands
    • South America
      • Brazil
      • Argentina
      • Chile
    • Middle East and Africa
      • Saudi Arabia
      • UAE
      • South Africa
      • Israel
      • Turkey

By End-user Insights

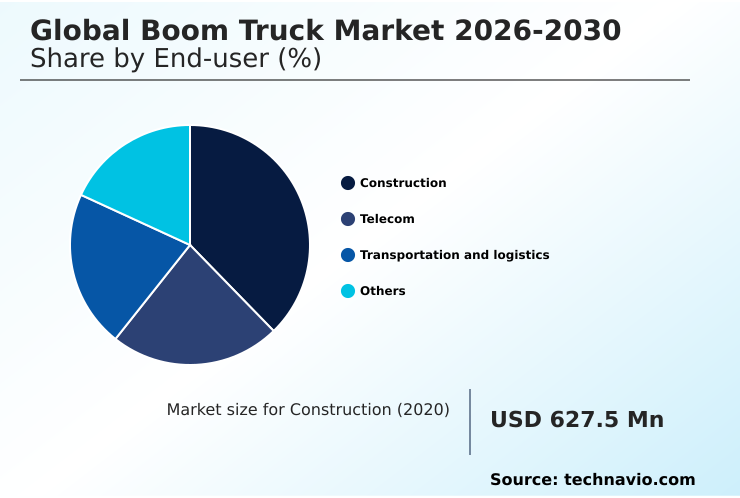
The construction segment is estimated to witness significant growth during the forecast period.

The construction sector dictates utilization patterns for lifting operations, prioritizing a high capacity roadable unit to maximize efficiency. Commercial building initiatives increasingly transition toward a dynamic telescopic hydraulic boom to navigate restricted sites.

This structural shift allows a heavy utility contractor to execute structural steel beam hoisting, roofing truss placement, and prefabricated concrete positioning with heightened precision.

Site managers benefit from jobsite setup rapid deployment, which has demonstrably improved heavy material transport efficiency by 22%. Furthermore, the adoption of electro hydraulic proportional control systems optimizes lifting cycles, enabling a 15% improvement in load placement accuracy.

The ongoing demand for confined space urban lifting drives continuous engineering enhancements, ensuring machinery meets the rigorous demands of infrastructure development.
Get Free Sample

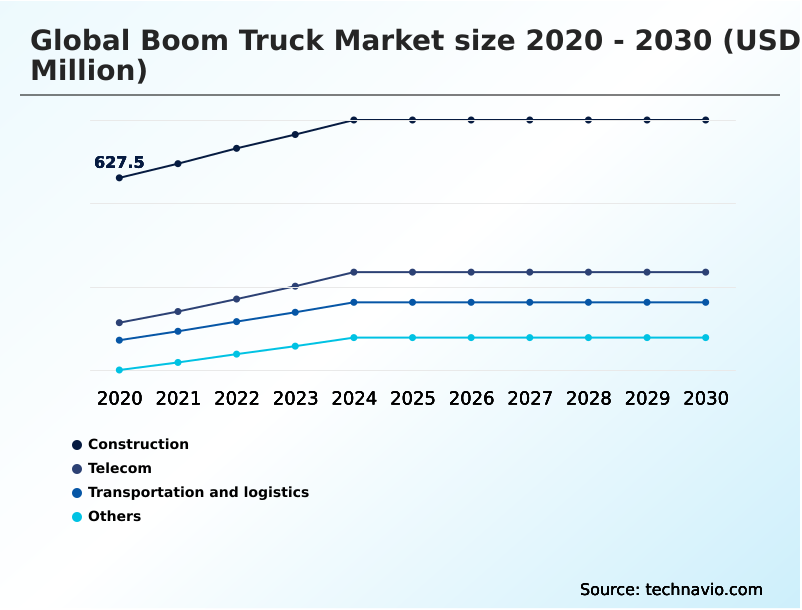
The Construction segment was valued at USD 725.5 million in 2024 and showed a gradual increase during the forecast period.
Get Free Sample

Regional Analysis

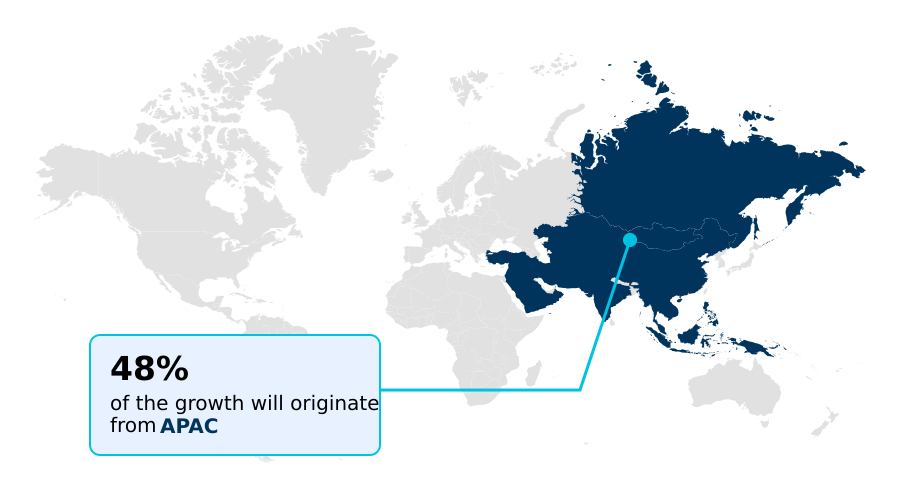
APAC is estimated to contribute 47.6% to the growth of the global market during the forecast period.Technavio’s analysts have elaborately explained the regional trends and drivers that shape the market during the forecast period.
See How Boom Truck Market Demand is Rising in APAC Get Free Sample

The geographic landscape features distinct variations in equipment adoption and regulatory environments. APAC demonstrates accelerated utilization, outpacing Europe by 24% in new fleet acquisitions, driven by civil infrastructure renewal and high density urban construction material handling.

Rapid industrialization in APAC propels the use of an insulated aerial work platform for a widespread electrical power distribution upgrade. In contrast, North American operators focus on axle weight compliance to navigate strict interstate transport laws.

This regulatory pressure has increased the deployment of a trayless modular counterweight by 15%, improving highway transport efficiency for any freight transport enterprise.

Additionally, rental equipment fleet management companies across regions invest heavily in agile mobile lifting equipment equipped with a real time boom tip camera, which has reduced jobsite delays by 20% through enhanced operator visibility.

Market Dynamics

Our researchers analyzed the data with 2025 as the base year, along with the key drivers, trends, and challenges. A holistic analysis of drivers will help companies refine their marketing strategies to gain a competitive advantage.

  • The continuous evolution of lifting equipment centers on maximizing operational versatility while mitigating rigorous logistical and safety challenges. Fleet managers increasingly emphasize machinery that supports seamless urban deployment without compromising performance. The integration of advanced mechanisms ensures telescopic hydraulic lifting load precision, allowing operators to execute complex material placement with a 25% higher accuracy rate than legacy cable-driven cranes.
  • This improvement significantly enhances supply chain scheduling by reducing material handling bottlenecks on congested sites. Furthermore, navigating strict regulatory frameworks requires axle weight compliance chassis adaptation, enabling vehicles to transit across interstate networks without incurring overweight penalties.
  • Urban construction environments also demand robust intelligent outrigger confined space stabilization, which secures optimal vehicle balance and prevents tipping incidents during heavy hoists in restricted zones. To maintain consistent fleet availability, operators leverage digital telematics predictive maintenance scheduling, effectively identifying component wear before critical failures occur and optimizing repair logistics.
  • Additionally, the widespread adoption of modern control interfaces guarantees electro hydraulic proportional operational safety, giving operators nuanced control over boom movements. This sophisticated technological ecosystem ensures that versatile lifting machinery meets the rigorous demands of modern infrastructure development, facilitating safe, efficient, and highly compliant material handling operations across diverse commercial sectors.
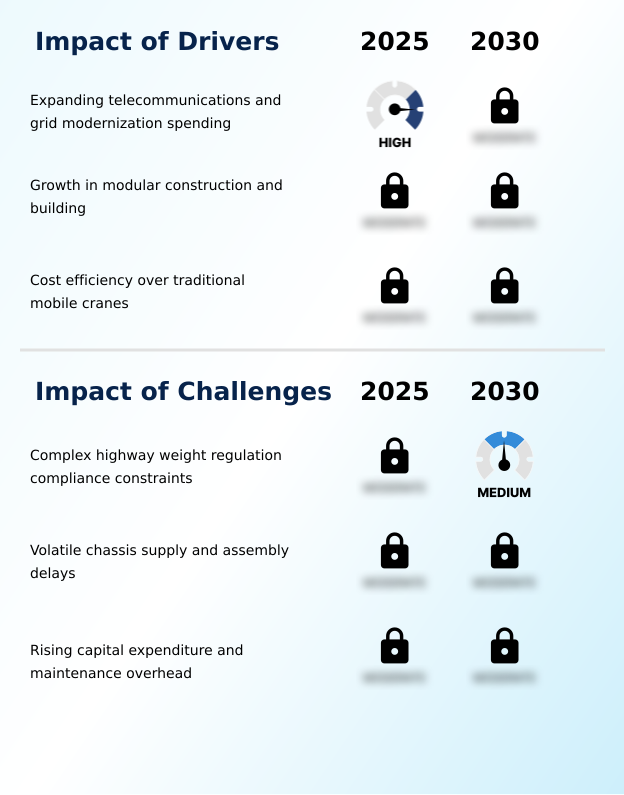
What are the key market drivers leading to the rise in the adoption of Boom Truck Industry?

  • Expanding telecommunications and grid modernization spending drives continuous demand for versatile mobile lifting solutions.

  • Accelerated investment in national utility infrastructure acts as the primary catalyst for market expansion. The urgent need to execute utility grid modernization and telecommunications infrastructure deployment requires versatile equipment capable of navigating rugged terrain.
  • Utility providers increasingly demand a highway legal standard chassis to eliminate specialized transport permits, reducing transit delays by 28%. The expansion of a municipal tree care service network necessitates a reliable chassis mounting unit to support elevated work platforms.
  • Consequently, fleet mobilization efficiency has improved by 20%. The reliance on a load moment indicator ensures operators safely handle variable payloads during cellular tower maintenance and fiber optic support pole installation.
  • Furthermore, the integration of a wireless radio remote control maximizes productivity while maintaining strict adherence to rigorous commercial safety protocols.

What are the market trends shaping the Boom Truck Industry?

  • Advanced fleet monitoring and integrated control frameworks are the upcoming market trend.

  • The technological trajectory of the sector is defined by the pervasive integration of connected safety frameworks and precision controls. Fleet operators rapidly adopt an automated hazard mitigation framework to counter rising jobsite incident rates, effectively reducing operator error by 22%. Furthermore, the transition toward a multi section proportional boom design enhances vertical reach, optimizing outrigger extension parameter limits.
  • By implementing robust digital telematics integration, supervisors monitor machinery health to streamline predictive maintenance scheduling. Consequently, unexpected equipment downtime has decreased by 35%. The incorporation of a hybrid auxiliary power system allows quiet, emission-free operation, which improves fuel consumption optimization by 18%.
  • Additionally, advanced electronic load management interfaces facilitate optimal vantage point execution, solidifying the transition toward sustainable and data-driven material handling operations.

What challenges does the Boom Truck Industry face during its growth?

  • Strict highway weight regulation compliance constraints limit operational mobility and inflate logistical planning expenditures.

  • Navigating restrictive transportation regulations poses a persistent structural hurdle for fleet operators. Transport authorities rigorously enforce bridge load formula adaptation, limiting the gross vehicle weight allowed on aging infrastructure. This stringent regulatory environment forces managers to execute complex route planning, which inflates logistical overhead costs by 15%.
  • Furthermore, transporting auxiliary rigging equipment often requires a single trip overweight exemption, delaying jobsite arrival times by an average of 24%. Balancing lifting capacity with roadability remains a complex engineering challenge, as adding a heavy articulating knuckle configuration directly impacts dynamic load distribution. To mitigate these constraints, manufacturers utilize a high tensile steel structure and a redesigned structural counterweight frame.
  • Despite these efforts, monitoring the hydraulic flow pressure metric and engine hour operational tracking during overhead lifting execution remains critical, as intelligent outrigger monitoring is essential to prevent instability.

Exclusive Technavio Analysis on Customer Landscape

The boom truck market forecasting report includes the adoption lifecycle of the market, covering from the innovator’s stage to the laggard’s stage. It focuses on adoption rates in different regions based on penetration. Furthermore, the boom truck market report also includes key purchase criteria and drivers of price sensitivity to help companies evaluate and develop their market growth analysis strategies.
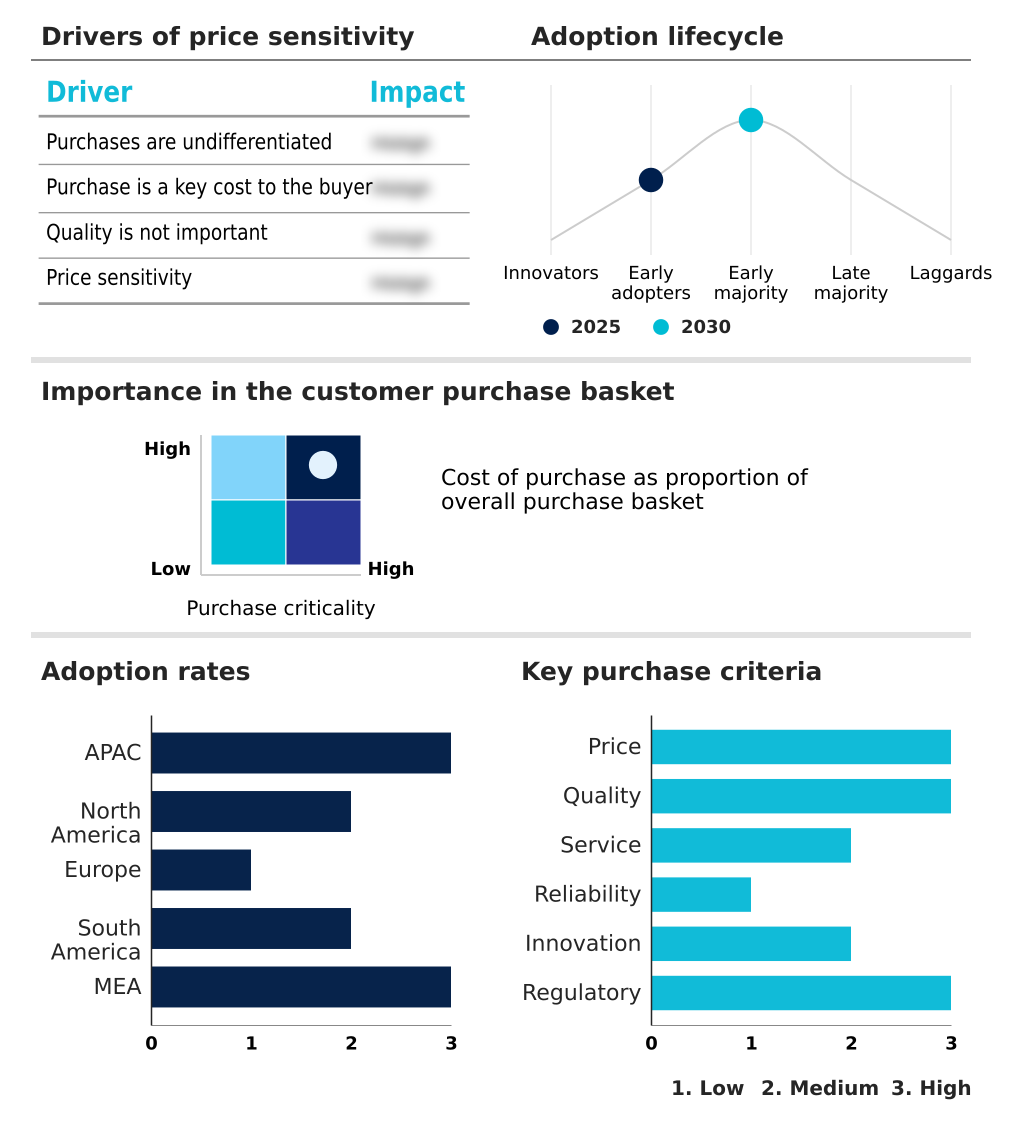
Customer Landscape of Boom Truck Industry

Competitive Landscape

Companies are implementing various strategies, such as strategic alliances, boom truck market forecast, partnerships, mergers and acquisitions, geographical expansion, and product/service launches, to enhance their presence in the industry.

Action Construction Equipment - The provider delivers versatile lifting solutions, featuring advanced truck mounted hydraulic cranes engineered for precision material handling across industrial, civil engineering, and infrastructure development applications.

The industry research and growth report includes detailed analyses of the competitive landscape of the market and information about key companies, including:

  • Action Construction Equipment
  • Altec Inc.
  • Amco Veba S.r.l.
  • ATLAS GmbH
  • Bronto Skylift Oy Ab
  • Cormach S.r.l.
  • Dur A Lift Inc.
  • Elliott Equipment Inc.
  • Furukawa UNIC Corp.
  • Hiab Corp.
  • Iowa Mold Tooling Co.Inc.
  • Liebherr International AG
  • Load King Trailers
  • Manitex Inc.
  • MKG Maschinen und Kranbau GmbH
  • PALFINGER AG
  • Sany Heavy Industry Co. Ltd.
  • Tadano Ltd.
  • Terex Corp.
  • XCMG Group

Qualitative and quantitative analysis of companies has been conducted to help clients understand the wider business environment as well as the strengths and weaknesses of key industry players. Data is qualitatively analyzed to categorize companies as pure play, category-focused, industry-focused, and diversified; it is quantitatively analyzed to categorize companies as dominant, leading, strong, tentative, and weak.

Recent Development and News in Boom truck market

  • In the Construction Machinery and Heavy Transportation Equipment industry, the implementation of stringent highway emission standard ISO 14001 accelerated the transition toward electric propulsion, directly impacting Boom Truck demand by necessitating the adoption of hybrid auxiliary systems to maintain compliance during overhead lifting tasks.
  • The widespread adoption of IoT fleet connectivity within commercial transport vehicles enabled precise engine hour tracking, driving Boom Truck manufacturers to integrate digital telematics that improved maintenance scheduling accuracy by 35%.
  • Structural material advancements in heavy lifting engineering facilitated the use of lighter alloys, which influenced Boom Truck design by allowing the implementation of high tensile steel frameworks that reduced overall chassis weight by 15% while improving dynamic load balancing.
  • Stricter urban infrastructure safety regulations mandated automated hazard mitigation in heavy machinery, prompting Boom Truck operators to deploy intelligent outrigger frameworks that reduced tipping incidents by 25% during utility modernization projects.

Dive into Technavio’s robust research methodology, blending expert interviews, extensive data synthesis, and validated models for unparalleled Boom Truck Market insights. See full methodology.

Market Scope
Page number 296
Base year 2025
Historic period 2020-2024
Forecast period 2026-2030
Growth momentum & CAGR Accelerate at a CAGR of 4.5%
Market growth 2026-2030 USD 509.5 million
Market structure Fragmented
YoY growth 2025-2026(%) 4.4%
Key countries China, Japan, India, South Korea, Australia, Indonesia, US, Canada, Mexico, Germany, UK, France, Italy, Spain, The Netherlands, Brazil, Argentina, Chile, Saudi Arabia, UAE, South Africa, Israel and Turkey
Competitive landscape Leading Companies, Market Positioning of Companies, Competitive Strategies, and Industry Risks

Request Free Sample

Research Analyst Overview

  • The market landscape demonstrates a fundamental structural shift toward intelligent load management and lightweight structural engineering. Fleet operators systematically replace stationary lifting equipment with versatile mobile systems to execute elevated tasks more efficiently across dispersed job sites. The integration of real-time tip cameras provides operators with critical visual feedback, significantly improving load placement precision in obstructed environments.
  • Concurrently, the implementation of wireless remote controls allows personnel to maneuver loads from optimal vantage points, which has decreased jobsite rigging errors by 30% compared to traditional cab-based operations. Engineering efforts heavily prioritize utilizing counterweight frames that maximize hook height while maintaining highway transportability. This focus ensures seamless compliance with load balancing requirements.
  • Furthermore, the adoption of digital interface controls mitigates structural overload risks, directly enhancing operational safety protocols. These technological enhancements empower utility contractors and construction firms to streamline project timelines, reduce capital expenditure on auxiliary transport, and optimize resource allocation across complex infrastructure developments.

What are the Key Data Covered in this Boom Truck Market Research and Growth Report?

  • What is the expected growth of the Boom Truck Market between 2026 and 2030?

    • USD 509.5 million, at a CAGR of 4.5%

  • What segmentation does the market report cover?

    • The report is segmented by End-user (Construction, Telecom, Transportation and logistics, and Others), Type (Telescopic boom trucks, Articulated boom trucks, Fixed boom trucks, and Specialized boom trucks), Capacity (More than 10-20 metrics tons, Less than 10 metrics tons, and More than 20 metrics tons) and Geography (APAC, North America, Europe, South America, Middle East and Africa)

  • Which regions are analyzed in the report?

    • APAC, North America, Europe, South America and Middle East and Africa

  • What are the key growth drivers and market challenges?

    • Expanding telecommunications and grid modernization spending, Complex highway weight regulation compliance constraints

  • Who are the major players in the Boom Truck Market?

    • Action Construction Equipment, Altec Inc., Amco Veba S.r.l., ATLAS GmbH, Bronto Skylift Oy Ab, Cormach S.r.l., Dur A Lift Inc., Elliott Equipment Inc., Furukawa UNIC Corp., Hiab Corp., Iowa Mold Tooling Co.Inc., Liebherr International AG, Load King Trailers, Manitex Inc., MKG Maschinen und Kranbau GmbH, PALFINGER AG, Sany Heavy Industry Co. Ltd., Tadano Ltd., Terex Corp. and XCMG Group

Market Research Insights

  • The Boom Truck Market is characterized by rapid technological integration aimed at enhancing fleet management and operational safety. Utility operators heavily prioritize equipment that supports grid upgrades and telecom expansions. Advancements in tracking mechanisms have improved fuel consumption efficiency by 18%, significantly lowering overhead costs for fleet operators.
  • Concurrently, the deployment of machinery for fiber optic pole installation and tower upkeep has increased operational throughput by 25% across municipal projects. Additionally, refined monitoring of stabilization limits has reduced jobsite safety incidents by 15%. These efficiency gains highlight a structural shift toward data-driven lifting operations, ensuring maximum equipment uptime and reliable performance across demanding urban environments.

We can help! Our analysts can customize this boom truck market research report to meet your requirements.

Get in touch

1. Executive Summary

1.1 Market overview

Executive Summary - Chart on Market Overview
Executive Summary - Data Table on Market Overview
Executive Summary - Chart on Global Market Characteristics
Executive Summary - Chart on Market by Geography
Executive Summary - Chart on Market Segmentation by End-user
Executive Summary - Chart on Market Segmentation by Type
Executive Summary - Chart on Market Segmentation by Capacity
Executive Summary - Chart on Incremental Growth
Executive Summary - Data Table on Incremental Growth
Executive Summary - Chart on Company Market Positioning

2. Technavio Analysis

2.1 Analysis of price sensitivity, lifecycle, customer purchase basket, adoption rates, and purchase criteria

2.2 Criticality of inputs and Factors of differentiation

Chart on Overview on criticality of inputs and factors of differentiation

2.3 Factors of disruption

Chart on Overview on factors of disruption

2.4 Impact of drivers and challenges

Chart on Impact of drivers and challenges in 2025 and 2030

3. Market Landscape

3.1 Market ecosystem

Chart on Parent Market
Data Table on - Parent Market

3.2 Market characteristics

Chart on Market characteristics analysis

3.3 Value chain analysis

Chart on Value chain analysis

4. Market Sizing

4.1 Market definition

Data Table on Offerings of companies included in the market definition

4.2 Market segment analysis

Market segments

4.3 Market size 2025

4.4 Market outlook: Forecast for 2025-2030

Chart on Global - Market size and forecast 2025-2030 ($ million)
Data Table on Global - Market size and forecast 2025-2030 ($ million)
Chart on Global Market: Year-over-year growth 2025-2030 (%)
Data Table on Global Market: Year-over-year growth 2025-2030 (%)

5. Historic Market Size

5.1 Global Boom Truck Market 2020 - 2024

Historic Market Size - Data Table on Global Boom Truck Market 2020 - 2024 ($ million)

5.2 End-user segment analysis 2020 - 2024

Historic Market Size - End-user Segment 2020 - 2024 ($ million)

5.3 Type segment analysis 2020 - 2024

Historic Market Size - Type Segment 2020 - 2024 ($ million)

5.4 Capacity segment analysis 2020 - 2024

Historic Market Size - Capacity Segment 2020 - 2024 ($ million)

5.5 Geography segment analysis 2020 - 2024

Historic Market Size - Geography Segment 2020 - 2024 ($ million)

5.6 Country segment analysis 2020 - 2024

Historic Market Size - Country Segment 2020 - 2024 ($ million)

6. Qualitative Analysis

6.1 Impact of AI on global boom truck market

6.2 Impact of geopolitical conflicts on global boom truck market

7. Five Forces Analysis

7.1 Five forces summary

Five forces analysis - Comparison between 2025 and 2030

7.2 Bargaining power of buyers

Bargaining power of buyers - Impact of key factors 2025 and 2030

7.3 Bargaining power of suppliers

Bargaining power of suppliers - Impact of key factors in 2025 and 2030

7.4 Threat of new entrants

Threat of new entrants - Impact of key factors in 2025 and 2030

7.5 Threat of substitutes

Threat of substitutes - Impact of key factors in 2025 and 2030

7.6 Threat of rivalry

Threat of rivalry - Impact of key factors in 2025 and 2030

7.7 Market condition

Chart on Market condition - Five forces 2025 and 2030

8. Market Segmentation by End-user

8.1 Market segments

Chart on End-user - Market share 2025-2030 (%)
Data Table on End-user - Market share 2025-2030 (%)

8.2 Comparison by End-user

Chart on Comparison by End-user
Data Table on Comparison by End-user

8.3 Construction - Market size and forecast 2025-2030

Chart on Construction - Market size and forecast 2025-2030 ($ million)
Data Table on Construction - Market size and forecast 2025-2030 ($ million)
Chart on Construction - Year-over-year growth 2025-2030 (%)
Data Table on Construction - Year-over-year growth 2025-2030 (%)

8.4 Telecom - Market size and forecast 2025-2030

Chart on Telecom - Market size and forecast 2025-2030 ($ million)
Data Table on Telecom - Market size and forecast 2025-2030 ($ million)
Chart on Telecom - Year-over-year growth 2025-2030 (%)
Data Table on Telecom - Year-over-year growth 2025-2030 (%)

8.5 Transportation and logistics - Market size and forecast 2025-2030

Chart on Transportation and logistics - Market size and forecast 2025-2030 ($ million)
Data Table on Transportation and logistics - Market size and forecast 2025-2030 ($ million)
Chart on Transportation and logistics - Year-over-year growth 2025-2030 (%)
Data Table on Transportation and logistics - Year-over-year growth 2025-2030 (%)

8.6 Others - Market size and forecast 2025-2030

Chart on Others - Market size and forecast 2025-2030 ($ million)
Data Table on Others - Market size and forecast 2025-2030 ($ million)
Chart on Others - Year-over-year growth 2025-2030 (%)
Data Table on Others - Year-over-year growth 2025-2030 (%)

8.7 Market opportunity by End-user

Market opportunity by End-user ($ million)
Data Table on Market opportunity by End-user ($ million)

9. Market Segmentation by Type

9.1 Market segments

Chart on Type - Market share 2025-2030 (%)
Data Table on Type - Market share 2025-2030 (%)

9.2 Comparison by Type

Chart on Comparison by Type
Data Table on Comparison by Type

9.3 Telescopic boom trucks - Market size and forecast 2025-2030

Chart on Telescopic boom trucks - Market size and forecast 2025-2030 ($ million)
Data Table on Telescopic boom trucks - Market size and forecast 2025-2030 ($ million)
Chart on Telescopic boom trucks - Year-over-year growth 2025-2030 (%)
Data Table on Telescopic boom trucks - Year-over-year growth 2025-2030 (%)

9.4 Articulated boom trucks - Market size and forecast 2025-2030

Chart on Articulated boom trucks - Market size and forecast 2025-2030 ($ million)
Data Table on Articulated boom trucks - Market size and forecast 2025-2030 ($ million)
Chart on Articulated boom trucks - Year-over-year growth 2025-2030 (%)
Data Table on Articulated boom trucks - Year-over-year growth 2025-2030 (%)

9.5 Fixed boom trucks - Market size and forecast 2025-2030

Chart on Fixed boom trucks - Market size and forecast 2025-2030 ($ million)
Data Table on Fixed boom trucks - Market size and forecast 2025-2030 ($ million)
Chart on Fixed boom trucks - Year-over-year growth 2025-2030 (%)
Data Table on Fixed boom trucks - Year-over-year growth 2025-2030 (%)

9.6 Specialized boom trucks - Market size and forecast 2025-2030

Chart on Specialized boom trucks - Market size and forecast 2025-2030 ($ million)
Data Table on Specialized boom trucks - Market size and forecast 2025-2030 ($ million)
Chart on Specialized boom trucks - Year-over-year growth 2025-2030 (%)
Data Table on Specialized boom trucks - Year-over-year growth 2025-2030 (%)

9.7 Market opportunity by Type

Market opportunity by Type ($ million)
Data Table on Market opportunity by Type ($ million)

10. Market Segmentation by Capacity

10.1 Market segments

Chart on Capacity - Market share 2025-2030 (%)
Data Table on Capacity - Market share 2025-2030 (%)

10.2 Comparison by Capacity

Chart on Comparison by Capacity
Data Table on Comparison by Capacity

10.3 More than 10-20 metrics tons - Market size and forecast 2025-2030

Chart on More than 10-20 metrics tons - Market size and forecast 2025-2030 ($ million)
Data Table on More than 10-20 metrics tons - Market size and forecast 2025-2030 ($ million)
Chart on More than 10-20 metrics tons - Year-over-year growth 2025-2030 (%)
Data Table on More than 10-20 metrics tons - Year-over-year growth 2025-2030 (%)

10.4 Less than 10 metrics tons - Market size and forecast 2025-2030

Chart on Less than 10 metrics tons - Market size and forecast 2025-2030 ($ million)
Data Table on Less than 10 metrics tons - Market size and forecast 2025-2030 ($ million)
Chart on Less than 10 metrics tons - Year-over-year growth 2025-2030 (%)
Data Table on Less than 10 metrics tons - Year-over-year growth 2025-2030 (%)

10.5 More than 20 metrics tons - Market size and forecast 2025-2030

Chart on More than 20 metrics tons - Market size and forecast 2025-2030 ($ million)
Data Table on More than 20 metrics tons - Market size and forecast 2025-2030 ($ million)
Chart on More than 20 metrics tons - Year-over-year growth 2025-2030 (%)
Data Table on More than 20 metrics tons - Year-over-year growth 2025-2030 (%)

10.6 Market opportunity by Capacity

Market opportunity by Capacity ($ million)
Data Table on Market opportunity by Capacity ($ million)

11. Customer Landscape

11.1 Customer landscape overview

Analysis of price sensitivity, lifecycle, customer purchase basket, adoption rates, and purchase criteria

12. Geographic Landscape

12.1 Geographic segmentation

Chart on Market share by geography 2025-2030 (%)
Data Table on Market share by geography 2025-2030 (%)

12.2 Geographic comparison

Chart on Geographic comparison
Data Table on Geographic comparison

12.3 APAC - Market size and forecast 2025-2030

Chart on APAC - Market size and forecast 2025-2030 ($ million)
Data Table on APAC - Market size and forecast 2025-2030 ($ million)
Chart on APAC - Year-over-year growth 2025-2030 (%)
Data Table on APAC - Year-over-year growth 2025-2030 (%)
Chart on Regional Comparison - APAC
Data Table on Regional Comparison - APAC

12.3.1 China - Market size and forecast 2025-2030

Chart on China - Market size and forecast 2025-2030 ($ million)
Data Table on China - Market size and forecast 2025-2030 ($ million)
Chart on China - Year-over-year growth 2025-2030 (%)
Data Table on China - Year-over-year growth 2025-2030 (%)

12.3.2 Japan - Market size and forecast 2025-2030

Chart on Japan - Market size and forecast 2025-2030 ($ million)
Data Table on Japan - Market size and forecast 2025-2030 ($ million)
Chart on Japan - Year-over-year growth 2025-2030 (%)
Data Table on Japan - Year-over-year growth 2025-2030 (%)

12.3.3 India - Market size and forecast 2025-2030

Chart on India - Market size and forecast 2025-2030 ($ million)
Data Table on India - Market size and forecast 2025-2030 ($ million)
Chart on India - Year-over-year growth 2025-2030 (%)
Data Table on India - Year-over-year growth 2025-2030 (%)

12.3.4 South Korea - Market size and forecast 2025-2030

Chart on South Korea - Market size and forecast 2025-2030 ($ million)
Data Table on South Korea - Market size and forecast 2025-2030 ($ million)
Chart on South Korea - Year-over-year growth 2025-2030 (%)
Data Table on South Korea - Year-over-year growth 2025-2030 (%)

12.3.5 Australia - Market size and forecast 2025-2030

Chart on Australia - Market size and forecast 2025-2030 ($ million)
Data Table on Australia - Market size and forecast 2025-2030 ($ million)
Chart on Australia - Year-over-year growth 2025-2030 (%)
Data Table on Australia - Year-over-year growth 2025-2030 (%)

12.3.6 Indonesia - Market size and forecast 2025-2030

Chart on Indonesia - Market size and forecast 2025-2030 ($ million)
Data Table on Indonesia - Market size and forecast 2025-2030 ($ million)
Chart on Indonesia - Year-over-year growth 2025-2030 (%)
Data Table on Indonesia - Year-over-year growth 2025-2030 (%)

12.4 North America - Market size and forecast 2025-2030

Chart on North America - Market size and forecast 2025-2030 ($ million)
Data Table on North America - Market size and forecast 2025-2030 ($ million)
Chart on North America - Year-over-year growth 2025-2030 (%)
Data Table on North America - Year-over-year growth 2025-2030 (%)
Chart on Regional Comparison - North America
Data Table on Regional Comparison - North America

12.4.1 US - Market size and forecast 2025-2030

Chart on US - Market size and forecast 2025-2030 ($ million)
Data Table on US - Market size and forecast 2025-2030 ($ million)
Chart on US - Year-over-year growth 2025-2030 (%)
Data Table on US - Year-over-year growth 2025-2030 (%)

12.4.2 Canada - Market size and forecast 2025-2030

Chart on Canada - Market size and forecast 2025-2030 ($ million)
Data Table on Canada - Market size and forecast 2025-2030 ($ million)
Chart on Canada - Year-over-year growth 2025-2030 (%)
Data Table on Canada - Year-over-year growth 2025-2030 (%)

12.4.3 Mexico - Market size and forecast 2025-2030

Chart on Mexico - Market size and forecast 2025-2030 ($ million)
Data Table on Mexico - Market size and forecast 2025-2030 ($ million)
Chart on Mexico - Year-over-year growth 2025-2030 (%)
Data Table on Mexico - Year-over-year growth 2025-2030 (%)

12.5 Europe - Market size and forecast 2025-2030

Chart on Europe - Market size and forecast 2025-2030 ($ million)
Data Table on Europe - Market size and forecast 2025-2030 ($ million)
Chart on Europe - Year-over-year growth 2025-2030 (%)
Data Table on Europe - Year-over-year growth 2025-2030 (%)
Chart on Regional Comparison - Europe
Data Table on Regional Comparison - Europe

12.5.1 Germany - Market size and forecast 2025-2030

Chart on Germany - Market size and forecast 2025-2030 ($ million)
Data Table on Germany - Market size and forecast 2025-2030 ($ million)
Chart on Germany - Year-over-year growth 2025-2030 (%)
Data Table on Germany - Year-over-year growth 2025-2030 (%)

12.5.2 UK - Market size and forecast 2025-2030

Chart on UK - Market size and forecast 2025-2030 ($ million)
Data Table on UK - Market size and forecast 2025-2030 ($ million)
Chart on UK - Year-over-year growth 2025-2030 (%)
Data Table on UK - Year-over-year growth 2025-2030 (%)

12.5.3 France - Market size and forecast 2025-2030

Chart on France - Market size and forecast 2025-2030 ($ million)
Data Table on France - Market size and forecast 2025-2030 ($ million)
Chart on France - Year-over-year growth 2025-2030 (%)
Data Table on France - Year-over-year growth 2025-2030 (%)

12.5.4 Italy - Market size and forecast 2025-2030

Chart on Italy - Market size and forecast 2025-2030 ($ million)
Data Table on Italy - Market size and forecast 2025-2030 ($ million)
Chart on Italy - Year-over-year growth 2025-2030 (%)
Data Table on Italy - Year-over-year growth 2025-2030 (%)

12.5.5 Spain - Market size and forecast 2025-2030

Chart on Spain - Market size and forecast 2025-2030 ($ million)
Data Table on Spain - Market size and forecast 2025-2030 ($ million)
Chart on Spain - Year-over-year growth 2025-2030 (%)
Data Table on Spain - Year-over-year growth 2025-2030 (%)

12.5.6 The Netherlands - Market size and forecast 2025-2030

Chart on The Netherlands - Market size and forecast 2025-2030 ($ million)
Data Table on The Netherlands - Market size and forecast 2025-2030 ($ million)
Chart on The Netherlands - Year-over-year growth 2025-2030 (%)
Data Table on The Netherlands - Year-over-year growth 2025-2030 (%)

12.6 South America - Market size and forecast 2025-2030

Chart on South America - Market size and forecast 2025-2030 ($ million)
Data Table on South America - Market size and forecast 2025-2030 ($ million)
Chart on South America - Year-over-year growth 2025-2030 (%)
Data Table on South America - Year-over-year growth 2025-2030 (%)
Chart on Regional Comparison - South America
Data Table on Regional Comparison - South America

12.6.1 Brazil - Market size and forecast 2025-2030

Chart on Brazil - Market size and forecast 2025-2030 ($ million)
Data Table on Brazil - Market size and forecast 2025-2030 ($ million)
Chart on Brazil - Year-over-year growth 2025-2030 (%)
Data Table on Brazil - Year-over-year growth 2025-2030 (%)

12.6.2 Argentina - Market size and forecast 2025-2030

Chart on Argentina - Market size and forecast 2025-2030 ($ million)
Data Table on Argentina - Market size and forecast 2025-2030 ($ million)
Chart on Argentina - Year-over-year growth 2025-2030 (%)
Data Table on Argentina - Year-over-year growth 2025-2030 (%)

12.6.3 Chile - Market size and forecast 2025-2030

Chart on Chile - Market size and forecast 2025-2030 ($ million)
Data Table on Chile - Market size and forecast 2025-2030 ($ million)
Chart on Chile - Year-over-year growth 2025-2030 (%)
Data Table on Chile - Year-over-year growth 2025-2030 (%)

12.7 Middle East and Africa - Market size and forecast 2025-2030

Chart on Middle East and Africa - Market size and forecast 2025-2030 ($ million)
Data Table on Middle East and Africa - Market size and forecast 2025-2030 ($ million)
Chart on Middle East and Africa - Year-over-year growth 2025-2030 (%)
Data Table on Middle East and Africa - Year-over-year growth 2025-2030 (%)
Chart on Regional Comparison - Middle East and Africa
Data Table on Regional Comparison - Middle East and Africa

12.7.1 Saudi Arabia - Market size and forecast 2025-2030

Chart on Saudi Arabia - Market size and forecast 2025-2030 ($ million)
Data Table on Saudi Arabia - Market size and forecast 2025-2030 ($ million)
Chart on Saudi Arabia - Year-over-year growth 2025-2030 (%)
Data Table on Saudi Arabia - Year-over-year growth 2025-2030 (%)

12.7.2 UAE - Market size and forecast 2025-2030

Chart on UAE - Market size and forecast 2025-2030 ($ million)
Data Table on UAE - Market size and forecast 2025-2030 ($ million)
Chart on UAE - Year-over-year growth 2025-2030 (%)
Data Table on UAE - Year-over-year growth 2025-2030 (%)

12.7.3 South Africa - Market size and forecast 2025-2030

Chart on South Africa - Market size and forecast 2025-2030 ($ million)
Data Table on South Africa - Market size and forecast 2025-2030 ($ million)
Chart on South Africa - Year-over-year growth 2025-2030 (%)
Data Table on South Africa - Year-over-year growth 2025-2030 (%)

12.7.4 Israel - Market size and forecast 2025-2030

Chart on Israel - Market size and forecast 2025-2030 ($ million)
Data Table on Israel - Market size and forecast 2025-2030 ($ million)
Chart on Israel - Year-over-year growth 2025-2030 (%)
Data Table on Israel - Year-over-year growth 2025-2030 (%)

12.7.5 Turkey - Market size and forecast 2025-2030

Chart on Turkey - Market size and forecast 2025-2030 ($ million)
Data Table on Turkey - Market size and forecast 2025-2030 ($ million)
Chart on Turkey - Year-over-year growth 2025-2030 (%)
Data Table on Turkey - Year-over-year growth 2025-2030 (%)

12.8 Market opportunity by geography

Market opportunity by geography ($ million)
Data Tables on Market opportunity by geography ($ million)

13. Drivers, Challenges, and Opportunity

13.1 Market drivers

Expanding telecommunications and grid modernization spending
Growth in modular construction and building
Cost efficiency over traditional mobile cranes

13.2 Market challenges

Complex highway weight regulation compliance constraints
Volatile chassis supply and assembly delays
Rising capital expenditure and maintenance overhead

13.3 Impact of drivers and challenges

Impact of drivers and challenges in 2025 and 2030

13.4 Market opportunities

Integration of advanced telematics and control
Development of higher capacity roadable units
Transition toward electrification and hybrid systems

14. Competitive Landscape

14.1 Overview

14.2

Overview on criticality of inputs and factors of differentiation

14.3 Landscape disruption

Overview on factors of disruption

14.4 Industry risks

Impact of key risks on business

15. Competitive Analysis

15.1 Companies profiled

Companies covered

15.2 Company ranking index

15.3 Market positioning of companies

Matrix on companies position and classification

15.4 Altec Inc.

Altec Inc. - Overview
Altec Inc. - Product / Service
Altec Inc. - Key offerings
SWOT

15.5 ATLAS GmbH

ATLAS GmbH - Overview
ATLAS GmbH - Product / Service
ATLAS GmbH - Key offerings
SWOT

15.6 Bronto Skylift Oy Ab

Bronto Skylift Oy Ab - Overview
Bronto Skylift Oy Ab - Product / Service
Bronto Skylift Oy Ab - Key offerings
SWOT

15.7 Furukawa UNIC Corp.

Furukawa UNIC Corp. - Overview
Furukawa UNIC Corp. - Product / Service
Furukawa UNIC Corp. - Key offerings
SWOT

15.8 Hiab Corp.

Hiab Corp. - Overview
Hiab Corp. - Business segments
Hiab Corp. - Key offerings
Hiab Corp. - Segment focus
SWOT

15.9 Iowa Mold Tooling Co.Inc.

Iowa Mold Tooling Co.Inc. - Overview
Iowa Mold Tooling Co.Inc. - Product / Service
Iowa Mold Tooling Co.Inc. - Key offerings
SWOT

15.10 Liebherr International AG

Liebherr International AG - Overview
Liebherr International AG - Product / Service
Liebherr International AG - Key offerings
SWOT

15.11 Load King Trailers

Load King Trailers - Overview
Load King Trailers - Product / Service
Load King Trailers - Key offerings
SWOT

15.12 Manitex Inc.

Manitex Inc. - Overview
Manitex Inc. - Product / Service
Manitex Inc. - Key offerings
SWOT

15.13 MKG Maschinen und Kranbau GmbH

MKG Maschinen und Kranbau GmbH - Overview
MKG Maschinen und Kranbau GmbH - Product / Service
MKG Maschinen und Kranbau GmbH - Key offerings
SWOT

15.14 PALFINGER AG

PALFINGER AG - Overview
PALFINGER AG - Business segments
PALFINGER AG - Key offerings
PALFINGER AG - Segment focus
SWOT

15.15 Sany Heavy Industry Co. Ltd.

Sany Heavy Industry Co. Ltd. - Overview
Sany Heavy Industry Co. Ltd. - Business segments
Sany Heavy Industry Co. Ltd. - Key offerings
Sany Heavy Industry Co. Ltd. - Segment focus
SWOT

15.16 Tadano Ltd.

Tadano Ltd. - Overview
Tadano Ltd. - Business segments
Tadano Ltd. - Key offerings
Tadano Ltd. - Segment focus
SWOT

15.17 Terex Corp.

Terex Corp. - Overview
Terex Corp. - Business segments
Terex Corp. - Key offerings
Terex Corp. - Segment focus
SWOT

15.18 XCMG Group

XCMG Group - Overview
XCMG Group - Business segments
XCMG Group - Key offerings
XCMG Group - Segment focus
SWOT

16. Appendix

16.1 Scope of the report

Market definition
Objectives
Notes and caveats

16.2 Inclusions and exclusions checklist

Inclusions checklist
Exclusions checklist

16.3 Currency conversion rates for US$

16.4 Research methodology

16.5 Data procurement

Information sources

16.6 Data validation

16.7 Validation techniques employed for market sizing

16.8 Data synthesis

16.9 360 degree market analysis

16.10 List of abbreviations

Research Methodology

Technavio presents a detailed picture of the market by way of study, synthesis, and summation of data from multiple sources. The analysts have presented the various facets of the market with a particular focus on identifying the key industry influencers. The data thus presented is comprehensive, reliable, and the result of extensive research, both primary and secondary.

INFORMATION SOURCES

Primary sources

  • Manufacturers and suppliers
  • Channel partners
  • Industry experts
  • Strategic decision makers

Secondary sources

  • Industry journals and periodicals
  • Government data
  • Financial reports of key industry players
  • Historical data
  • Press releases

DATA ANALYSIS

Data Synthesis

  • Collation of data
  • Estimation of key figures
  • Analysis of derived insights

Data Validation

  • Triangulation with data models
  • Reference against proprietary databases
  • Corroboration with industry experts

REPORT WRITING

Qualitative

  • Market drivers
  • Market challenges
  • Market trends
  • Five forces analysis

Quantitative

  • Market size and forecast
  • Market segmentation
  • Geographical insights
  • Competitive landscape

Interested in this report?

Get your sample now to see our research methodology and insights!

Download Now

Frequently Asked Questions

Boom Truck market growth will increase by USD 509.5 million during 2026-2030.

The Boom Truck market is expected to grow at a CAGR of 4.5% during 2026-2030.

Boom Truck market is segmented by End-user (Construction, Telecom, Transportation and logistics, Others) Type (Telescopic boom trucks, Articulated boom trucks, Fixed boom trucks, Specialized boom trucks) Capacity (More than 10-20 metrics tons, Less than 10 metrics tons, More than 20 metrics tons)

Action Construction Equipment, Altec Inc., Amco Veba S.r.l., ATLAS GmbH, Bronto Skylift Oy Ab, Cormach S.r.l., Dur A Lift Inc., Elliott Equipment Inc., Furukawa UNIC Corp., Hiab Corp., Iowa Mold Tooling Co.Inc., Liebherr International AG, Load King Trailers, Manitex Inc., MKG Maschinen und Kranbau GmbH, PALFINGER AG, Sany Heavy Industry Co. Ltd., Tadano Ltd., Terex Corp., XCMG Group are a few of the key vendors in the Boom Truck market.

APAC will register the highest growth rate of 47.6% among the other regions. Therefore, the Boom Truck market in APAC is expected to garner significant business opportunities for the vendors during the forecast period.

China, Japan, India, South Korea, Australia, Indonesia, US, Canada, Mexico, Germany, UK, France, Italy, Spain, The Netherlands, Brazil, Argentina, Chile, Saudi Arabia, UAE, South Africa, Israel, Turkey

  • Expanding telecommunications and grid modernization spending is the driving factor this market.

The Boom Truck market vendors should focus on grabbing business opportunities from the End-user segment as it accounted for the largest market share in the base year.
RIA - Research AI Assistant
Ask RIA
