
BRAF Kinase Inhibitors Market Size 2025-2029
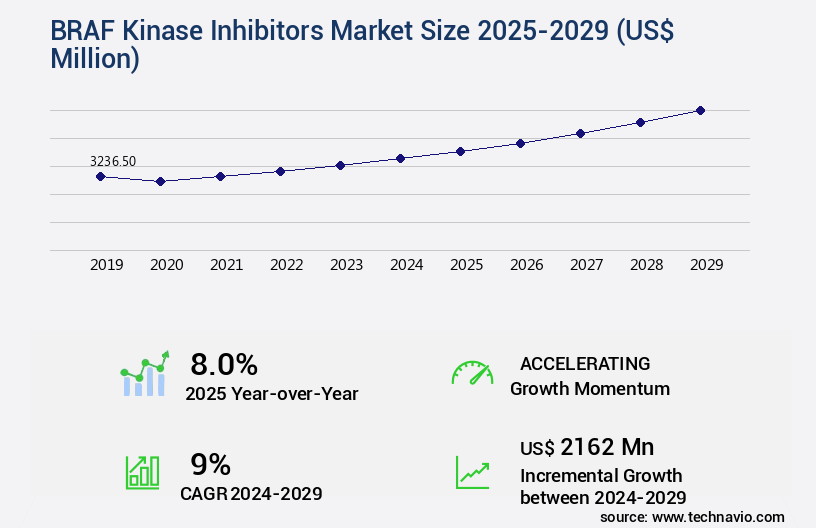
The BRAF kinase inhibitors market size is valued to increase USD 2.16 billion, at a CAGR of 9% from 2024 to 2029. High target affinity and specificity of BRAF Kinase inhibitors will drive the BRAF kinase inhibitors market.
Major Market Trends & Insights
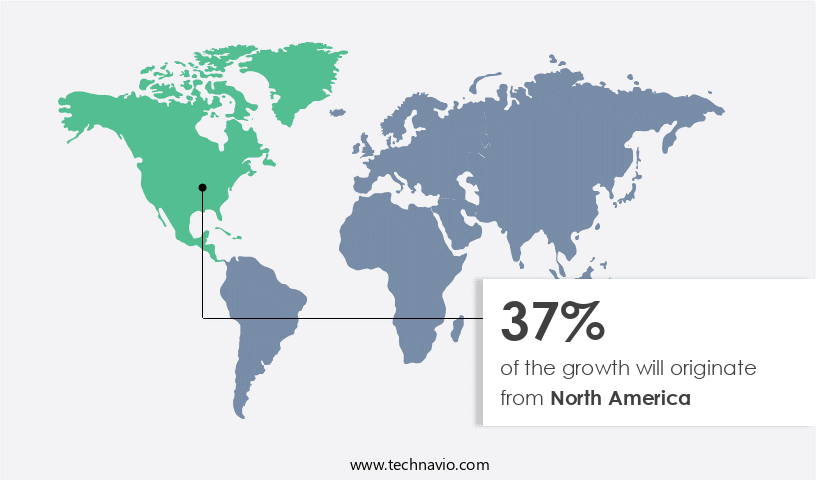
- North America dominated the market and accounted for a 37% growth during the forecast period.
- By Product - Dabrafenib segment was valued at USD 1.45 billion in 2023
- By Distribution Channel - Hospital pharmacies segment accounted for the largest market revenue share in 2023
Market Size & Forecast
- Market Opportunities: USD 91.02 million
- Market Future Opportunities: USD 2162.00 million
- CAGR : 9%
- North America: Largest market in 2023
Market Summary
- The market represents a significant and dynamic sector in the pharmaceutical industry, driven by the continuous advancements in cancer research and the growing demand for targeted therapies. These inhibitors work by blocking the activity of the BRAF gene mutation, which is linked to various types of cancer. The core technologies and applications of BRAF kinase inhibitors are expanding, with an increasing focus on personalized medicine and combination therapies. The market is segmented into various product categories, including small molecule inhibitors and Monoclonal antibodies.
- Despite the market's promising growth, it faces challenges such as high target affinity and specificity requirements, as well as the availability of substitute therapies. According to a recent study, the small molecule inhibitors segment is expected to dominate the market, accounting for over 60% of the market share. Regulatory approvals and regional market trends are also key factors influencing the evolving patterns in the market.
What will be the Size of the BRAF Kinase Inhibitors Market during the forecast period?
Get Key Insights on Market Forecast (PDF) Request Free Sample
How is the BRAF Kinase Inhibitors Market Segmented and what are the key trends of market segmentation?
The braf kinase inhibitors industry research report provides comprehensive data (region-wise segment analysis), with forecasts and estimates in "USD million" for the period 2025-2029, as well as historical data from 2019-2023 for the following segments.
- Product
- Dabrafenib
- Sorafenib
- Vemurafenib
- Encorafenib
- Distribution Channel
- Hospital pharmacies
- Retail pharmacies
- Online pharmacies
- Indication
- Metastatic melanoma
- Metastatic lung cancer
- Others
- Geography
- North America
- US
- Canada
- Europe
- France
- Germany
- Italy
- UK
- APAC
- China
- India
- Japan
- South America
- Brazil
- Rest of World (ROW)
- North America
By Product Insights
The dabrafenib segment is estimated to witness significant growth during the forecast period.
Dabrafenib, an orally administered BRAF kinase inhibitor sold under the brand name TAFINLAR, holds significant market importance due to its efficacy in treating cancers linked to a mutated BRAF gene. This drug inhibits the BRAF enzyme, which regulates cell growth, and exhibits clinical activity with a manageable safety and efficacy profile in patients with BRAF(V600)-mutated metastatic melanoma. The market for this drug experiences growth, with approximately 25% of metastatic melanoma patients and 30% of thyroid cancer patients diagnosed with the BRAF V600 mutation. The lung cancer segment, which accounts for a substantial portion of this market, is driven by the approval of dabrafenib as the only BRAF inhibitor for treating NSCLC with the BRAF V600E mutation.
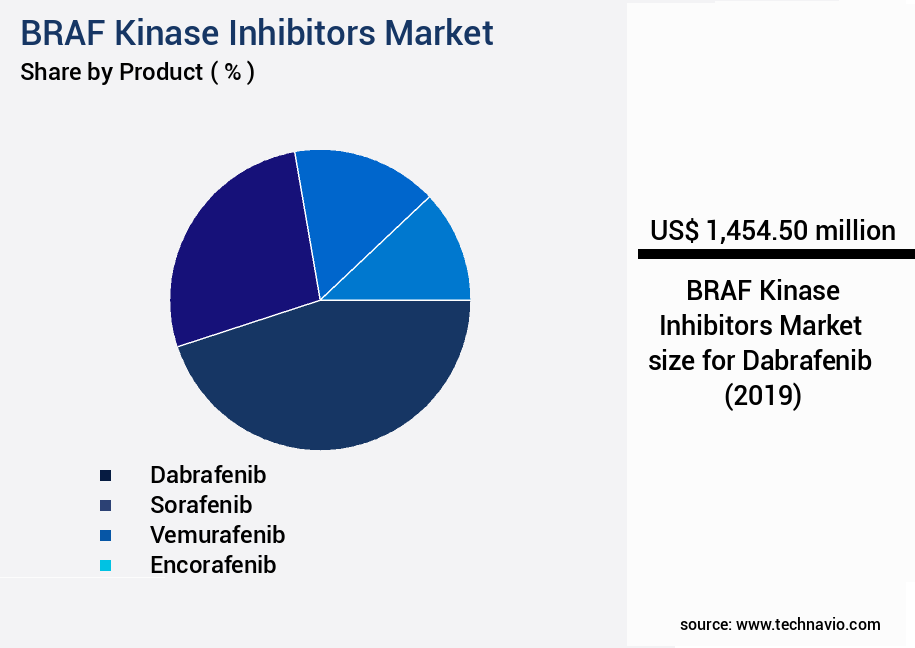
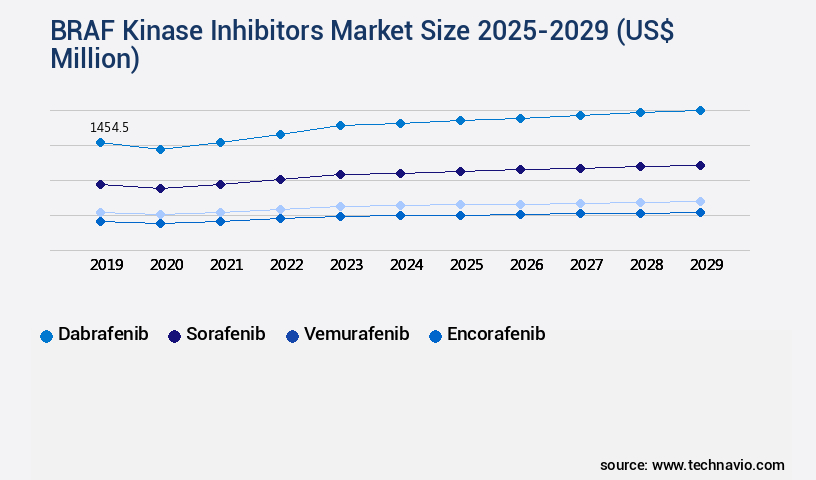
The Dabrafenib segment was valued at USD 1.45 billion in 2019 and showed a gradual increase during the forecast period.
The market expansion is further fueled by the high prevalence of lung and thyroid cancers. Dabrafenib also targets other mutated forms of BRAF kinases, including BRAF V600E, BRAF V600K, and BRAF V600D. The ongoing development of combination therapy regimens, such as dabrafenib in combination with trametinib, further enhances the drug's potential impact on the market. In vitro efficacy studies and pharmacodynamic effects demonstrate the synergistic interaction between these drugs, leading to tumor regression rates and improved progression-free survival. The regulatory approval pathways for these combination therapies are underway, with promising results. Pharmacokinetic parameters and dose-response relationships are being studied to optimize treatment response biomarkers and personalized oncology approaches.
The market for BRAF kinase inhibitors, particularly dabrafenib, is poised for continued growth, with expectations of approximately 30% of the market share in the targeted cancer therapy sector by 2025. The ongoing research and development in this field, including allosteric inhibitors and drug resistance mechanisms, ensure a dynamic and evolving market landscape.
Regional Analysis
North America is estimated to contribute 37% to the growth of the global market during the forecast period. Technavio's analysts have elaborately explained the regional trends and drivers that shape the market during the forecast period.
See How BRAF Kinase Inhibitors Market Demand is Rising in North America Request Free Sample
The North American market for BRAF kinase inhibitors holds a significant share in the global industry, fueled by advanced healthcare infrastructure, high awareness of targeted cancer therapies, and the presence of leading pharmaceutical companies. The region's prominent position is attributed to early adoption of innovative oncology treatments, robust clinical research, and favorable regulatory frameworks. The United States, in particular, is a key contributor due to extensive investment in cancer research and a well-established pipeline of BRAF-targeted therapies. Major academic institutions and cancer centers further facilitate ongoing clinical trials and the development of next-generation inhibitors.
The North American market is bolstered by a growing patient population diagnosed with BRAF-mutant cancers, such as melanoma, colorectal cancer, and non-small cell lung cancer. With these factors driving market growth, the North American market is expected to remain dynamic and innovative.
Market Dynamics
Our researchers analyzed the data with 2024 as the base year, along with the key drivers, trends, and challenges. A holistic analysis of drivers will help companies refine their marketing strategies to gain a competitive advantage.
The market represents a significant segment in the oncology therapeutics industry, with ongoing research and development efforts focused on advancing the use of these drugs in cancer treatment. BRAF V600e inhibitor combination therapy has emerged as a promising approach, particularly in the treatment of melanoma and other cancers with BRAF mutations. However, the development of acquired resistance mechanisms, such as those observed in preclinical models of BRAF inhibitor resistance, poses a challenge to the long-term efficacy of these therapies. Pharmaceutical companies are investing in the identification of biomarkers predicting BRAF inhibitor response to improve patient selection and increase treatment efficacy.
The pharmacokinetic and pharmacodynamic properties of various BRAF inhibitors are under close scrutiny to optimize dosing and minimize adverse events, which include gastrointestinal disturbances and skin toxicity. Clinical trial results analysis reveals that BRAF inhibitors, such as vemurafenib and dabrafenib, demonstrate significant response rates in various cancers. However, the comparison of their efficacy with other targeted therapies, such as MEK inhibitors, is an ongoing area of research. The impact of BRAF inhibitor resistance on patient outcomes underscores the need for the development of novel BRAF inhibitors targeting resistance mechanisms. Next-generation BRAF inhibitors, including those with improved selectivity and reduced toxicity, are in clinical development.
The cost-effectiveness of BRAF inhibitors in cancer care is a critical consideration, with ongoing efforts to optimize treatment regimens and minimize adverse events. Strategies to overcome BRAF inhibitor resistance, such as combination therapies and targeted approaches, are also under investigation. According to recent studies, the median progression-free survival (PFS) for patients treated with BRAF inhibitors is approximately 6-8 months, compared to 2-3 months for those receiving standard chemotherapy. This comparison highlights the potential benefits of BRAF inhibitor therapy in cancer treatment. However, continuous monitoring of response to BRAF inhibitor therapy and managing BRAF inhibitor-induced toxicity are essential to ensure optimal patient outcomes.
Long-term efficacy data are needed to fully understand the role of BRAF inhibitors in personalized cancer treatment.
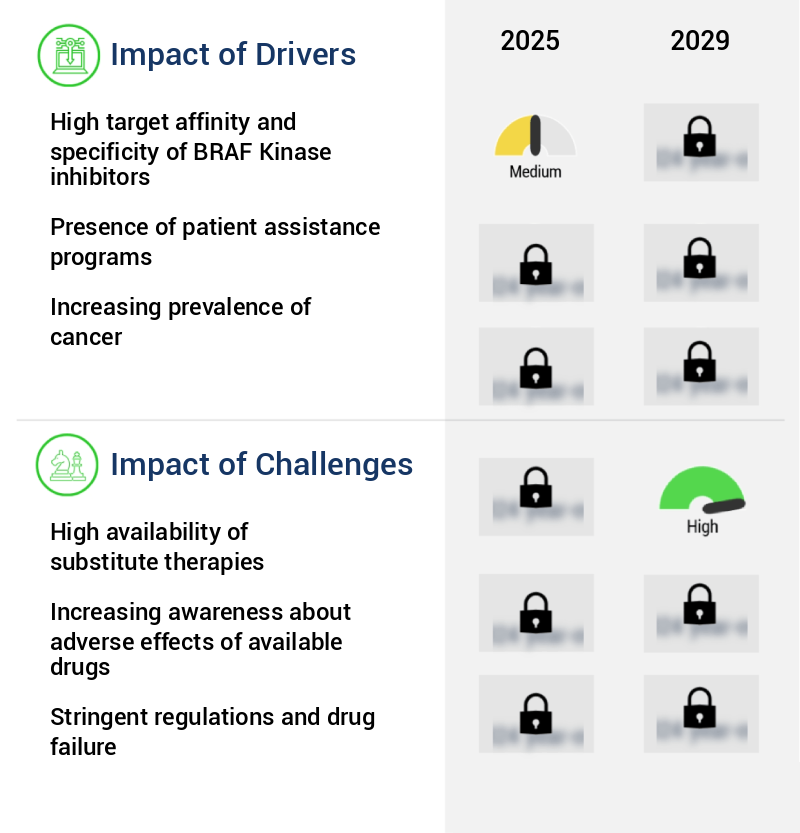
What are the key market drivers leading to the rise in the adoption of BRAF Kinase Inhibitors Industry?
- The high target affinity and specificity of BRAF Kinase inhibitors are crucial factors driving the market's growth, given their effectiveness in selectively inhibiting the BRAF kinase protein and offering potential therapeutic benefits for various diseases.
- The market is witnessing substantial expansion due to the superior target affinity and specificity of these inhibitors. This attribute allows for precise targeting of cancer cells carrying BRAF mutations, particularly the V600E/K variants, while minimizing damage to healthy cells. The high molecular specificity of BRAF inhibitors significantly enhances therapeutic efficacy and reduces the adverse effects commonly associated with traditional chemotherapy. Drugs like dabrafenib and sorafenib exemplify this targeted approach, delivering substantial clinical benefits in the treatment of various malignancies, including melanoma, non-small cell lung cancer (NSCLC), hepatocellular carcinoma (HCC), and renal cell carcinoma (RCC).
- The continuous evolution of this market is driven by ongoing research and development efforts to improve therapeutic outcomes and expand the application scope of BRAF inhibitors across diverse sectors. This targeted approach to cancer treatment is revolutionizing the landscape of oncology, offering hope to patients and healthcare providers alike.
What are the market trends shaping the BRAF Kinase Inhibitors Industry?
- The expansion of research areas in BRAF kinase inhibitors is an emerging market trend. This exploration of new applications and advancements in BRAF kinase inhibitor technology is a significant development in the pharmaceutical industry.
- BRAF kinase inhibitors have gained significant attention in oncology as a transformative class of targeted therapies. These inhibitors, including vemurafenib, dabrafenib, and encorafenib, have shown remarkable efficacy in treating various cancers, such as non-small cell lung cancer (NSCLC), melanoma, and renal cell carcinoma (RCC). The BRAF gene mutations, particularly the V600E mutation, are targeted, leading to inhibition of uncontrolled cell growth. Currently, these inhibitors are approved for clinical use across multiple cancer types. Pharmaceutical companies are actively investigating their potential in treating a broader range of malignancies, including colorectal, thyroid, and brain cancers.
- The high specificity and potent activity of BRAF inhibitors have fueled interest in expanding their therapeutic applications beyond approved indications. In the ever-evolving landscape of oncology, the role of BRAF kinase inhibitors continues to unfold, offering new possibilities for cancer treatment.
What challenges does the BRAF Kinase Inhibitors Industry face during its growth?
- The high availability of substitute therapies poses a significant challenge to the industry's growth trajectory. This issue, which is of great concern to industry professionals, arises from the abundance of alternative treatment options that can impact the demand for traditional therapies and hinder market expansion.
- The oncology market encompasses a diverse range of treatment modalities for carcinomas, including radiation therapy, surgery, and laser therapy, as well as therapeutic options such as chemotherapies, targeted therapies, and biologics. Currently, only four BRAF kinase inhibitors are approved for treating select oncology indications. However, the dominance of chemotherapy and generic small-molecule drugs in the market landscape is shifting. The trend toward biological therapies is gaining momentum due to their increased efficiency compared to BRAF kinase inhibitors.
- NSCLC and melanomas are among the oncology conditions where these alternatives are increasingly preferred as first-line therapy. The market's evolution reflects a continuous unfolding of new treatment options and patterns, making it a dynamic and evolving space in healthcare.
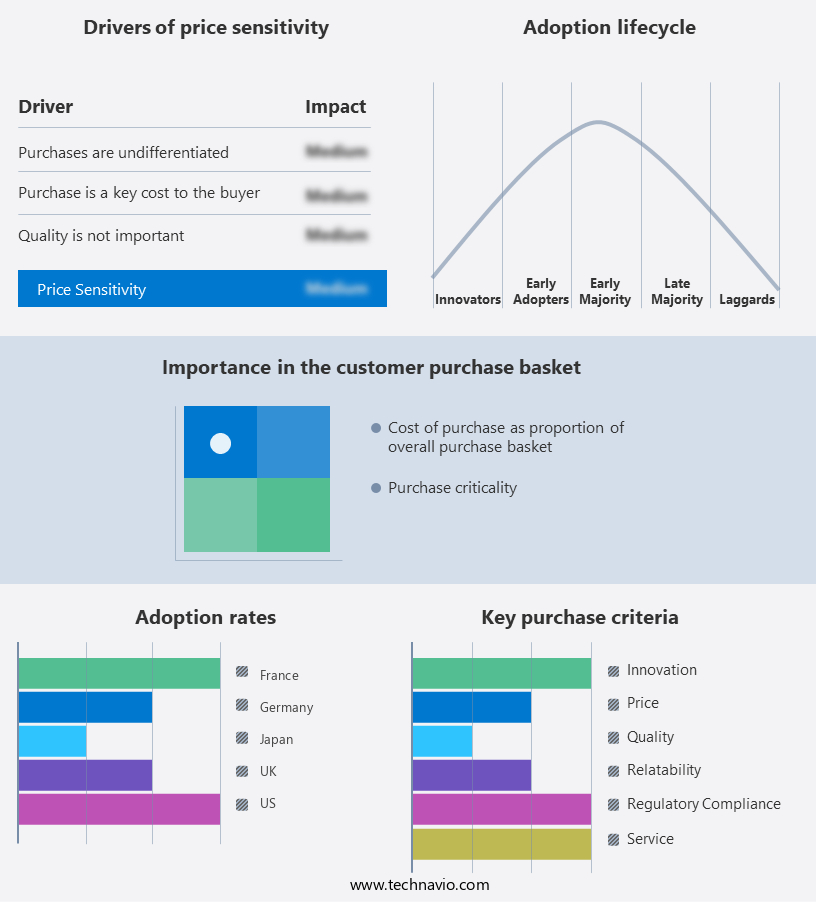
Exclusive Customer Landscape
The BRAF kinase inhibitors market forecasting report includes the adoption lifecycle of the market, covering from the innovator's stage to the laggard's stage. It focuses on adoption rates in different regions based on penetration. Furthermore, the BRAF kinase inhibitors market report also includes key purchase criteria and drivers of price sensitivity to help companies evaluate and develop their market growth analysis strategies.
Customer Landscape of BRAF Kinase Inhibitors Industry
Competitive Landscape & Market Insights
Companies are implementing various strategies, such as strategic alliances, braf kinase inhibitors market forecast, partnerships, mergers and acquisitions, geographical expansion, and product/service launches, to enhance their presence in the industry.
Asana BioSciences LLC - The company specializes in BRAF kinase inhibitors, including ASN003, a highly selective inhibitor targeting both BRAF and PI3K kinases. ASN003 exhibits potent inhibition of BRAF and PI3 pha and delta kinases, offering significant therapeutic potential.
The industry research and growth report includes detailed analyses of the competitive landscape of the market and information about key companies, including:
- Asana BioSciences LLC
- Bayer AG
- BeiGene Ltd.
- F. Hoffmann La Roche Ltd.
- Fore Biotherapeutics
- Jazz Pharmaceuticals Plc
- Kinnate Biopharma Inc.
- Nerviano Medical Sciences S.r.l
- Novartis AG
- Ono Pharmaceutical Co. Ltd.
- Pfizer Inc.
- Pierre Fabre SA
Qualitative and quantitative analysis of companies has been conducted to help clients understand the wider business environment as well as the strengths and weaknesses of key industry players. Data is qualitatively analyzed to categorize companies as pure play, category-focused, industry-focused, and diversified; it is quantitatively analyzed to categorize companies as dominant, leading, strong, tentative, and weak.
Recent Development and News in BRAF Kinase Inhibitors Market
- In January 2024, Pfizer Inc. Announced the approval of its BRAF kinase inhibitor, Braftovi (encorafenib), in combination with binimetinib and cetrelimab, for the treatment of advanced unresectable or metastatic melanoma in the European Union. This triple combination therapy, marketed as TRI-targeted therapy, represents a significant advancement in the treatment of melanoma and expands the market potential for BRAF kinase inhibitors (Pfizer Press Release, 2024).
- In March 2024, Merck KGaA and Pfizer entered into a strategic collaboration to co-develop and commercialize Bavencio (avelumab), Merck KGaA's PD-L1 checkpoint inhibitor, in combination with Merck & Co. Inc.'s BRAF kinase inhibitor, Mektovi (trametinib), for the treatment of advanced BRAF V600E mutation-positive melanoma. This collaboration strengthens both companies' positions in the oncology market and broadens the application of BRAF kinase inhibitors (Merck KGaA Press Release, 2024).
- In May 2024, Novartis announced the US Food and Drug Administration (FDA) approval of its BRAF kinase inhibitor, Tafinlar (dabrafenib), in combination with Mektovi for the adjuvant treatment of patients with melanoma with a BRAF V600E or V600K mutation, following complete resection. This approval marks the first adjuvant indication for a BRAF kinase inhibitor and opens a new market segment for these drugs (Novartis Press Release, 2024).
- In April 2025, Roche's BRAF kinase inhibitor, Zelboraf (vemurafenib), received approval from the Chinese National Medical Products Administration for the treatment of metastatic melanoma with the BRAF V600 mutation. This approval expands the geographic reach of Zelboraf and strengthens Roche's presence in the Chinese oncology market (Roche Press Release, 2025).
Dive into Technavio's robust research methodology, blending expert interviews, extensive data synthesis, and validated models for unparalleled BRAF Kinase Inhibitors Market insights. See full methodology.
|
Market Scope |
|
|
Report Coverage |
Details |
|
Page number |
208 |
|
Base year |
2024 |
|
Historic period |
2019-2023 |
|
Forecast period |
2025-2029 |
|
Growth momentum & CAGR |
Accelerate at a CAGR of 9% |
|
Market growth 2025-2029 |
USD 2162 million |
|
Market structure |
Concentrated |
|
YoY growth 2024-2025(%) |
8.0 |
|
Key countries |
US, Germany, UK, Canada, Japan, Brazil, France, China, Italy, and India |
|
Competitive landscape |
Leading Companies, Market Positioning of Companies, Competitive Strategies, and Industry Risks |
Research Analyst Overview
- The market is characterized by continuous advancements and evolving patterns in targeted cancer therapy. This dynamic market is driven by the ongoing research and development in the field of cellular signaling, particularly in relation to the MAPK pathway and its role in oncogenic BRAF signaling. One significant area of focus is the optimization of patient selection criteria to maximize treatment response and minimize toxicity. Extensive toxicity studies and adverse event profiles are being conducted to identify the safest and most effective drug delivery systems for these inhibitors. In the realm of synergistic drug interactions, researchers are exploring combination therapy regimens to enhance the efficacy of BRAF kinase inhibitors.
- Regulatory approval pathways are also being navigated, with a focus on understanding the pharmacodynamic effects and progression-free survival rates in clinical trials. In vitro efficacy studies and in vivo models are crucial components of preclinical development, providing valuable insights into the molecular diagnostics and protein kinase activity of these inhibitors. Pharmacokinetic parameters and dose-response relationships are also being meticulously analyzed to optimize treatment regimens and minimize drug resistance mechanisms. The market for BRAF kinase inhibitors is witnessing a surge in innovation, with the development of allosteric inhibitors and ATP competitive inhibitors. These advancements are expected to yield significant improvements in overall survival benefit for patients, making personalized oncology a promising area of focus.
- As research progresses, the landscape of BRAF kinase inhibitors continues to unfold, with new discoveries and developments shaping the future of targeted cancer therapy.
What are the Key Data Covered in this BRAF Kinase Inhibitors Market Research and Growth Report?
-
What is the expected growth of the BRAF Kinase Inhibitors Market between 2025 and 2029?
-
USD 2.16 billion, at a CAGR of 9%
-
-
What segmentation does the market report cover?
-
The report segmented by Product (Dabrafenib, Sorafenib, Vemurafenib, and Encorafenib), Distribution Channel (Hospital pharmacies, Retail pharmacies, and Online pharmacies), Indication (Metastatic melanoma, Metastatic lung cancer, and Others), and Geography (North America, Europe, Asia, and Rest of World (ROW))
-
-
Which regions are analyzed in the report?
-
North America, Europe, Asia, and Rest of World (ROW)
-
-
What are the key growth drivers and market challenges?
-
High target affinity and specificity of BRAF Kinase inhibitors, High availability of substitute therapies
-
-
Who are the major players in the BRAF Kinase Inhibitors Market?
-
Key Companies Asana BioSciences LLC, Bayer AG, BeiGene Ltd., F. Hoffmann La Roche Ltd., Fore Biotherapeutics, Jazz Pharmaceuticals Plc, Kinnate Biopharma Inc., Nerviano Medical Sciences S.r.l, Novartis AG, Ono Pharmaceutical Co. Ltd., Pfizer Inc., and Pierre Fabre SA
-
Market Research Insights
- The market encompasses a diverse range of pharmaceutical innovations, with ongoing research and development efforts focusing on enhancing inhibitor specificity, safety and tolerability, and treatment guidelines for various cancers. According to recent estimates, the market for BRAF kinase inhibitors is projected to reach USD 12 billion by 2026, representing a significant growth from the USD 7 billion market size in 2021. This expansion is driven by the increasing number of clinical trials evaluating the efficacy of these inhibitors in melanoma treatment options, as well as the continuous advancements in understanding the molecular mechanisms of cancer cell apoptosis and signal transduction cascades.
- However, challenges remain in optimizing drug development pipelines, addressing drug interactions, and overcoming BRAF inhibitor resistance through pharmacokinetic modeling and protein-protein interactions. Additionally, health economic evaluations and selectivity assays are crucial components of the development process to ensure optimal therapeutic index and patient stratification.
We can help! Our analysts can customize this braf kinase inhibitors market research report to meet your requirements.
 RIA -
RIA - 
