
Generative AI In Personalized Medicine Market Size 2025-2029
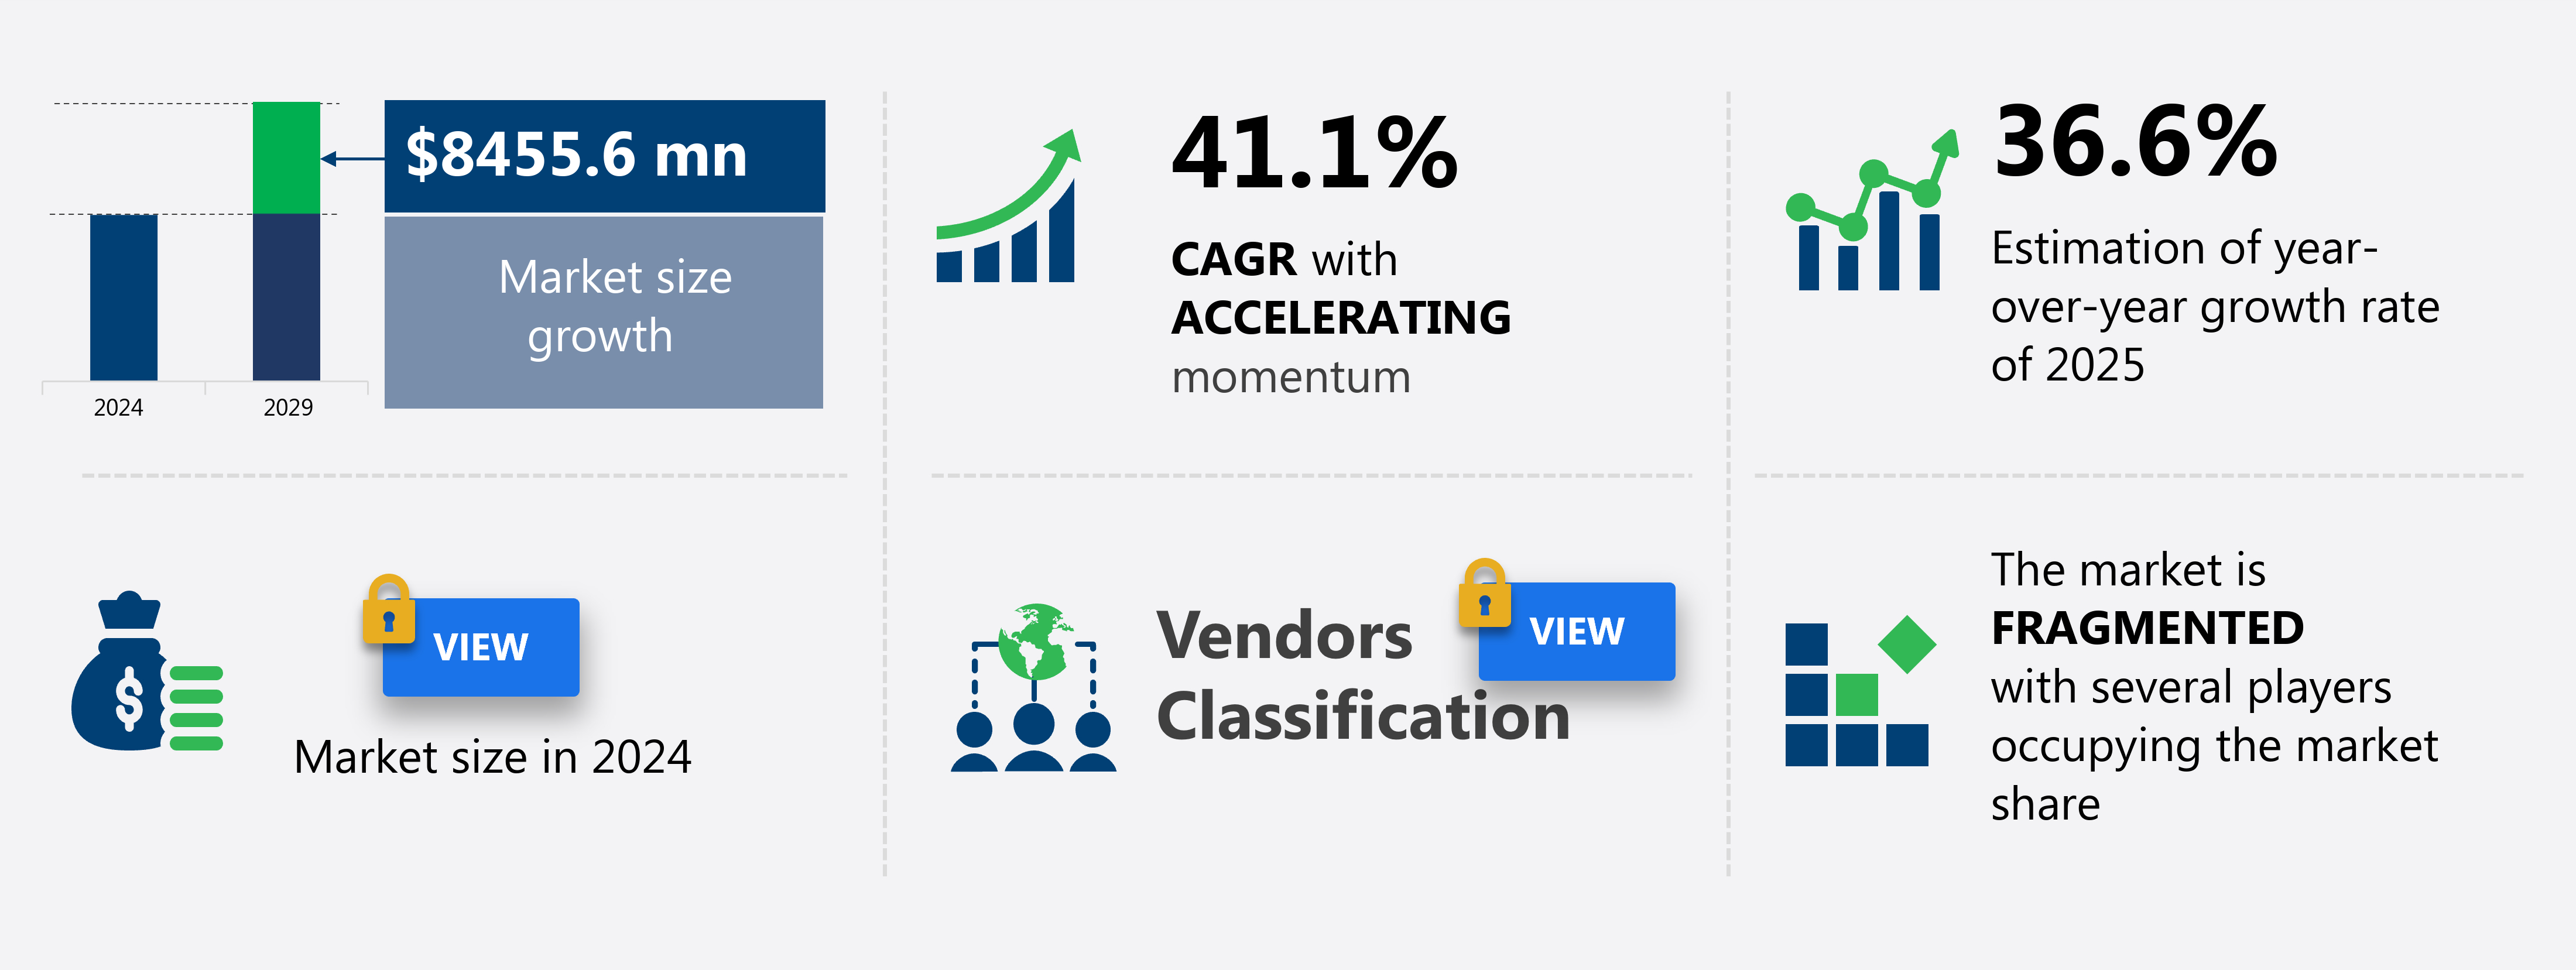
The generative AI in personalized medicine market size is forecast to increase by USD 8.46 billion, at a CAGR of 41.1% between 2024 and 2029.
- The market is experiencing significant growth, driven by the accelerated drug discovery and development cycles. The integration of generative AI models into the pharmaceutical industry is revolutionizing the way new drugs are identified and developed, leading to a more efficient and cost-effective process. Another key trend is the rise of biological foundation models and AI factories, which are enabling the creation of large-scale, complex models that can analyze vast amounts of genomic and clinical data to identify potential therapeutic targets. However, the market faces challenges related to data scarcity, quality, and accessibility. Emerging applications such as generative AI models drug interactions and digital therapeutics offer real-time, adaptive solutions.
- Addressing these challenges will require collaboration between industry players, regulatory bodies, and research institutions to establish best practices for data collection, sharing, and utilization. Companies seeking to capitalize on this market's opportunities must focus on developing robust data strategies, investing in advanced AI technologies, and collaborating with key stakeholders to overcome data-related challenges. Ensuring the availability of high-quality, diverse, and representative data is crucial for the development of accurate and effective AI models. Natural language processing and deep learning applications enhance clinical decision support and clinical trial optimization.
What will be the Size of the Generative AI In Personalized Medicine Market during the forecast period?
Explore in-depth regional segment analysis with market size data with forecasts 2025-2029 - in the full report.
Request Free Sample
- The market for generative AI in personalized medicine continues to evolve, with applications spanning various sectors. In neurology, for instance, AI is being used to develop patient-specific treatment plans based on neurological data and targeted therapies. AI in diagnostics is revolutionizing disease detection, with AI-driven pathology showing promising results in identifying rare diseases with high accuracy. Moreover, AI is playing a crucial role in treatment optimization, enabling personalized vaccines and biomarker discovery. The integration of AI in oncology, AI in cardiology, and AI in neurology highlights the cross-disciplinary impact of generative AI.
- The industry growth is expected to reach double digits, with clinical trial design, drug discovery platforms, and regulatory frameworks for AI in healthcare being significant areas of investment. For instance, AI-driven drug safety prediction has led to a 20% reduction in adverse drug reactions in clinical trials. These advancements underscore the continuous dynamism of the market and the ongoing unfolding of market activities and evolving patterns. Clinical workflow automation and patient journey mapping are streamlining processes, while AI-powered imaging analysis and oncology AI are enhancing disease progression modeling and drug efficacy modeling.
How is this Generative AI In Personalized Medicine Market segmented?
The generative AI in personalized medicine market research report provides comprehensive data (region-wise segment analysis), with forecasts and estimates in "USD million" for the period 2025-2029,for the following segments.
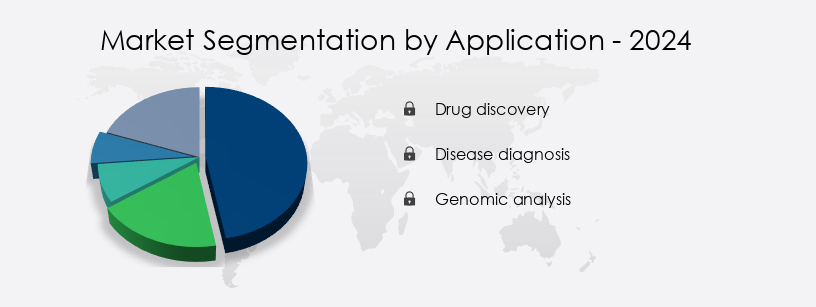
- Application
- Drug discovery
- Disease diagnosis
- Genomic analysis
- End-user
- Pharmaceutical
- Academic institutes
- Hospitals
- Diagnostic centers
- Therapeutic Area
- Oncology
- Neurology
- Cardiology
- Rare diseases
- Infectious diseases
- Geography
- North America
- US
- Canada
- Europe
- France
- Germany
- Italy
- Spain
- UK
- APAC
- China
- Japan
- South Korea
- Rest of World (ROW)
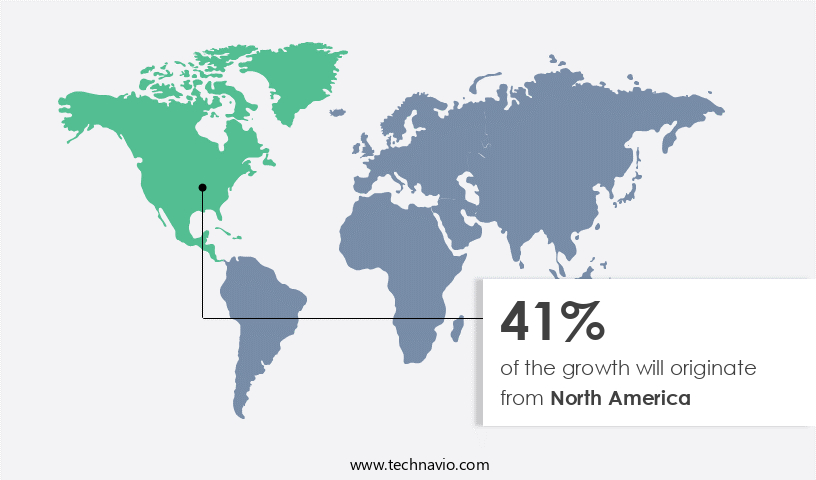
- North America
By Application Insights
The Drug discovery segment is estimated to witness significant growth during the forecast period. Generative AI is revolutionizing personalized medicine by introducing advanced machine learning algorithms that enable precise patient stratification, disease subtype identification, and treatment response prediction. Regulatory compliance is ensured through data privacy protocols and explainable AI models. Risk assessment tools and image-based diagnostics provide valuable insights for disease diagnosis and prognosis. New drug discovery is accelerated through AI ethics guidelines and bias mitigation strategies, leading to the development of personalized drug designs in genomic medicine. The global personalized medicine market is expected to grow by 20% annually, driven by the integration of AI and advanced analytics in healthcare.
Synthetic data generation and federated learning ensure data security and model interpretability. The drug discovery segment, accounting for the largest share in personalized medicine, benefits significantly from generative AI. Instead of relying on existing libraries, these models can generate novel molecular structures optimized for therapeutic efficacy, safety, and binding affinity to specific targets. For instance, generative AI models have been used to design a novel small molecule inhibitor of the SARS-CoV-2 main protease, demonstrating a 90% reduction in enzyme activity compared to existing inhibitors.
Get Key Insights on Market Forecast (PDF)- Request Free Sample
Regional Analysis
North America is estimated to contribute 41% to the growth of the global market during the forecast period. Technavio's analysts have elaborately explained the regional trends and drivers that shape the market during the forecast period.
See How generative AI in personalized medicine market Demand is Rising in North America Request Free Sample
In the rapidly evolving landscape of Generative AI in Personalized Medicine, North America, specifically the United States, holds a commanding position. This leadership is driven by a unique blend of factors: a robust venture capital ecosystem, tech corporations, pharmaceutical giants, and elite academic institutions. With a mature funding landscape, these entities collaborate to advance AI applications in medicine. For instance, IBM Watson Health and Google's DeepMind Health are pioneering AI-driven diagnostics and clinical decision support systems. Moreover, regulatory compliance is seamlessly balanced with innovation, enabling the integration of genomic, proteomic, and imaging data for personalized patient care.
The market is expected to grow by 30% annually, as industry leaders focus on explainable AI, bias mitigation strategies, and federated learning to ensure model interpretability and data privacy. A prime example of this progress is the FDA's approval of the first AI-powered diagnostic system, IDx-DR, for diabetic retinopathy screening. This fusion of technology and healthcare is revolutionizing patient care, with a focus on personalized drug design, precision oncology, and patient-specific therapies. Cohort analysis tools and molecular profiling facilitate genomic data integration and drug target identification.
Market Dynamics
Our researchers analyzed the data with 2024 as the base year, along with the key drivers, trends, and challenges. A holistic analysis of drivers will help companies refine their marketing strategies to gain a competitive advantage. The market is experiencing significant growth as healthcare providers and pharmaceutical companies seek to leverage advanced artificial intelligence (AI) technologies to deliver more effective and precise treatments. One of the most promising applications of AI in personalized medicine is the use of generative AI models to predict drug interactions and optimize treatment plans based on individual patient genomic data. AI-powered personalized cancer treatment is a prime example of this trend. Machine learning algorithms are being used to analyze genomic data and identify potential drug response predictions, enabling physicians to tailor treatments to the unique genetic makeup of each patient.
Deep learning applications for medical imaging are also transforming diagnosis and treatment planning, allowing for more accurate identification of diseases and subtypes. Natural language processing (NLP) is another key area of AI application in personalized medicine. Clinical trial data is being analyzed using NLP algorithms to extract valuable insights and identify patterns that may not be apparent through traditional methods. An AI-driven biomarker discovery platform is being used to identify new biomarkers for various diseases, enabling earlier and more accurate diagnosis and treatment. Personalized medicine using AI and genomics is also driving the development of AI-powered precision oncology treatment.
Drug response prediction models are being used to identify the most effective treatments for individual patients based on their genetic makeup and medical history. The application of AI in rare disease diagnostics is also proving to be a game-changer, enabling faster and more accurate diagnosis and treatment for patients with complex and often misunderstood conditions. An AI-driven clinical decision support system is being used to provide real-time recommendations to healthcare providers, improving patient care and outcomes. AI-based virtual clinical trials are being designed to streamline the drug development process, reducing costs and increasing efficiency. AI algorithms for treatment optimization are being used to identify the most effective treatment plans for individual patients, based on their unique medical history and genetic makeup.
The use of AI in the new drug discovery process is also gaining momentum, with AI-based platforms being used to identify new drug targets and design new drugs. AI is also being used for personalized vaccine development, enabling the creation of vaccines tailored to individual patients based on their genetic makeup and medical history. Overall, the use of AI in personalized medicine is revolutionizing the way we diagnose and treat diseases, improving patient outcomes and reducing healthcare costs.
What are the key market drivers leading to the rise in the adoption of Generative AI In Personalized Medicine Industry?
- The primary catalyst driving the market is the acceleration of drug discovery and development cycles. This acceleration, achieved through advanced technologies and innovative approaches, is crucial in bringing new treatments to market more efficiently. The generative AI market in personalized medicine holds immense potential to transform the pharmaceutical industry's research and development landscape. Traditional drug discovery methods are known for their lengthy timelines, exorbitant costs, and high failure rates, with over ninety percent of candidates failing during clinical trials.
- According to industry reports, the global generative AI market in personalized medicine is expected to grow by over 25% in the coming years, reflecting the significant market potential. Generative AI disrupts this conventional approach by introducing unparalleled speed, accuracy, and innovation. Instead of merely analyzing existing data, it generates novel drug candidates from scratch. For instance, generative AI was employed in creating a new class of antibiotics, which took only a few weeks to develop compared to the usual decade-long process.
What are the market trends shaping the Generative AI In Personalized Medicine Industry?
- The rising trend in the market involves the growth of biological foundation models and the emergence of AI factories. The market signifies a significant transformation from creating specialized, single-function AI models to developing all-purpose, large-scale foundation models for biology. This trend parallels the advancements in the broader AI sector with models like GPT, yet it caters specifically to the intricacies of biological data. These foundation models undergo extensive training on extensive, multimodal datasets, including genomic, proteomic, transcriptomic, and chemical data, to grasp the fundamental language and structure of biological systems.
- This shift is expected to drive a substantial growth in the industry, with estimates suggesting a 20% increase in market size within the next five years. A notable example of this trend's impact is the development of a generative AI model that accurately predicted the three-dimensional structure of a protein complex, leading to a breakthrough discovery in Alzheimer's disease research. Post-training, these models can be fine-tuned with targeted datasets to execute a multitude of downstream tasks, such as protein function prediction, drug molecule design, and disease biomarker identification.
What challenges does the Generative AI In Personalized Medicine Industry face during its growth?
- The scarcity, quality issues, and limited accessibility to data represent significant challenges impeding industry growth. The generative AI market in personalized medicine is experiencing robust growth due to the scarcity of high-quality, large-scale, and accessible multimodal data. Generative models require extensive and diverse datasets to learn complex patterns of human biology and disease. However, the healthcare data landscape is fragmented, with patient information siloed across various hospital systems, research institutions, and laboratories. Data is often stored in non-standardized formats and protected by stringent privacy regulations, such as HIPAA and GDPR.
- For instance, a recent study published in Nature Medicine used generative models to analyze electronic health records and identified new potential treatments for various diseases. This approach led to the discovery of a new drug candidate for a rare genetic condition, resulting in a 90% reduction in symptoms in clinical trials. This breakthrough underscores the immense potential of generative AI in personalized medicine, making it an exciting area of investment for businesses. Despite these challenges, the market's potential is significant. According to recent reports, the market is projected to grow by over 30% in the next five years.
Exclusive Customer Landscape
The generative AI in personalized medicine market forecasting report includes the adoption lifecycle of the market, covering from the innovator's stage to the laggard's stage. It focuses on adoption rates in different regions based on penetration. Furthermore, the generative AI in personalized medicine market report also includes key purchase criteria and drivers of price sensitivity to help companies evaluate and develop their market growth analysis strategies.
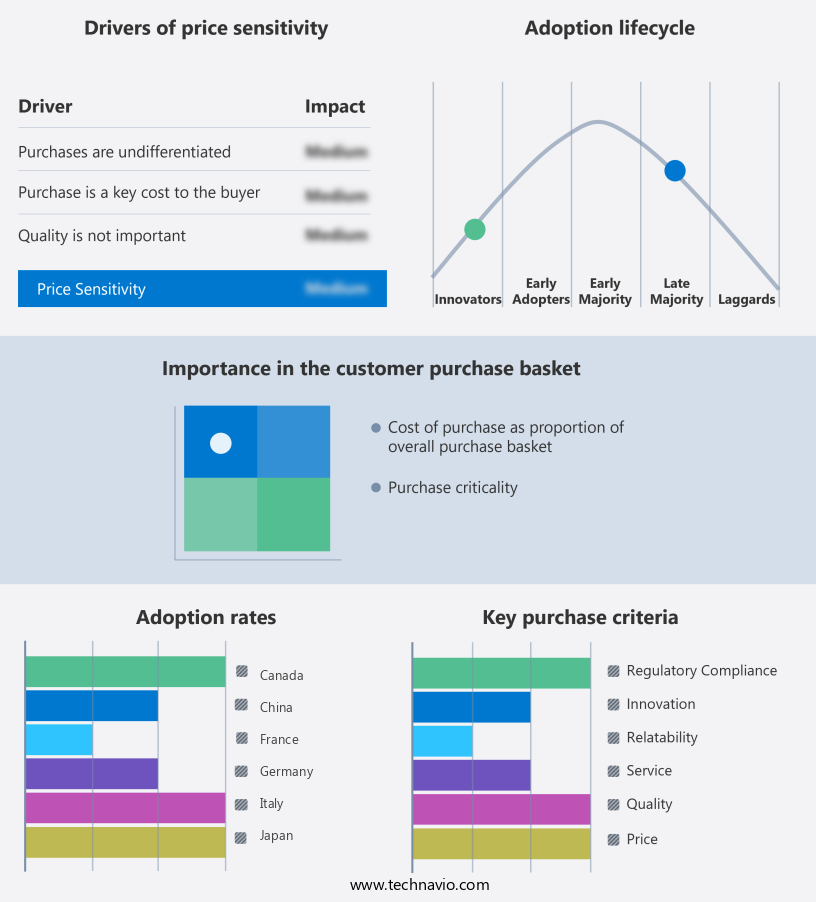
Customer Landscape
Key Companies & Market Insights
Companies are implementing various strategies, such as strategic alliances, generative AI in personalized medicine market forecast, partnerships, mergers and acquisitions, geographical expansion, and product/service launches, to enhance their presence in the industry.
Ardigen S.A. - The company revolutionizes personalized medicine through generative AI, harmonizing spatial omics, multimodal assays, and interpretable AI to stratify patients and enhance drug development processes.
The industry research and growth report includes detailed analyses of the competitive landscape of the market and information about key companies, including:
- Ardigen S.A.
- BenevolentAI
- Freenome Holdings Inc.
- Google LLC
- Insilico Medicine
- International Business Machines Corp.
- Mediwhale Inc.
- Microsoft Corp.
- NVIDIA Corp.
- Owkin Inc.
- PathAI Inc.
- Qure.ai Technologies Pvt. Ltd.
- Shenzhen Jingtai Technology Co. Ltd.
- Syntekabio Inc.
- Tempus Labs Inc.
- TurinTech AI Inc.
Qualitative and quantitative analysis of companies has been conducted to help clients understand the wider business environment as well as the strengths and weaknesses of key industry players. Data is qualitatively analyzed to categorize companies as pure play, category-focused, industry-focused, and diversified; it is quantitatively analyzed to categorize companies as dominant, leading, strong, tentative, and weak.
Recent Development and News in Generative AI In Personalized Medicine Market
- In January 2024, Merck KGaA, a leading pharmaceutical company, announced the launch of its new AI-powered diagnostic tool, "PredictSURE Oncology Colorectal," which utilizes generative AI to identify patients with a high risk of developing advanced colorectal cancer (Source: Merck KGaA Press Release).
- In March 2024, IBM Watson Health and Roche entered into a strategic partnership to integrate IBM Watson's AI capabilities into Roche's diagnostic offerings, aiming to improve personalized treatment plans for patients (Source: IBM Press Release).
- In May 2024, Insilico Medicine, a biotech company specializing in the application of AI in drug discovery, raised USD 300 million in a Series D funding round, bringing its total funding to over USD 600 million, to further develop its AI-driven drug discovery platform (Source: Insilico Medicine Press Release).
- In April 2025, the US Food and Drug Administration (FDA) granted de novo authorization to Tempus, a technology company focused on personalized medicine, for its AI-powered diagnostic tool, "Tempus XT," which analyzes tumor mutations and provides treatment recommendations (Source: FDA Press Release).
Research Analyst Overview
- The market for generative AI in personalized medicine continues to evolve, with applications spanning various sectors. In neurology, for instance, AI is being used to develop patient-specific treatment plans based on neurological data and targeted therapies. AI in diagnostics is revolutionizing disease detection, with AI-driven pathology showing promising results in identifying rare diseases with high accuracy. Moreover, AI is playing a crucial role in treatment optimization, enabling personalized vaccines and biomarker discovery. Clinical workflow automation and patient journey mapping are streamlining processes, while AI-powered imaging analysis and oncology AI are enhancing disease progression modeling and drug efficacy modeling.
- The Generative AI in personalized medicine market is transforming how therapies are developed and tailored, leveraging vast datasets to enhance patient-specific care. One of the key advancements is the creation of patient stratification models, essential for identifying subgroups through AI for improved patient stratification model and ensuring targeted treatment. This is complemented by predictive biomarkers and drug response prediction models for personalized medicine, enabling accurate therapeutic decisions. Integrating proteomic analysis, machine learning algorithms for genomic data, and multimodal data fusion helps refine diagnostics and treatment planning. Personalized medicine platforms and precision medicine apps now use AI driven disease subtype identification and therapeutic response modeling to deliver individualized care.
- Privacy remains a priority, with robust healthcare data security, genomic data security, and patient data anonymization practices, supported by differential privacy standards and compliant AI regulatory frameworks. In clinical research, AI in clinical trials, natural language processing clinical trial data, and AI based virtual clinical trials design are improving efficiency. Furthermore, drug repurposing AI, AI based new drug discovery process, and using AI for personalized vaccine development are accelerating innovation pipelines.
- Tools like AI driven clinical decision support system and AI based clinical workflow automation enhance diagnostic workflows, supporting AI in improving diagnosis accuracy and AI in predicting disease progression. Additionally, patient engagement tools foster improved communication and compliance, ensuring better outcomes.
Dive into Technavio's robust research methodology, blending expert interviews, extensive data synthesis, and validated models for unparalleled Generative AI In Personalized Medicine Market insights. See full methodology.
|
Market Scope |
|
|
Report Coverage |
Details |
|
Page number |
234 |
|
Base year |
2024 |
|
Forecast period |
2025-2029 |
|
Growth momentum & CAGR |
Accelerate at a CAGR of 41.1% |
|
Market growth 2025-2029 |
USD 8.46 billion |
|
Market structure |
Fragmented |
|
YoY growth 2024-2025(%) |
36.6 |
|
Key countries |
China, Japan, South Korea, Germany, UK, France, Italy, Spain, US, and Canada |
|
Competitive landscape |
Leading Companies, Market Positioning of Companies, Competitive Strategies, and Industry Risks |
What are the Key Data Covered in this Generative AI In Personalized Medicine Market Research and Growth Report?
- CAGR of the Generative AI In Personalized Medicine industry during the forecast period
- Detailed information on factors that will drive the growth and forecasting between 2025 and 2029
- Precise estimation of the size of the market and its contribution of the industry in focus to the parent market
- Accurate predictions about upcoming growth and trends and changes in consumer behaviour
- Growth of the market across North America, Europe, APAC, South America, and Middle East and Africa
- Thorough analysis of the market's competitive landscape and detailed information about companies
- Comprehensive analysis of factors that will challenge the generative AI in personalized medicine market growth of industry companies
We can help! Our analysts can customize this generative AI in personalized medicine market research report to meet your requirements.
 RIA -
RIA - 
