
Business Software Services Market Size 2026-2030
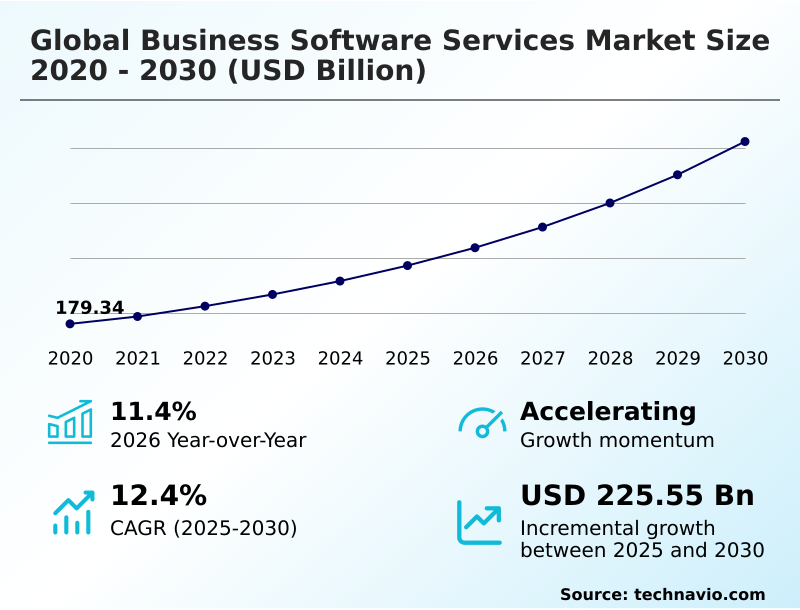
The business software services market size is valued to increase by USD 225.55 billion, at a CAGR of 12.4% from 2025 to 2030. Integration of AI and agentic capabilities will drive the business software services market.
Major Market Trends & Insights
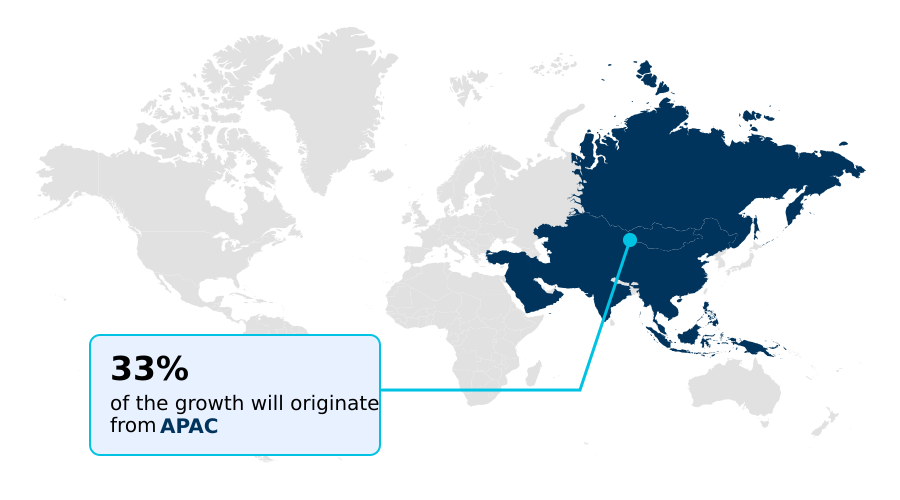
- APAC dominated the market and accounted for a 32.9% growth during the forecast period.
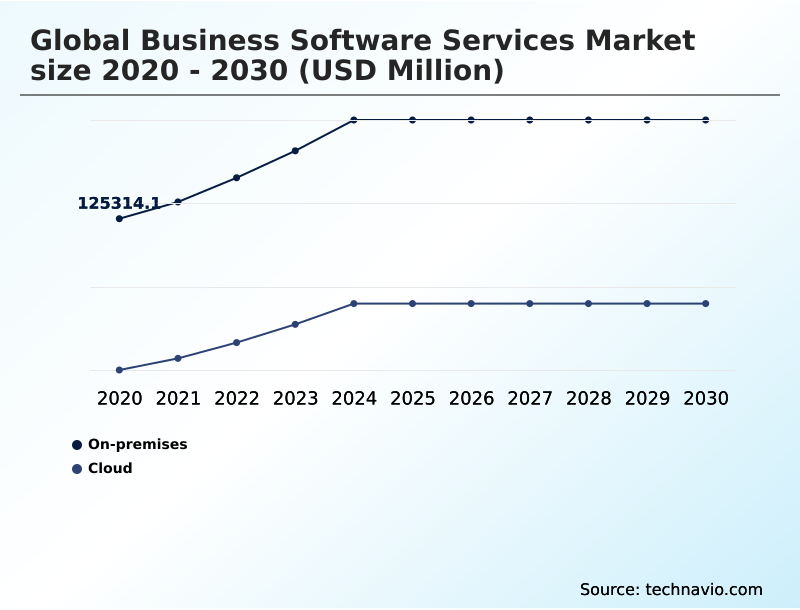
- By Deployment - On-premises segment was valued at USD 171.82 billion in 2024
- By End-user - Large enterprises segment accounted for the largest market revenue share in 2024
Market Size & Forecast
- Market Opportunities: USD 331.51 billion
- Market Future Opportunities: USD 225.55 billion
- CAGR from 2025 to 2030 : 12.4%
Market Summary
- The Business Software Services market is defined by a rapid push toward comprehensive digital transformation, compelling organizations to adopt advanced platforms that streamline core operations. This evolution is primarily driven by the integration of agentic artificial intelligence and the accelerated adoption of hybrid cloud environments, which together enable proactive intelligent systems and autonomous task execution.
- For example, a manufacturing firm can leverage an integrated suite of enterprise resource planning, supply chain management, and industrial IoT software to achieve real-time insights into its production lines. By deploying predictive analytics, the company can anticipate maintenance needs, optimize inventory through workflow automation, and ensure resilient supply chain integrations, thereby minimizing downtime and improving output.
- However, this increased connectivity introduces challenges, including escalating cybersecurity threats and the need for robust data privacy frameworks like zero-trust architectures. The market is also shaped by a trend toward consumption-based pricing, allowing businesses greater flexibility in managing software expenditures as they scale their enterprise automation and analytics solutions.
What will be the Size of the Business Software Services Market during the forecast period?
Get Key Insights on Market Forecast (PDF) Get Free Sample
How is the Business Software Services Market Segmented?
The business software services industry research report provides comprehensive data (region-wise segment analysis), with forecasts and estimates in "USD million" for the period 2026-2030, as well as historical data from 2020-2024 for the following segments.
- Deployment
- On-premises
- Cloud
- End-user
- Large enterprises
- SMEs
- Sector
- BFSI
- IT and telecommunications
- Manufacturing
- Retail and e-commerce
- Others
- Geography
- North America
- US
- Canada
- Mexico
- Europe
- Germany
- UK
- France
- APAC
- China
- Japan
- India
- South America
- Brazil
- Argentina
- Middle East and Africa
- Saudi Arabia
- UAE
- South Africa
- Rest of World (ROW)
- North America
By Deployment Insights
The on-premises segment is estimated to witness significant growth during the forecast period.
On-premises deployment remains a critical component, particularly for organizations prioritizing data control and security for mission-critical applications. This model is favored for core enterprise resource planning and supply chain management, where performance and data sovereignty are paramount.
While cloud ERP solutions are gaining traction, many firms adopt a hybrid approach, using on-premises infrastructure to manage sensitive data and content management functions while leveraging cloud services for digital transformation initiatives that demand data-driven agility.
This strategy allows for gradual modernization without compromising security, integrating business process management and robotic process automation locally.
For instance, companies in regulated industries achieve over 99% data control for sensitive operations by keeping their core systems in-house, supported by low-code development for custom interfaces and integrated workplace management tools.
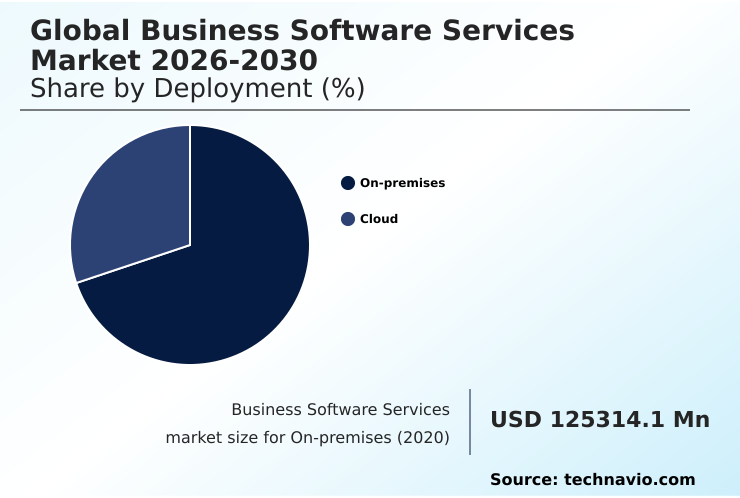
The On-premises segment was valued at USD 171.82 billion in 2024 and showed a gradual increase during the forecast period.
Regional Analysis
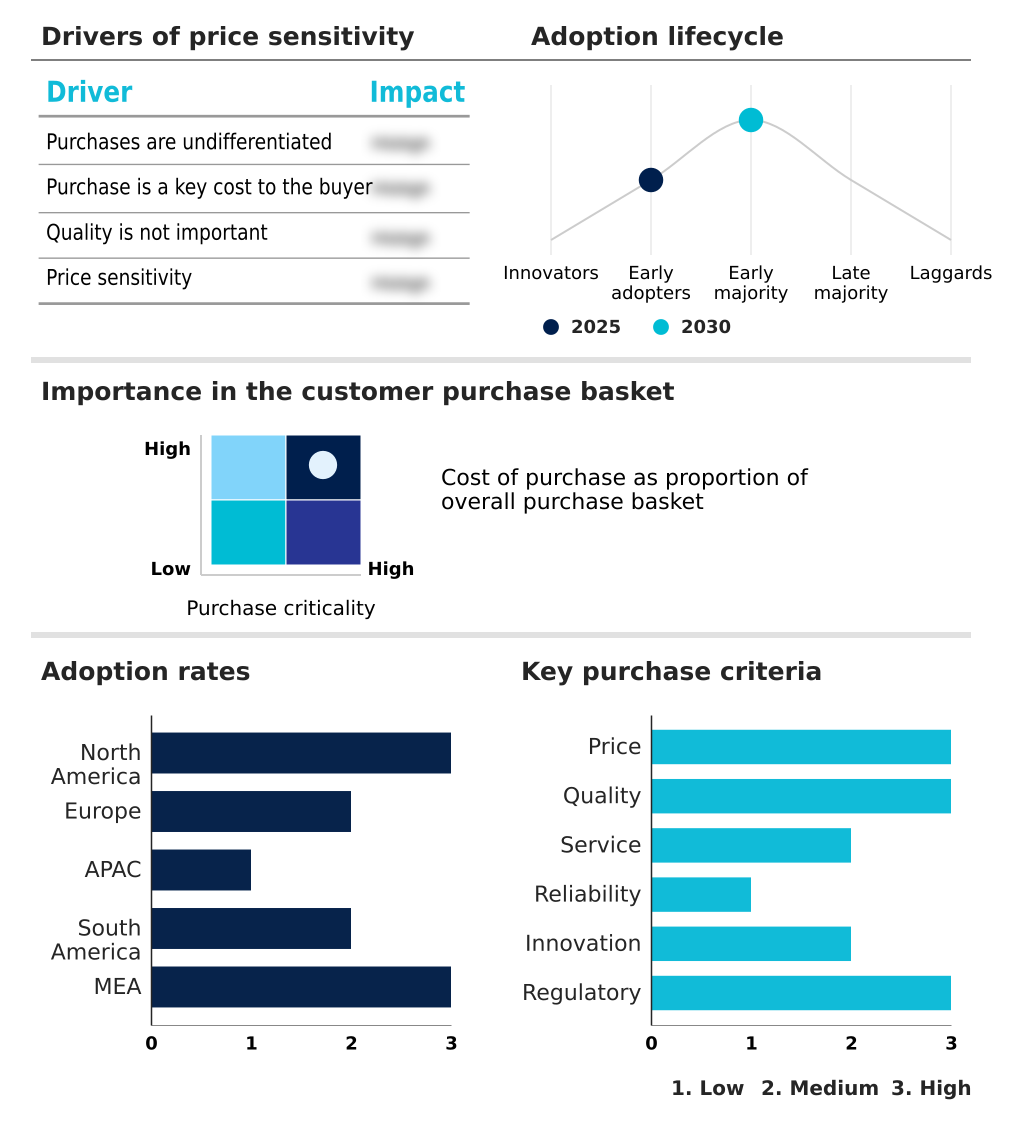
APAC is estimated to contribute 32.9% to the growth of the global market during the forecast period.Technavio’s analysts have elaborately explained the regional trends and drivers that shape the market during the forecast period.
See How Business Software Services Market Demand is Rising in APAC Get Free Sample
The geographic landscape of the market is characterized by strong but varied regional dynamics, with North America and Europe representing mature markets driven by high digital adoption.
These regions focus on enterprise modernization and the deployment of advanced data and analytics tools for financial asset management and human resource and payroll functions.
Meanwhile, APAC is the primary engine of incremental growth, contributing nearly 33% of the market's expansion as enterprises in countries like India and China rapidly adopt cloud-based solutions. This is significantly higher than North America's contribution of approximately 30%.
Key enterprise application vendors are tailoring office productivity applications and communication and collaboration platforms with conversational interfaces to meet diverse regional needs, while predictive analytics and end-to-end process redesign for resilient supply chain integrations are prioritized globally.
Market Dynamics
Our researchers analyzed the data with 2025 as the base year, along with the key drivers, trends, and challenges. A holistic analysis of drivers will help companies refine their marketing strategies to gain a competitive advantage.
- Strategic adoption of business software services requires a nuanced understanding of how different technologies converge to drive value. Organizations evaluating their options must consider erp and crm integration challenges to ensure a unified view of customer and operational data.
- The decision to pursue cloud migration services for enterprises is no longer just about cost, but about gaining access to scalable platforms for enterprise modernization with ai platforms. Success hinges on leveraging ai in enterprise automation software and exploring robotic process automation implementation use cases to free up human capital.
- For smaller firms, saas development for small businesses and transparent managed it services pricing models are critical enablers. In industrial sectors, the industrial iot platform for manufacturing provides unparalleled visibility. Architecturally, a multi-cloud architecture implementation strategy is becoming standard, but it must be paired with robust cybersecurity for cloud erp systems and a zero-trust architecture for data security.
- The rise of low-code development platform benefits empowers business users, while investments in business intelligence and data discovery tools unlock data's value. From supply chain management automation software to predictive analytics in crm software, the focus is on measurable outcomes.
- Agentic ai for workflow optimization in hybrid cloud solutions for large enterprises is transforming productivity, with companies using such systems reporting a 40% improvement in forecast accuracy. This transition is supported by flexible consumption-based pricing models for software and a focus on data privacy compliance in saas, ensuring the unified worktech platform for productivity remains secure.
What are the key market drivers leading to the rise in the adoption of Business Software Services Industry?
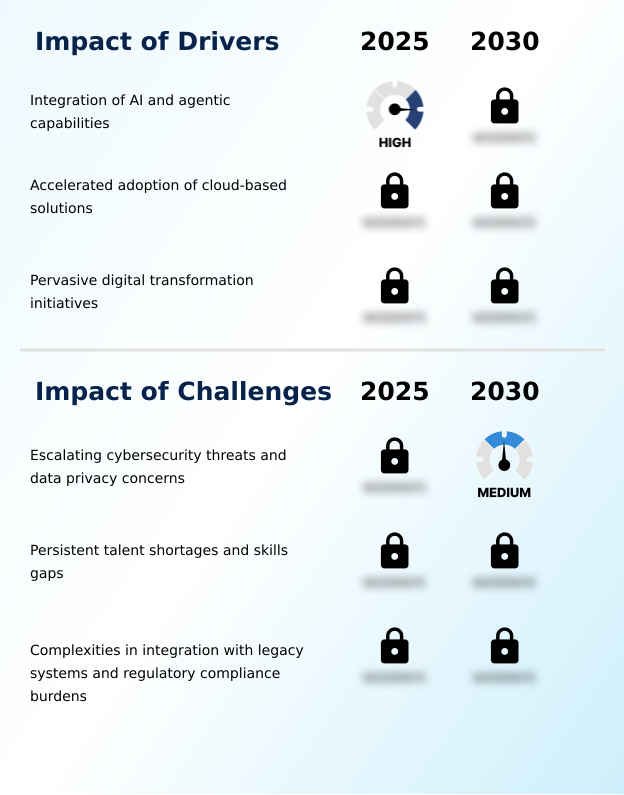
- The integration of AI and agentic capabilities is a primary driver reshaping enterprise software and accelerating market growth through enhanced automation and intelligence.
- The primary driver fueling market expansion is the integration of intelligent technologies into core business functions. Organizations are leveraging digital transformation initiatives to embed proactive intelligent systems within their hybrid cloud environments and multi-cloud architectures.
- This enables autonomous task execution and delivers real-time insights for more adaptive processes. With 75% of firms planning investments, the adoption of a unified worktech platform with features like hyper-personalization is accelerating.
- The implementation of industrial IoT and advanced customer relationship management and workplace management solutions facilitates deep workflow automation across the enterprise.
- This technological push is transforming traditional software into dynamic systems that can accelerate strategic outcomes by as much as 30%, creating significant competitive advantages for early adopters.
What are the market trends shaping the Business Software Services Industry?
- The market is experiencing a significant shift toward flexible subscription and consumption-based pricing models. This evolution aligns revenue more closely with actual usage and the value delivered.
- A significant market trend is the widespread shift away from rigid licensing toward flexible subscription models and consumption-based pricing. This evolution is driven by enterprise demand for greater cost control and transparency, particularly as the use of agentic artificial intelligence and automation and analytics introduces variable operational expenses.
- By adopting outcome-oriented packaging and hybrid pricing approaches, companies can better align software spending with actual value delivered, reducing budget redundancy by up to 25%. This move toward cloud-native environments and SaaS development is supported by real-time monitoring tools that offer insights into usage, enabling value-based models.
- These advancements in business intelligence and data discovery tools help improve cost predictability by nearly 40%, making sophisticated software-as-a-service models more accessible to a broader range of organizations.
What challenges does the Business Software Services Industry face during its growth?
- Escalating cybersecurity threats and data privacy concerns represent a significant challenge, demanding rigorous compliance and advanced security measures across business software services.
- Despite strong growth drivers, the market faces significant challenges from escalating cybersecurity threats and stringent data privacy concerns. The extensive cloud migration of enterprise automation and analytics solutions creates larger attack surfaces. The rise of sophisticated, AI-driven attacks means that a single breach can cost an organization over five times its initial software investment.
- Consequently, businesses are demanding embedded security features like zero-trust architectures and automated threat detection to build resilient ecosystems. Failure to comply with data privacy regulations can result in fines reaching up to 4% of global annual revenue.
- This environment pressures providers of managed IT services and enterprise application development to prioritize security in billing and data management systems and across big data platforms, as the deployment of agentic systems introduces new vulnerabilities.
Exclusive Technavio Analysis on Customer Landscape
The business software services market forecasting report includes the adoption lifecycle of the market, covering from the innovator’s stage to the laggard’s stage. It focuses on adoption rates in different regions based on penetration. Furthermore, the business software services market report also includes key purchase criteria and drivers of price sensitivity to help companies evaluate and develop their market growth analysis strategies.
Customer Landscape of Business Software Services Industry
Competitive Landscape
Companies are implementing various strategies, such as strategic alliances, business software services market forecast, partnerships, mergers and acquisitions, geographical expansion, and product/service launches, to enhance their presence in the industry.
Accenture Plc - Analysis points to integrated services for enterprise application development, cloud migration, and ERP implementation, delivering end-to-end digital transformation.
The industry research and growth report includes detailed analyses of the competitive landscape of the market and information about key companies, including:
- Accenture Plc
- Acumatica Inc.
- Binmile Technologies Pvt. Ltd.
- Comarch SA
- Epicor Software Corp.
- Eptura Inc.
- IBM Corp.
- IBS Software Pvt. Ltd.
- Johnson Controls International
- Microsoft Corp.
- Oracle Corp.
- Orient Software Development
- OverIT S.p.A
- Planon Group
- PTC Inc.
- Sage Group Plc
- Salesforce Inc.
- SAP SE
- SLK Software
- Yardi Systems Inc.
Qualitative and quantitative analysis of companies has been conducted to help clients understand the wider business environment as well as the strengths and weaknesses of key industry players. Data is qualitatively analyzed to categorize companies as pure play, category-focused, industry-focused, and diversified; it is quantitatively analyzed to categorize companies as dominant, leading, strong, tentative, and weak.
Recent Development and News in Business software services market
- In October 2024, Goldman Sachs updated its internal software to include predictive analytics for its wealth management services, enabling better investment advice based on market trends.
- In January 2025, IBM announced its planned acquisition of Applications Software Technology LLC to strengthen its public sector cloud transformation and Oracle-related capabilities.
- In February 2025, Salesforce announced a major expansion of its Agentforce AI platform, which allows companies to automate customer service and sales tasks with greater precision.
- In May 2025, IBM and Oracle expanded their partnership to integrate watsonx with Oracle Cloud Infrastructure, advancing agentic AI and hybrid cloud solutions for enterprises.
Dive into Technavio’s robust research methodology, blending expert interviews, extensive data synthesis, and validated models for unparalleled Business Software Services Market insights. See full methodology.
| Market Scope | |
|---|---|
| Page number | 295 |
| Base year | 2025 |
| Historic period | 2020-2024 |
| Forecast period | 2026-2030 |
| Growth momentum & CAGR | Accelerate at a CAGR of 12.4% |
| Market growth 2026-2030 | USD 225545.6 million |
| Market structure | Fragmented |
| YoY growth 2025-2026(%) | 11.4% |
| Key countries | US, Canada, Mexico, Germany, UK, France, Italy, Spain, The Netherlands, China, Japan, India, South Korea, Australia, Indonesia, Brazil, Argentina, Chile, Saudi Arabia, UAE, South Africa, Israel and Turkey |
| Competitive landscape | Leading Companies, Market Positioning of Companies, Competitive Strategies, and Industry Risks |
Research Analyst Overview
- The business software services market is undergoing a profound shift, driven by the convergence of multiple technologies that are reshaping enterprise operations. Boardroom decisions now center on harnessing agentic artificial intelligence, with industry data indicating that 75% of companies plan investments in these systems to drive automation and analytics.
- This requires a cohesive strategy for managing hybrid cloud environments and multi-cloud architectures, which serve as the foundation for modern enterprise application development and SaaS development. Core platforms like enterprise resource planning, customer relationship management, and supply chain management are being transformed through enterprise automation.
- The adoption of a unified worktech platform, integrating office productivity applications with communication and collaboration tools, is critical. Successful deployment depends on effective cloud migration, robust managed IT services, and a focus on industrial IoT and product lifecycle management in relevant sectors.
- Key enablers include business process management, robotic process automation, and cloud-native environments, supported by data and analytics tools such as big data platforms, business intelligence, and data discovery tools for data and content management.
- Ultimately, enterprise application vendors that offer comprehensive cloud ERP solutions focused on financial asset management, human resource and payroll, and enterprise modernization through software-as-a-service models are best positioned for growth.
What are the Key Data Covered in this Business Software Services Market Research and Growth Report?
-
What is the expected growth of the Business Software Services Market between 2026 and 2030?
-
USD 225.55 billion, at a CAGR of 12.4%
-
-
What segmentation does the market report cover?
-
The report is segmented by Deployment (On-premises, and Cloud), End-user (Large enterprises, and SMEs), Sector (BFSI, IT and telecommunications, Manufacturing, Retail and e-commerce, and Others) and Geography (North America, Europe, APAC, South America, Middle East and Africa)
-
-
Which regions are analyzed in the report?
-
North America, Europe, APAC, South America and Middle East and Africa
-
-
What are the key growth drivers and market challenges?
-
Integration of AI and agentic capabilities, Escalating cybersecurity threats and data privacy concerns
-
-
Who are the major players in the Business Software Services Market?
-
Accenture Plc, Acumatica Inc., Binmile Technologies Pvt. Ltd., Comarch SA, Epicor Software Corp., Eptura Inc., IBM Corp., IBS Software Pvt. Ltd., Johnson Controls International, Microsoft Corp., Oracle Corp., Orient Software Development, OverIT S.p.A, Planon Group, PTC Inc., Sage Group Plc, Salesforce Inc., SAP SE, SLK Software and Yardi Systems Inc.
-
Market Research Insights
- The market's momentum is sustained by a clear enterprise focus on achieving data-driven agility and operational efficiency through modern platforms. Organizations are increasingly adopting cloud-based solutions that offer proactive intelligent systems and hyper-personalization, with adoption rates for such platforms showing a 35% year-over-year increase in some sectors.
- This shift is fueled by the demand for real-time insights and adaptive processes that support strategic decision-making. As many as 75% of companies are planning investments in agentic systems to enable autonomous task execution and workflow automation, which has been shown to reduce operational redundancies by up to 30%.
- The emphasis on outcome-oriented packaging and value-based models is reshaping vendor-client relationships, pushing providers to deliver measurable returns through end-to-end process redesign and real-time monitoring capabilities.
We can help! Our analysts can customize this business software services market research report to meet your requirements.
 RIA -
RIA - 
